Stop Trading Random Candles: Identify Intraday Trend First# Intraday Trend Identification: Stop Trading Random Candles 📊
Most beginners lose money in intraday trading because they focus only on one candle.
One green candle = Buy
One red candle = Sell
But professional traders do not trade like that.
They first ask one simple question:
**“Who is controlling today’s market — buyers, sellers, or nobody?”**
That is called **Intraday Trend Identification**.
------------------------------------------
## 1. Understand the Market Condition First
Before taking any trade, identify whether the market is:
✅ Bullish
✅ Bearish
✅ Sideways
--> If the market is bullish, focus on buying opportunities.
--> If the market is bearish, focus on selling opportunities.
--> If the market is sideways, avoid overtrading.
The biggest mistake beginners make is using the same strategy in every market condition.
------------------------------------------
## 2. Bullish Intraday Trend
A bullish intraday trend forms when price makes:
**Higher Highs + Higher Lows**
This means buyers are active and every dip is being bought.
In this condition, do not chase big green candles.
Instead, wait for price to come near:
• Support
• VWAP
• 20 EMA
• Breakout retest zone
Then look for confirmation.
The best buying opportunity usually comes on a pullback, not after a huge candle.
------------------------------------------
## 3. Bearish Intraday Trend
A bearish intraday trend forms when price makes:
**Lower Highs + Lower Lows**
This means sellers are active and every bounce is being sold.
In this condition, avoid buying only because price has fallen too much.
Instead, wait for price to pull back near:
• Resistance
• VWAP
• 20 EMA
• Breakdown retest zone
Then check if sellers are again becoming active.
------------------------------------------
## 4. Sideways Market
A sideways market forms when price keeps moving between support and resistance.
In this condition:
• VWAP becomes flat
• EMAs get tangled
• Breakouts fail quickly
• Candles show wicks on both sides
• Both buyers and sellers get trapped
This is where many traders lose money because they keep taking trades without clear direction.
Sometimes, the best trade is no trade.
------------------------------------------
## 5. Use VWAP for Intraday Bias
VWAP is one of the simplest tools for intraday trend identification.
--> Price above VWAP = Bullish bias
--> Price below VWAP = Bearish bias
--> Price around VWAP = Choppy market
But remember, VWAP alone is not enough.
Always combine it with price structure, support/resistance, candle close, and volume.
------------------------------------------
## 6. Opening Range Matters
The first 15–30 minutes of the market are very important.
Mark the high and low of the opening range.
--> If price breaks above the opening range high and sustains, buyers may be stronger.
--> If price breaks below the opening range low and sustains, sellers may be stronger.
But do not trade only on a wick breakout.
Wait for a proper candle close and follow-through.
------------------------------------------
## 7. Simple Intraday Trend Formula
Use this formula before taking a trade:
**Trend = Structure + Level + VWAP + Volume + Candle Close**
If all these factors support the same direction, the trade quality improves.
Example:
--> If price is making higher highs and higher lows, staying above VWAP, holding support, and moving with volume, then bullish bias is stronger.
--> If price is making lower highs and lower lows, staying below VWAP, rejecting resistance, and falling with volume, then bearish bias is stronger.
------------------------------------------
## 8. Best Beginner Rule
Do not trade every candle.
Trade only when the market shows clear direction.
--> In a bullish market, buy near logical support.
--> In a bearish market, sell near logical resistance.
In a sideways market, reduce trades and wait for clarity.
------------------------------------------
## Important Note:
Intraday trading is not about predicting every move.
It is about identifying the current market control and trading with discipline.
--> If buyers are in control, avoid random shorts.
--> If sellers are in control, avoid random buying.
--> If nobody is in control, protect your capital.
**First identify the trend.
Then wait for the right entry.
Then manage your risk.**
That is how intraday trading becomes structured, not emotional.
------------------------------------------
Educational Purpose Only.
 Education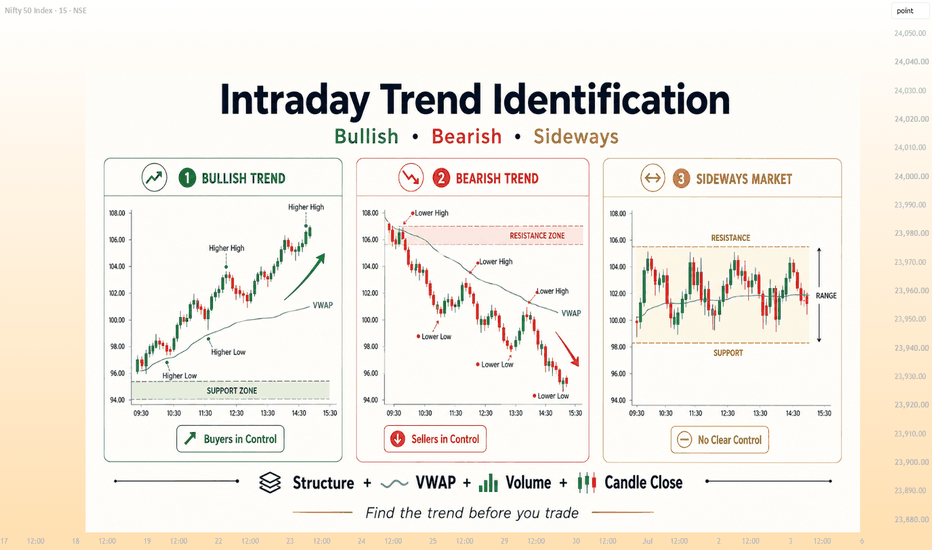
Education

NIFTY (D): Bulls Gain Traction As Kumo Breakout MaturesA Kumo Breakout is the trigger, not the final confirmation of a bullish Ichimoku structure.
Six conditions should to be monitored for every Kumo breakout:
1)Price above the Kumo
2)Chikou Span above the Cloud Top
3)Tenkan-sen above the Cloud Top
4)Kijun-sen above the Cloud Top (still pending)
5)Tenkan-sen above Kijun-sen
6)Future Kumo turning bullish
At the breakout, only price had confirmed the move. Chikou, Tenkan, Kijun, and the Future Kumo were all yet to align. Since then, the breakout has matured, with 5 of the 6 Ichimoku conditions now confirmed. The Kijun-sen remains the final pending confirmation—it has started sloping upward but is yet to clear the Cloud Top.
As long as price holds above the Kumo Breakout Invalidation Level (23,589), the bullish thesis remains intact. The marked Upper Reference Levels (24,389 • 24,589 • 24,789) are the next areas to watch if the if the breakout continues to mature.
Key Takeaway: A Kumo Breakout starts the trend. Its quality is determined by how the remaining Ichimoku conditions progressively align.
Are we now progressing towards a bullish regime shift on Nifty? Thoughts welcome Bank Nifty Poised for BreakoutHighlights
* Bank Nifty continues to outperform the broader market, maintaining a strong bullish structure with the index trading comfortably above its key short-, medium-, and long-term moving averages. Momentum indicators such as RSI and MACD remain supportive, reflecting sustained buying interest.
* The 58,000 level has emerged as an important pivot. Sustaining above this zone keeps the near-term trend positive and increases the probability of an extension towards higher resistance levels.
* Immediate resistance is seen in the 58,400–58,500 zone. A decisive breakout above this range could pave the way for a rally towards 58,900–59,300, with some market experts projecting the potential for the index to eventually approach the 60,000 mark if bullish momentum persists.
* On the downside, the 57,500–57,650 zone remains the key support area. Holding above this range would reinforce the prevailing uptrend, while a breach could trigger short-term profit booking.
* Strength in heavyweight private sector banks and select NBFCs continues to underpin the index. Improved macroeconomic sentiment, easing crude oil prices, moderating bond yields, and renewed institutional buying are also providing a favorable backdrop for financial stocks.
Takeaway
Bank Nifty's technical outlook remains firmly bullish, with the index holding above critical support levels and displaying strong momentum. A sustained move above 58,500 would confirm a fresh breakout and could accelerate gains towards the 59,000–60,000 zone. Until then, traders may continue to adopt a buy-on-dips strategy while closely monitoring price action around the 58,000 pivot and participation from leading banking stocks.
 Short
Short
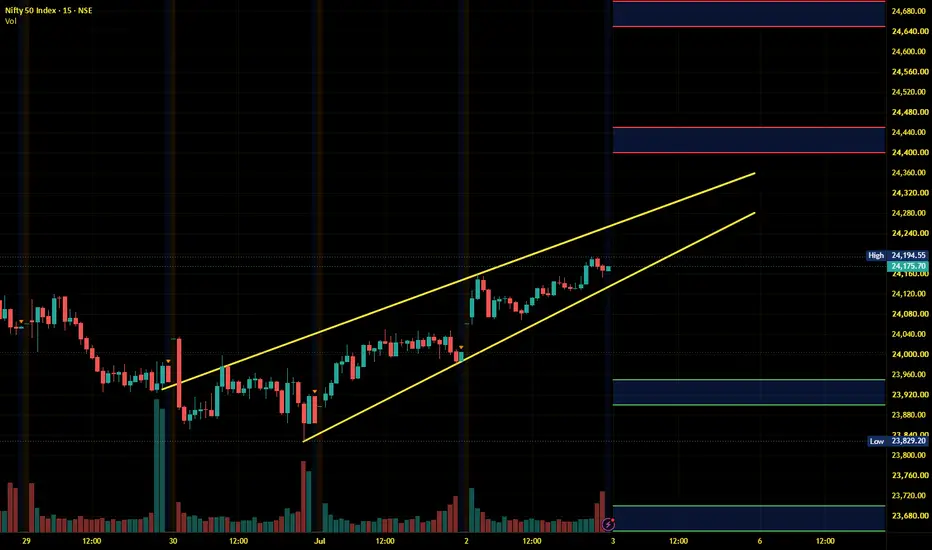
NIFTY Intraday Update 03-07-2026NIFTY Intraday Update — Decision Zone Active
Nifty has already given a strong gap-up move and is now trading around 24,344.
But at this level, the chart is clearly showing a Decision Zone / No Trading Zone.
Price is stuck between:
Resistance: 24,380
Support: 24,290
Until one side breaks clearly, fresh entry can be risky.
Bullish View
If Nifty gives a 15-min candle close above 24,378, then the bullish momentum can continue.
Upside levels:
Target 1: 24,430
Target 2: 24,500
This breakout will confirm that buyers are still active after the gap-up opening.
Bearish View
If Nifty breaks and sustains below 24,295, then the current strength may turn into intraday profit booking.
Downside levels:
Target 1: 24,2400
Target 2: 24,190
Below 24,295, sellers may try to fill part of the morning gap.
Current Price Action Reading
The first rejection near the resistance zone shows that 24,380 is important supply.
At the same time, price is still holding above support, so we cannot call it bearish yet.
So the best plan is simple:
Above 24,380→ Bulls active
Below 24,290 → Bears active
Between both levels → No trade / wait zone / only scalping in no trading zone
Final View
Nifty is positive on the broader intraday structure, but after a gap-up opening, chasing in the middle zone is not ideal.
Let the market decide first.
Breakout above resistance = continuation trade
Breakdown below support = profit-booking trade
Trade with confirmation, not emotion.
Educational purpose only. #NIFTY Intraday Support and Resistance Levels - 03/07/2026Nifty is expected to open with a gap-up bias around the 24150–24170 zone, reflecting positive momentum at the start of the session. The index has sustained above the immediate support area, and buyers continue to maintain control. However, traders should watch the nearby resistance zone for confirmation before chasing fresh long positions.
The immediate resistance lies at 24250. A decisive breakout and sustained move above this level can trigger fresh buying momentum towards 24350, 24400, and 24450+ levels. Until then, 24050–24100 remains a favorable buy-on-dips zone, with upside targets of 24150, 24200, and 24250.
On the downside, 24250–24200 acts as a reversal zone. If Nifty fails to sustain near this resistance and shows rejection, short positions can be considered for targets of 24150, 24100, and 24050. A further breakdown below 23950 would strengthen the bearish outlook and may drag the index towards 23850, 23800, and 23750 levels.
Overall, a gap-up opening is expected with a bullish bias, but the index is approaching an important resistance zone. Traders should prefer buying on dips above 24050–24100 or wait for a confirmed breakout above 24250 for fresh long positions. Rejection near 24250 may offer short-selling opportunities. Maintain strict stop-losses and book partial profits at each target due to expected intraday volatility. #BANKNIFTY Intraday PE & CE Levels(03/07/2026)Bank Nifty is expected to open with a gap-up bias around the 57980–58020 zone, indicating positive sentiment at the start of the session. However, the index is approaching a key resistance zone, so traders should wait for confirmation before initiating fresh long positions.
The immediate resistance lies at 58050–58100. A sustained move and close above this zone can trigger fresh buying momentum towards 58250, 58350, and 58450 levels. If Bank Nifty maintains strength above 58050, bullish momentum is likely to continue, with dips expected to attract buyers.
On the downside, 57950–57900 remains the immediate support zone. If the index fails to sustain above this level, fresh selling pressure may emerge, dragging Bank Nifty towards 57750, 57650, and 57550 levels. Traders should remain cautious if support is breached, as it could lead to profit booking after the gap-up opening.
Overall, a gap-up opening is expected, but the market is opening near an important resistance area. Traders should wait for a confirmed breakout above 58050 for fresh long positions, while rejection from this resistance or a breakdown below 57950 may provide short-selling opportunities. Maintain strict stop-losses and book partial profits at each target due to expected intraday volatility. NIFTY Daily Chart1. Trend
Short-term: Neutral to slightly bullish.
Long-term: The index is still trading below the 200-day SMA (24,871), so the primary trend remains weak.
NIFTY has recovered well from the March-April low but has not yet confirmed a strong uptrend.
2. Moving Averages
20-day SMA (Blue): 23,870
NIFTY is trading above this average.
This indicates short-term buying momentum.
The SMA has started flattening, which is the first sign of trend improvement.
200-day SMA (Orange): 24,871
Still acting as a major resistance.
Until NIFTY closes above this level, bulls don't have complete control.
3. Fibonacci Levels
The chart is using Fibonacci retracement from the recent high to low.
38.2% – 23,802
Strong support.
Buyers have defended this level multiple times.
50% – 24,267
Important resistance.
NIFTY is currently trading just below this level.
61.8% – 24,622
This is the strongest resistance.
A breakout above this level often signals trend reversal.
4. Volume
Selling volume was very high during the March decline.
During the recent recovery, volumes have been average.
A breakout above 24,267 or 24,622 should ideally come with higher-than-average volume for confirmation.
5. Price Structure
After the sharp fall, NIFTY has been making:
Higher lows ✔️
Sideways consolidation ✔️
This suggests accumulation before the next major move.
Bullish Scenario
If NIFTY closes above 24,267, the probability increases for a move toward:
24,620
Then 24,870
A sustained close above the 200-day SMA would indicate a stronger bullish trend.
Support 23750
Bias: Moderately Bullish (Short Term) | Neutral (Medium Term)
Key observations:
✅ Trading above the 20-day SMA.
✅ Higher-low structure is intact.
⚠️ Facing resistance at the 50% Fibonacci retracement (24,267).
⚠️ Still below the 200-day SMA, so the long-term trend has not yet turned bullish. Long 
 Long
Long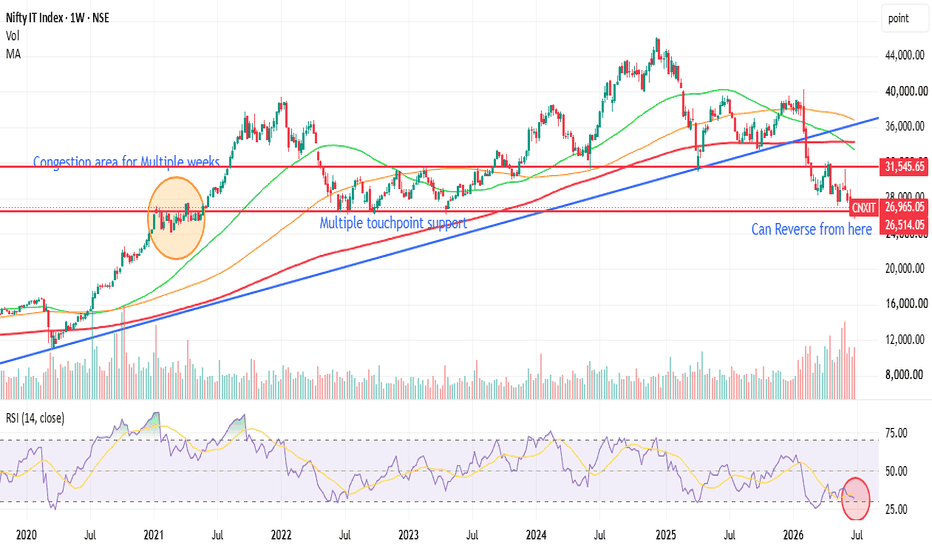
Long 
NIFTY Daily / Short Range Level Analysis for 03rd Jul 2026🔕 SGMN SplD BULLISH Above => 24234.
🔕 SGMN SplD Bearish BELOW => 24121.
Mentioned analysis based on 2 consecutive candle close in 15 min Time Frame .
━━━━━🟥🟧🟨🟩🟦🟪⬛━━━━━
💥Level Interpretation / description:
✍🏻L#1: If the candle crossed & stays above the “Buy Gen”, it is treated / considered as Bullish bias. Cfm=> Confirmation.
L#2: Possibility / Probability of REVERSAL near 🔕RL/TF1 & 🔔RL/TF2
L#3: If the candle stays above “Sell Gen” but below “Buy Gen”, it is treated / considered as Sidewise. Aggressive Traders can take Long position near “Sell Gen” either retesting or crossed from Below & vice-versa i.e. can take Short position near “Buy Gen” either retesting or crossed downward from Above.
L#4: If the candle crossed & stays below the “Sell Gen”, it is treated / considered a Bearish bias.
L#5: Possibility / Probability of REVERSAL near 🔕RL/TF1 & 🔔RL/TF2
HZB (Buy side) & HZS (Sell side) => Hurdle Zone,
✍🏻 *** Specialty of “HZB#1, HZB#2 HZS#1 & HZS#2” is Sidewise (behaviour in Nature)
Rest Plotted and Mentioned on Chart
Color code Used:
Green, BLUE =. Positive bias.
Safron, RED =. Negative bias.
RED in Between Green means Trend Finder / Momentum Change
/ CYCLE Change and Vice Versa.
Notice One thing: HOW LEVELS are Working.
Use any Momentum Indicator / Oscillator or as you "USED to" to Take entry.
━━━━━🟥🟧🟨🟩🟦🟪⬛━━━━━
⚠️ DISCLAIMER:
The information, views, and ideas shared here are purely for educational and informational purposes only. They are not intended as investment advice or a recommendation to buy, sell, or hold any financial instruments. I am not a SEBI-registered financial adviser.
Trading and investing in the stock market involves risk, and you should do your own research and analysis. You are solely responsible for any decisions made based on this research.
"🔔As HARD EARNED MONEY IS YOUR's, So DECISION SHOULD HAVE TO BE YOUR's".
━━━━━🟥🟧🟨🟩🟦🟪⬛━━━━━
❇️ Follow notification about periodical View
💥 Do Comment for Stock WEEKLY Level Analysis.🚀
📊 Do you agree with this view?
✈️ HIT THE PLANE ICON if this technical observation resonates with you. It will Motivate me.
━━━━━🟥🟧🟨🟩🟦🟪⬛━━━━━
💡 If You LOOKING any CHART & want for Level and ANALYZE?
Share your desired stock names in the comments below! I will try to analyze the chart Levels, patterns and share my technical view (so far my Knowledge).
If Viewers think It can identify meaningful setups. Looking forward to hearing from all of you — let's keep this discussion going and help each other make better trading decisions.
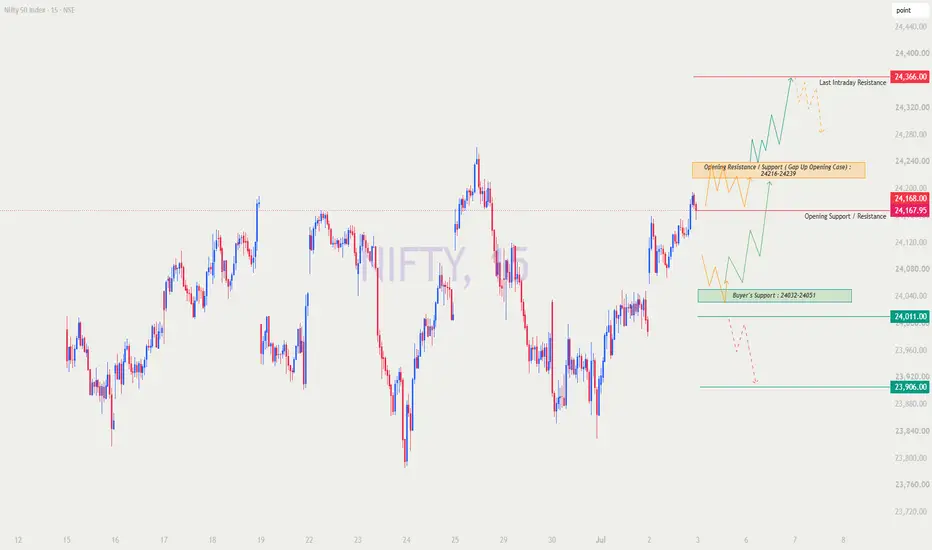
___________🔕^^^⚫⚪^🙏🏼🙏🏼🙏🏼^⚪⚫^^^🔔___________ Nifty : Master Trading Plan for 03-Jul-2026Levels, Price Action & Logic 🧠📊
Hello Traders! 👋 Welcome to today’s educational pre-market analysis.
Trading isn't about predicting the market; it's about reacting to it with a well-defined plan. Based on the 15-minute timeframe chart provided, we have plotted crucial supply and demand zones.
Before we dive into the scenarios, let's decode the "Color Language" of today's chart. Understanding this is vital for your trade execution:
🔸 Orange Lines (Zigzag): Sideways / No-Trade Zone. The market is trapping both buyers and sellers here. Sit on your hands!
🟢 Green Lines: High Probability Bullish / Long Setup. Look for buying opportunities when price follows these paths.
🔴 Red Lines / Dashed Lines: Bearish / Short Setup or Probable Trend. Dashed lines mean "Maybe or Maybe Not" – tread with caution and reduce position size.
Here is the detailed action plan for all three opening scenarios for 03-Jul-2026.
Scenario 1: Flat Opening (Between 24,150 - 24,180) ⚖️
Educational Logic: A flat opening means the overnight sentiment is neutral. The market will look to the first 30 minutes of price action to decide its intraday trend. The closing price of 24,167.95 acts as an immediate pivot.
🔹 If Price Sustains Above 24,168: Look at the solid green line on the chart. If the price forms higher highs on the 5-min chart above the closing line, we will initiate a Long position. Our first target will be the 24,216 - 24,239 zone.
🔹 The Trap Zone: If the price struggles to cross 24,168 and starts drifting lower, it will enter the orange zigzag zone. Do not trade here. The price will likely chop around aimlessly between 24,168 and 24,051. Save your capital and wait for a clear level test.
🔹 Actionable Plan: Go long above 24,180 with a strict stop loss below 24,140. Avoid trading if the market drifts downward slowly without momentum.
Scenario 2: Gap Up Opening (100+ Points | Opening near 24,267+) 🚀
Educational Logic: A massive 100+ point gap up implies aggressive overnight buying. However, markets rarely go straight up after a huge gap. Profit booking from BTST (Buy Today, Sell Tomorrow) traders is highly likely, which causes a morning dip.
🔹 The Retracement Trade: If we open near 24,270+, wait for the price to cool off and drop into the "Opening Resistance / Support Box" (24,216 - 24,239).
🔹 Watch the Orange Lines: Notice the orange zigzag in this box? This indicates extreme volatility and a tug-of-war between buyers and sellers. Do not enter immediately on the dip. Let the price consolidate in this box.
🔹 Actionable Plan: Wait for a solid bullish reversal pattern (like an engulfing candle or a hammer) at the bottom of the 24,216 zone. Once confirmed, go Long (following the upper green arrow) targeting the Last Intraday Resistance at 24,366.00.
🔹 Caution at Target: Notice the dashed orange line near 24,366? This means the trend may exhaust here. Book 80-100% of your profits at this level!
Scenario 3: Gap Down Opening (100+ Points | Opening near 24,067-) 🩸
Educational Logic: A gap down creates panic among retail buyers, but smart money often looks at gap downs into major support as a discount buying opportunity. Never short blindly into a gap down!
🔹 The Golden Buying Zone: A 100-point gap down brings us directly to the "Buyer's Support" green box (24,032 - 24,051). Look at the chart—there is a solid green line bouncing strongly from this exact zone!
🔹 Actionable Plan (Long): If the market opens near 24,050, wait for the first 5 or 15-minute candle to close. If it shows buying rejection (long lower wick), take a Long position with a stop loss just below the green box (24,011). Target the gap-filling area near 24,168. This offers the best Risk-to-Reward ratio of the day!
🔹 The Bearish Breakdown: What if the selling pressure is brutal? Look at the dashed red lines. If the price breaks and closes a 15-minute candle below 24,011.00 with high volumes, the support is broken. You can initiate a cautious Short trade targeting 23,906.00. (Why cautious? Because it's a dashed line—meaning the trend may or may not sustain. Keep position size at 50%).
🛡️ Pro-Tips for Options Trading & Risk Management 🛡️
Options trading is highly leveraged. Without risk management, even the best chart analysis will fail. Keep these rules printed on your desk:
🔸 Respect Theta (Time Decay): If the market enters the orange "No Trade / Sideways" zones, Option Buyers will lose money even if the market doesn't move against them. Theta will eat your premium. Cash is a position!
🔸 Strike Price Selection: Always trade In-The-Money (ITM) or At-The-Money (ATM) options. Avoid Out-Of-The-Money (OTM) lottery tickets—they have a very low probability of success.
🔸 Stop Loss on Spot, Not Premium: Place your stop loss based on the Nifty Spot chart levels (e.g., SL below 24,011), not on the option premium chart. Option premiums fluctuate wildly; spot charts show the true market structure.
🔸 Position Sizing on Dashed Lines: When trading the dashed lines (probable trends), strictly cut your standard lot size in half. Protect your capital during lower-probability setups.
🔸 Max Loss Per Day: Define your maximum daily loss limit before the market opens. If you hit it, close your terminal. Revenge trading is the fastest way to blow an account.
📝 Summary & Conclusion
The market structure currently shows a healthy battle between buyers at lower levels and sellers near the all-time high zones.
Ultimate Line in the Sand: The 24,032 - 24,051 zone is the Make-or-Break level for buyers. As long as we are above it, dips are meant to be bought.
Upside Hurdle: 24,366 is the key resistance. We need significant momentum to cross it.
Patience pays: The space between 24,051 and 24,168 is highly choppy. Wait for the market to come to your designated levels. Trade the plan, don't trade your emotions!
🚨 DISCLAIMER: I am NOT a SEBI Registered Analyst or Financial Advisor. This post is strictly for educational purposes and chart reading practice. Financial markets involve a high degree of risk. Please consult with your personal financial advisor and do your own research before executing any real-money trades. I am not responsible for any profits or losses incurred based on this analysis. 🚨 Long 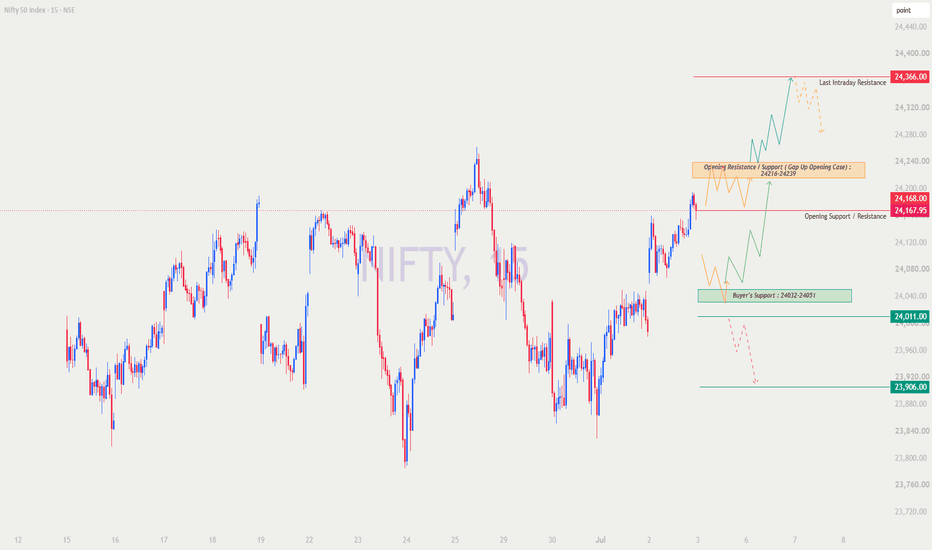
Nifty Swing Trading AnalysisCritical Pivot Level : 23,824 (±10 points) serves as the primary make-or-break level for the current trend.
Key Resistance & Upside Targets : 24,239 (±30 points) remains a highly critical level. While the index is likely to form a double top around this zone, a decisive close above it will invalidate the pattern and trigger a fresh bullish breakout.
Neutral Zone : A slide below 24,069 (±13 points) will shift the immediate market bias to neutral.
Bearish Outlook : If Nifty sustains below 23,789 (±18 points), the outlook turns bearish. This move could drag the index down toward 23,619 (±100 points). Below this zone, the final major line of defense and key support rests around 23,409 (±23 points).
**Disclaimer -
I am not a SEBI registered analyst or advisor. I does not represent or endorse the accuracy or reliability of any information, conversation, or content. Stock trading is inherently risky and the users agree to assume complete and full responsibility for the outcomes of all trading decisions that they make, including but not limited to loss of capital. None of these communications should be construed as an offer to buy or sell securities, nor advice to do so. The users understands and acknowledges that there is a very high risk involved in trading securities. By using this information, the user agrees that use of this information is entirely at their own risk.
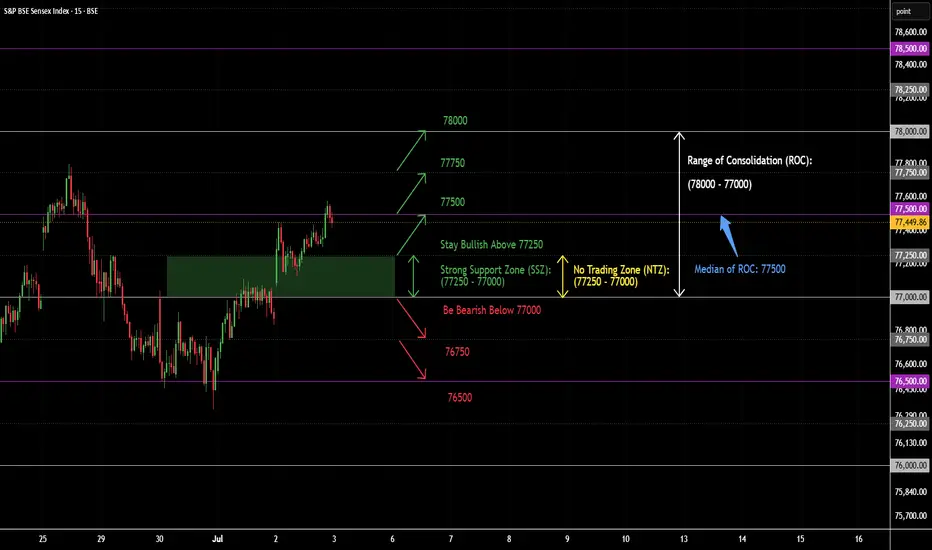
Thank you. SENSEX Analysis [For 03.06.2026: Friday]Probable Scenario Analysis of SENSEX for the 03rd of July, 2026. The day is Friday.
🟢 Bullish Scenario
Stay bullish above 77250. The price is in a bullish setup. Doubt every down move. The probable bullish targets above the level of 77500 would be - 77750 and 78000.
🔴 Bearish Scenario
There is no bearish setup. However, if the price decisively breaks down below the level of 77000, then the probable bearish targets would be - 76750 and 76500.
🟡 No Trading Zone (NTZ): (77250 - 77000).
Here, the zone of (77250 - 77000) is also a strong support.
⏺ Range of Consolidation (ROC): (78000 - 77000).
Here, 77500 is the median of ROC. The median works like a sentiment. The price trading above the median would offer bullish sentiment, while the price trading below the median would trigger bearish sentiment.
● Event
There is no high-impact event this week. However, there is the U.S. Independence Day Holiday on Friday (03rd of July).
● Intraday Bias
Establish intraday bias with respect to the opening price. If the price sustains above the opening price, then don't think of shorting. Look for bullish trades only. On the contrary, if the price sustains below the opening price, then don't think of going long. Look for bearish trades in that case.
● Disclaimer + End Note
- All the analyses would fail in the case of a major gap up, gap down, or price structure anomaly. Thus, practice PRAGMATISM in the live session.
- Trade only if there is a set-up. Remember, not trading is an extension of the trading activity.
- Mark your points. Trade your points. Price is GOD. Anything can happen in the markets. Thus, trade what you see, not what you believe.
- Always PRACTICE RISK MANAGEMENT. Always PROTECT YOUR CAPITAL. Be RESPONSIBLE.
- Be Strategic. Be Courageous. Be Patient. Be Wise.
- Every day is a new day. Thus, do not carry the baggage of past successes or failures. Leave the gardens of winning and losing. Establish yourself in equanimity. Always think from a new perspective.
- Let the joy of trading drive your effectiveness, not greed or fear. Believe in Possibilities.
Happy Trading! Nifty Bank Analysis [For 03.06.2026: Friday]Probable Scenario Analysis of Nifty Bank for the 03rd of July, 2026. The day is Friday.
🟢 Bullish Scenario
Firstly, the price needs to sustain above 58125. Then, a weak bullish move can be expected till 58250. Next, if the price sustains above the level of 58250 for at least 30 minutes with strong bullish candles, then we can expect a strong bullish move. The probable strong bullish targets above the level of 58250 are - 58500 and 58750.
🔴 Bearish Scenario
The level of 57750 is strong support. If the price decisively breaks down below the level of 57750, then the bullish sentiment will exhaust. A weak bearish move till 57500 is expected if the price sustains below 57750. The level of 57500 would offer strong support. Next, if the price decisively breaks down below the level of 57500, then there will be sharp selling. The probable bearish targets below the level of 57500 would be - 57250 and 57000.
🟡 No Trading Zone (NTZ): (58125 - 57750).
Here, the zone of (58000 - 57750) is strong support.
⏺ Range of Consolidation (ROC): (58500 - 57500).
Here, 58000 is the median of ROC. The median works like a sentiment. The price trading above the median would offer bullish sentiment, while the price trading below the median would trigger bearish sentiment.
● Event
There is no high-impact event this week. However, there is the U.S. Independence Day Holiday on Friday (03rd of July).
● Intraday Bias
Establish intraday bias with respect to the opening price. If the price sustains above the opening price, then don't think of shorting. Look for bullish trades only. On the contrary, if the price sustains below the opening price, then don't think of going long. Look for bearish trades in that case.
● Disclaimer + End Note
- All the analyses would fail in the case of a major gap up, gap down, or price structure anomaly. Thus, practice PRAGMATISM in the live session.
- Trade only if there is a set-up. Remember, not trading is an extension of the trading activity.
- Mark your points. Trade your points. Price is GOD. Anything can happen in the markets. Thus, trade what you see, not what you believe.
- Always PRACTICE RISK MANAGEMENT. Always PROTECT YOUR CAPITAL. Be RESPONSIBLE.
- Be Strategic. Be Courageous. Be Patient. Be Wise.
- Every day is a new day. Thus, do not carry the baggage of past successes or failures. Leave the gardens of winning and losing. Establish yourself in equanimity. Always think from a new perspective.
- Let the joy of trading drive your effectiveness, not greed or fear. Believe in Possibilities.
Happy Trading! Traders Secret= End-of-Day Trading: Plan Today, Execute Tomorrow# End-of-Day Trading Opportunities: Plan Calmly, Trade Smartly 📊
Most beginners make one common mistake:
They try to find trades **during live market noise**.
Price moves fast.
Candles change quickly.
Emotions take control.
And suddenly, a planned trader becomes a FOMO trader.
That is why **End-of-Day analysis** can be a powerful habit for beginners.
------------------------------------------
## What Is End-of-Day Trading? 🌙
End-of-Day trading means analyzing the chart **after the market closes**.
Instead of reacting to every candle during market hours, you wait for the full daily candle to close and then prepare a trade plan for the next day.
You study:
🎯Price action
🎯Support and resistance
🎯Daily candle closing
🎯Volume
🎯Trend direction
🎯Breakout or breakdown levels
🎯Risk-reward
The goal is simple:
**Do the analysis calmly today, execute only if confirmation comes tomorrow.**
------------------------------------------
## Why Closing Price Matters So Much 🔑
A stock can break resistance during the day, but if it closes below that level, the breakout may be weak.
A stock can fall below support during the day, but if it closes back above support, sellers may have failed.
That is why EOD traders ask one important question:
**Where did the price close?**
Not just:
**Where did the price move intraday?**
The closing price shows where the market finally accepted value.
------------------------------------------
## Best End-of-Day Setups for Beginners ✅
### 1. Breakout Setup 🚀
Price closes above an important resistance level with strong volume.
This shows buyers are active.
Beginner rule:
Do not buy just because price touched resistance.
Wait for a proper close above resistance.
Possible entry:
Above the breakout candle high
Or on retest of the breakout level
Stop loss:
Below the breakout candle low
Or below the broken resistance zone
------------------------------------------
### 2. Breakdown Setup 📉
Price closes below an important support level.
This shows sellers are in control.
Beginner rule:
Do not short only because price touched support.
Wait for a clear close below support.
Possible entry:
Below the breakdown candle low
Or on retest of broken support
Stop loss:
Above the breakdown candle high
Or above the failed support zone
------------------------------------------
### 3. Pullback Setup 🔁
Price is in an uptrend and comes back near support, trendline, or moving average.
This is better than chasing a big green candle.
Beginner rule:
In an uptrend, wait for price to come near support.
A good pullback usually shows:
Lower wick rejection
Support holding
Volume support
Trend still intact
------------------------------------------
### 4. Reversal Setup ⚡
Price rejects strongly from a major support or resistance zone.
Reversal trades can be powerful, but they need confirmation.
Bullish reversal signs:
Support zone holding
Lower wick rejection
Bullish candle close
Volume increase
Bearish reversal signs:
Resistance rejection
Upper wick formation
Bearish candle close
Volume increase
Beginner rule:
Do not predict reversal early.
Wait for confirmation.
------------------------------------------
## Simple EOD Trading Checklist 📝
Before selecting any stock or index, ask yourself:
📝Is the trend clear?
📝Is price near an important level?
📝Did the daily candle close strongly?
📝Is volume supporting the move?
📝Is there enough space till target?
📝Is risk-reward at least 1:2?
📝Is my stop loss based on structure?
📝Is the sector or index supporting the trade?
If most answers are yes, the setup becomes stronger.
If you are confused, skip the trade.
------------------------------------------
## How to Plan an EOD Trade 🎯
Use this simple structure:
🎯Setup type: Breakout / Breakdown / Pullback / Reversal
🎯Entry trigger: Above high / Below low / Retest confirmation
🎯Stop loss: Where the setup becomes invalid
🎯Target: Next resistance/support or minimum 1:2 risk-reward
🎯Rule: Do not chase gap-up or gap-down openings
Remember:
A trade without a plan is just a guess.
------------------------------------------
## Example Plan 📌
Stock is facing resistance at ₹500 for many days.
Today it closes at ₹512 with strong volume and a bullish daily candle.
Possible plan:
Buy above: ₹515
Stop loss: ₹492
Target 1: ₹540
Target 2: ₹560
Reason:
Price closed above resistance with volume. Buyers are showing strength. Trade is valid only if price sustains above the breakout zone.
Rule:
If stock opens with a big gap near target, do not chase. Wait for retest or fresh confirmation.
------------------------------------------
## Common Beginner Mistakes ❌
❌Buying only because candle is green
❌Ignoring support and resistance
❌Taking trades without volume confirmation
❌Entering after a big gap-up
❌Using random stop loss
❌Taking too many trades from one watchlist
❌Ignoring market direction
❌Forcing trades when chart is not clear
The best traders do not trade every setup.
They trade only the clean setups.
------------------------------------------
## Final Lesson 💡
End-of-Day trading is not about predicting tomorrow.
It is about preparing better than others.
When you analyze after market close, your mind is calm.
When your mind is calm, your plan is better.
When your plan is better, your execution improves.
Simple rule:
💡Analyze after market close.
💡Prepare before market open.
💡Enter only after confirmation.
💡Exit when your level says you are wrong.
Beginners should remember this:
**Do not chase candles. Plan levels. Wait for confirmation. Manage risk.**
That is how EOD trading can build discipline, patience, and consistency.
Education