BANKNIFTY 1H | Triangle Breakout → Channel Resistance → PullbackOverview
BANKNIFTY has been trading inside a clean Ascending Channel on the 1-hour timeframe since early June. Within this channel, a textbook Symmetrical Triangle formed, compressed price, and then delivered a sharp breakout — sending price all the way to the Upper Channel Resistance at 58,708.
Price is now pulling back. The key question is: where does the pullback find support?
What the Chart Is Showing
📐 Symmetrical Triangle — A consolidation pattern formed between June 15–24 inside the ascending channel. Price coiled tighter with each swing until a decisive breakout downward on June 24 at ~57,200 launched the next leg up.
🟡 Ascending Channel — The broader structure since June 9. Price has respected both the upper and lower boundaries consistently. The channel defines the playing field.
🔴 Channel Resistance at 58,708 — Price tagged the upper boundary of the channel precisely and reversed. This is not a random high — it is a structural rejection from a well-established level.
🔻 Pullback in Progress — After the resistance rejection, price is now declining. The natural pullback target is the mid-channel support zone at 57,657.
🟢 Breakout Level 54,851 — The origin of the entire move. This remains the key invalidation level for the overall bullish structure.
Key Levels
🔴 Resistance — 58,708 (Channel Upper Band)
🟡 Current Price — 58,187
🟢 Pullback Support — 57,657 (mid-channel)
🟢 Major Support — 54,851 (Breakout Level)
Three Scenarios
🟢 Scenario A — Pullback & Resume
Price pulls back to 57,657 mid-channel support, finds buyers, and bounces. Next attempt at 58,708 resistance. A breakout above 58,708 opens the path toward 59,200–59,600 (channel projection).
🔴 Scenario B — Channel Break
Price fails to hold 57,657 and breaks below the lower channel boundary. This changes the structure from bullish to neutral. Watch 54,851 as major support below.
⚪ Scenario C — Sideways Compression
Price consolidates between 57,657 and 58,708 — another triangle-like compression before the next directional move. Wait for breakout confirmation.
Beginner's Lesson — Why Patterns Inside Channels Matter
When a consolidation pattern like a triangle forms inside a larger trend channel, it acts as a pause — the market is gathering energy before continuing. The breakout from the triangle gives the direction. The channel boundaries give the targets.
This is why reading structure within structure is a powerful skill — the triangle told us direction, the channel told us the target.
Conclusion
BANKNIFTY has completed a clean 3-phase move — Triangle Breakout → Channel Resistance Hit → Pullback. The 57,657 zone is now the most important level to watch on the 1H timeframe.
Watch for a reaction at 57,657. That will tell the next story.
For educational purposes only. Not financial advice. Always manage your risk.  Education

Trading Masterclass #1Institutional trading means trading like hedge funds, banks, prop firms, and professional desks. They do not trade based on emotions, random tips, or gambling. They use systems, probabilities, risk control, position sizing, discipline, and psychology.
Retail traders often lose because they focus only on “entry.” Institutions focus on:
Risk Management
Capital Protection
Position Sizing
Probability
Psychology
Consistency
Repeatable Edge
In options trading, if you think like institutions, your results can improve significantly
 Education
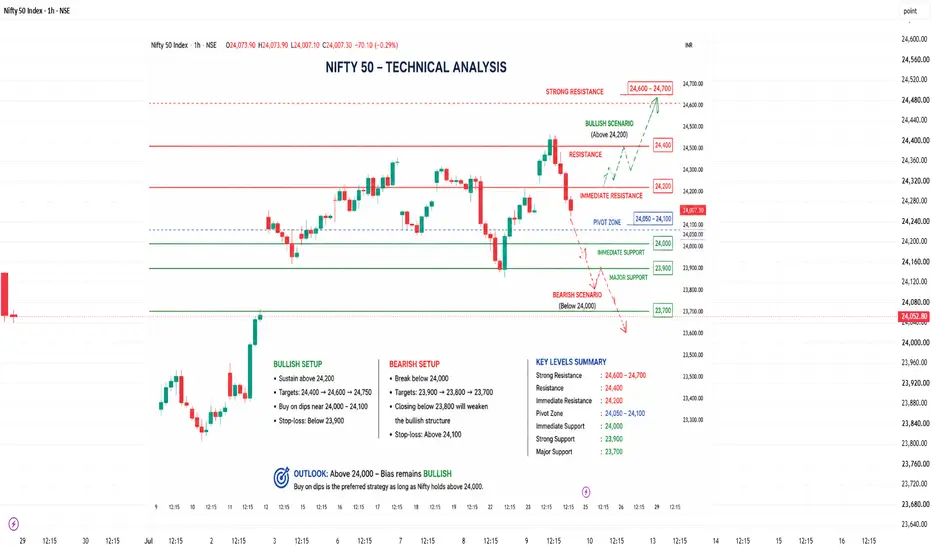
Nifty 50 Technical AnalysisTrend: Bullish above 24,000
Immediate Support:
24,050–24,000 (first demand zone)
23,900–23,850 (strong support)
23,700 (major swing support)
Resistance:
24,200 (immediate hurdle)
24,400 (breakout level)
24,600–24,700 (next upside target)
Trading Plan
Bullish Scenario
Sustain above 24,200 → Targets 24,400 → 24,600 → 24,750
Bearish Scenario
Break below 24,000 → Targets 23,900 → 23,800
Closing below 23,800 would weaken the current bullish structure.
Key Levels
Level Price
Strong Resistance 24,600–24,700
Resistance 24,400
Immediate Resistance 24,200
Current Pivot Zone 24,050–24,100
Immediate Support 24,000
Strong Support 23,900
Major Support 23,700  Education
NIFTY| Trendline Meets Resistance — Confluence Zone on WatchOverview
After a structured decline from the January highs, NIFTY is now approaching one of the most significant technical confluences visible on the Daily chart — a point where a descending resistance trendline meets a horizontal resistance cluster near the 24,265 Swing High.
This is not a routine resistance test. It is a multi-layered confluence, and the market's reaction here will likely set the tone for the weeks ahead.
What the Chart Is Showing
📉 Descending Resistance Trendline — A clean trendline connecting the highs from January, sloping downward and passing directly through the current price area. Each prior touch has resulted in a rejection.
🔴 Horizontal Resistance Cluster — The 24,265 Swing High and the 24,490–24,610 zone above it form a wall of supply that has consistently capped rallies since April.
🎯 The Confluence Zone — Right now, price is sitting at the exact point where the descending trendline intersects the Swing High resistance. This overlap makes the current zone exceptionally significant.
🔴 4th Test — This is the fourth time price has approached this resistance structure. Each prior test resulted in a rejection. The 4th test is typically the most decisive.
Key Levels
🔴 Resistance — 24,265 (Swing High), 24,490, 24,610
🎯 Confluence Zone — ~24,056 to 24,265 (trendline + horizontal overlap)
🟢 Support — 23,776 (Swing Low), 23,308, 23,067
Three Scenarios
🟢 Scenario A — Bullish Breakout
A daily close above 24,265 with volume conviction breaks both the horizontal resistance and the trendline simultaneously. This would be a significant structural shift — opening the path toward 24,490 and 24,610.
🔴 Scenario B — Bearish Rejection
Price gets rejected at the Confluence Zone and breaks below the Swing Low at 23,776. This confirms the downtrend structure remains intact. Next supports at 23,308 and 23,067 come into focus.
⚪ Scenario C — Compression & Breakout Later
Price grinds sideways between 23,776 and 24,265 — compressing under the trendline. This typically precedes a sharp directional move. Watch for a breakout in either direction with volume.
Why Confluence Matters
When two or more independent technical factors align at the same price level, the significance of that level multiplies. A trendline alone is one signal. A horizontal resistance alone is one signal. When they meet at the same point — that is confluence — and it demands attention regardless of your directional bias.
This is why the Confluence Zone on this chart deserves close monitoring on today's and next week's daily close.
Conclusion
NIFTY is at a technically critical juncture. The descending trendline and horizontal resistance have converged, creating a high-probability reaction zone. Whether the market breaks above or gets rejected will define the next major move.
Do not predict. Observe the close. React with confirmation.
For educational purposes only. Not financial advice. Always manage your risk. 26th Jun 2026 - Nifty Report — Just +42pts with Doji CandleNifty Stance: Flattish with Bullish Tone
Last report, we said Nifty is again consolidating with a slight bullish tone, and guess what, we only climbed 42pts (0.18%) this week. If you look at the 15-minute chart, you can see that Nifty has been in a tight range of 24192 and 23793 since 15th June. But the most important aspect is that it has defended the 24000 psychological level very authoritatively.
Nifty is really testing the patience of the trend traders because, since April 2026, we have only witnessed chopiness and range-bound moves. Periods of consolidation like these are times when a lot happens beneath the surface, but nothing is visible in the headline index. For example, many small- and midcap stocks have caught up; a few are above their 200 DMA, indicating a strong bullish comeback. Almost all the stock screeners are screaming buy recommendations on these lesser-known stocks.
This is exactly how the Nifty and Sensex move: they run ahead first, then wait for the smaller stocks to catch up. And then, Nifty and Sensex take the next leap. Although we cannot say with conviction when the next run will come, conditions are looking extremely favorable.
ADX is at 15.43 (less than 20), showing flattishness. The EMAs have crossed twice this week, confirming a weak directional trend.
Important Things to Watch for the Next Week
1. Data points to watch from a domestic perspective: Industrial Production, Manufacturing Output, Foreign Debt, Fiscal Deficit, GST Collections, and Forex Reserves.
2. Data points to watch from a global perspective: UK GDP, Eurozone CPI, US PMI, Crude oil Inventories, Unemployment Rate. The US market will be on holiday on the 3rd of July for Independence Day.
3. IPO Listing: Turtlemint Fintech Solutions on 29 June, Waterways Leisure Tourism on 30 Jun, Shreedhar Spinners, Advit Jewels & Jul Jivial Industries on 01 Jul.
4. If Nifty moves up, the resistance levels are 24192, 24335, and 24425. If Nifty falls, the support levels are 23925, 23793, and 23357. This is the same as last week, since we did not break any SRs.
DISCLAIMER
Investments in the securities market are subject to market risks, including the potential loss of principal. Past performance does not guarantee future results. Information provided is for educational purposes only and should not be considered financial advice. Investors should read all related documents carefully and consult a certified advisor before investing. Registration granted by SEBI and Enlistment with RAASB/BSE and certification from NISM in no way guarantee performance of the intermediary or provide any assurance of returns to investors. The investor is requested to take into consideration all the risk factors before actually trading in stocks or derivatives. The SEBI RIA license INA000021757 & RA license INH000025045 are for Balachandran RV
Education

BANKNIFTY WEEKLY/ Pos[nal Level Analysis: 29th Jun-03rd Jul 2026BANKNIFTY WEEKLY/ Positional Level Analysis: 29th Jun-03rd Jul 2026
🔔 SGMN SplW Above BULLISH BIAS => 59021.
🔔 SGMN SplW BELOW Bearish BIAS => 57005.
Mentioned analysis based on 2 consecutive candle close in 15 min Time Frame.
━━━━━🟥🟧🟨🟩🟦🟪⬛━━━━━
💥Level Interpretation / description:
✍🏻L#1: If the candle crossed & stays above the “Buy Gen”, it is treated / considered as Bullish bias. Cfm=> Confirmation.
L#2: Possibility / Probability of REVERSAL near 🔕RL/TF1 & 🔔RL/TF2
L#3: If the candle stays above “Sell Gen” but below “Buy Gen”, it is treated / considered as Sidewise. Aggressive Traders can take Long position near “Sell Gen” either retesting or crossed from Below & vice-versa i.e. can take Short position near “Buy Gen” either retesting or crossed downward from Above.
L#4: If the candle crossed & stays below the “Sell Gen”, it is treated / considered a Bearish bias.
L#5: Possibility / Probability of REVERSAL near 🔕RL/TF1 & 🔔RL/TF2
HZB (Buy side) & HZS (Sell side) => Hurdle Zone,
✍🏻 *** Specialty of “HZB#1, HZB#2 HZS#1 & HZS#2” is Sidewise (behaviour in Nature)
Rest Plotted and Mentioned on Chart
Color code Used:
Green, BLUE =. Positive bias.
Safron, RED =. Negative bias.
RED in Between Green means Trend Finder / Momentum Change
/ CYCLE Change and Vice Versa.
Notice One thing: HOW LEVELS are Working.
Use any Momentum Indicator / Oscillator or as you "USED to" to Take entry.
━━━━━🟥🟧🟨🟩🟦🟪⬛━━━━━
⚠️ DISCLAIMER:
The information, views, and ideas shared here are purely for educational and informational purposes only. They are not intended as investment advice or a recommendation to buy, sell, or hold any financial instruments. I am not a SEBI-registered financial adviser.
Trading and investing in the stock market involves risk, and you should do your own research and analysis. You are solely responsible for any decisions made based on this research.
"🔔As HARD EARNED MONEY IS YOUR's, So DECISION SHOULD HAVE TO BE YOUR's".
━━━━━🟥🟧🟨🟩🟦🟪⬛━━━━━
❇️ Follow notification about periodical View
💥 Do Comment for Stock WEEKLY Level Analysis.🚀
📊 Do you agree with this view?
✈️ HIT THE PLANE ICON if this technical observation resonates with you. It will Motivate me.
━━━━━🟥🟧🟨🟩🟦🟪⬛━━━━━
💡 If You LOOKING any CHART & want for Level and ANALYZE?
Share your desired stock names in the comments below! I will try to analyze the chart Levels, patterns and share my technical view (so far my Knowledge).
If Viewers think It can identify meaningful setups. Looking forward to hearing from all of you — let's keep this discussion going and help each other make better trading decisions.
___________🔕^^^⚫⚪^🙏🏼🙏🏼🙏🏼^⚪⚫^^^🔔___________ NIFTY: Equilibrium Zone 4th Test — Decision Point ApproachingOverview
After the sharp decline from the January highs, NIFTY has entered a well-defined Balance / Consolidation Zone on the Daily timeframe. This zone, bounded between approximately 24,110 (Lower Band) and 24,770 (Upper Band), has acted as a strong structural reference for price action over the past several weeks.
What makes the current setup particularly important is that price has now approached the Lower Band for the fourth time — and each previous test has resulted in a rejection.
What the Chart Is Showing
🔴 Rejection 1 & 2 — Price attempted to re-enter the zone in late April and early May, but was sold into each time at the Upper Band (24,490–24,610 area).
🔴 Rejection 3 & 4 — After finding a Swing Low at 23,776, price recovered and again tested the Lower Band of the zone (24,110 area). The current candle is sitting right at this level.
This is the most critical test so far — because the more frequently a level is tested, the more decisive the next reaction tends to be.
Key Levels to Watch
🔴 Resistance — 24,265 (Swing High), 24,490, 24,610
🟡 Zone — 24,110 to 24,770 (Balance / Consolidation Zone)
🟢 Support — 23,776 (Swing Low), 23,308, 23,067
Three Scenarios
🟢 Scenario A — Bullish Reclaim
If price closes decisively inside the zone above 24,110 and then breaks above the Swing High at 24,265, it signals buyers are regaining control. This opens a path toward 24,490 and eventually the Upper Band at 24,770.
🔴 Scenario B — Bearish Rejection
If price is rejected at the Lower Band again and breaks below the Swing Low at 23,776, sellers are back in control. Next support areas are 23,308 and 23,067.
⚪ Scenario C — Chop Inside Zone
Price may enter the zone but stall between 24,110 and 24,265 — a range-bound phase. In this case, wait for a clear breakout above 24,265 or breakdown below 23,776 before acting.
Beginner's Lesson
The concept of a Balance Zone is simple — it is a price range where buyers and sellers are in equilibrium. Neither side has clear control. When price approaches the boundary of this zone, it faces a binary decision: reclaim it, or get rejected.
The key lesson here is: do not predict — observe and react.
Wait for the market to show its hand with a confirmed close, then position accordingly. Chasing before confirmation is where most traders lose money.
Conclusion
NIFTY is at a structurally significant level today. The 4th test of the Equilibrium Zone Lower Band is unfolding in real time. Whether it becomes a launchpad or a rejection point will likely define the direction for the coming weeks.
Watch the daily close carefully.
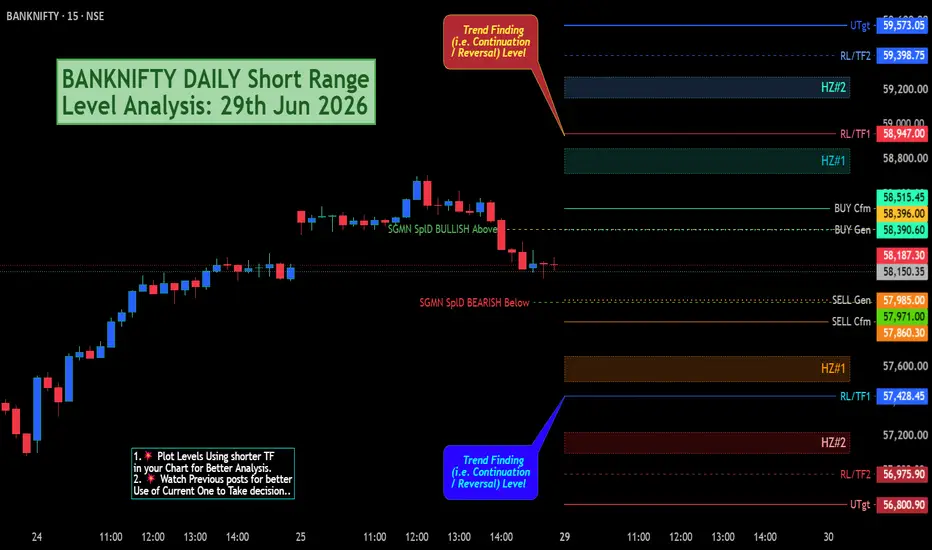
This analysis is for educational purposes only. Not financial advice. Always manage your risk. BANKNIFTY DAILY Short Range Level Analysis: 29th Jun 2026🔕 SGMN SplD BULLISH Above => 58396.
🔕 SGMN SplD Bearish BELOW => 57971.
Mentioned analysis based on 2 consecutive candle close in 15 min Time Frame.
━━━━━🟥🟧🟨🟩🟦🟪⬛━━━━━
💥Level Interpretation / description:
✍🏻L#1: If the candle crossed & stays above the “Buy Gen”, it is treated / considered as Bullish bias. Cfm=> Confirmation.
L#2: Possibility / Probability of REVERSAL near 🔕RL/TF1 & 🔔RL/TF2
L#3: If the candle stays above “Sell Gen” but below “Buy Gen”, it is treated / considered as Sidewise. Aggressive Traders can take Long position near “Sell Gen” either retesting or crossed from Below & vice-versa i.e. can take Short position near “Buy Gen” either retesting or crossed downward from Above.
L#4: If the candle crossed & stays below the “Sell Gen”, it is treated / considered a Bearish bias.
L#5: Possibility / Probability of REVERSAL near 🔕RL/TF1 & 🔔RL/TF2
HZB (Buy side) & HZS (Sell side) => Hurdle Zone,
✍🏻 *** Specialty of “HZB#1, HZB#2 HZS#1 & HZS#2” is Sidewise (behaviour in Nature)
Rest Plotted and Mentioned on Chart
Color code Used:
Green, BLUE =. Positive bias.
Safron, RED =. Negative bias.
RED in Between Green means Trend Finder / Momentum Change
/ CYCLE Change and Vice Versa.
Notice One thing: HOW LEVELS are Working.
Use any Momentum Indicator / Oscillator or as you "USED to" to Take entry.
━━━━━🟥🟧🟨🟩🟦🟪⬛━━━━━
⚠️ DISCLAIMER:
The information, views, and ideas shared here are purely for educational and informational purposes only. They are not intended as investment advice or a recommendation to buy, sell, or hold any financial instruments. I am not a SEBI-registered financial adviser.
Trading and investing in the stock market involves risk, and you should do your own research and analysis. You are solely responsible for any decisions made based on this research.
"🔔As HARD EARNED MONEY IS YOUR's, So DECISION SHOULD HAVE TO BE YOUR's".
━━━━━🟥🟧🟨🟩🟦🟪⬛━━━━━
❇️ Follow notification about periodical View
💥 Do Comment for Stock WEEKLY Level Analysis.🚀
📊 Do you agree with this view?
✈️ HIT THE PLANE ICON if this technical observation resonates with you. It will Motivate me.
━━━━━🟥🟧🟨🟩🟦🟪⬛━━━━━
💡 If You LOOKING any CHART & want for Level and ANALYZE?
Share your desired stock names in the comments below! I will try to analyze the chart Levels, patterns and share my technical view (so far my Knowledge).
If Viewers think It can identify meaningful setups. Looking forward to hearing from all of you — let's keep this discussion going and help each other make better trading decisions.
___________🔕^^^⚫⚪^🙏🏼🙏🏼🙏🏼^⚪⚫^^^🔔___________ Nifty Bank Analysis [For 29.06.2026: Monday]Probable Scenario Analysis of Nifty Bank for the 29th of June, 2026. The day is Monday.
🟢 Bullish Scenario
There is no observable bullish setup. The bulls are trapped just above the level of 58500. We have to wait for the price to offer a bullish setup, as in the present scenario, bulls are bleeding, and the bears are in power. However, if the price sustains above the level of 58500 for at least 30 minutes, then we can expect a weak bullish move till the level of 58750. Next, if the price starts to trade above 58750, then there will be a weak bullish move till the level of 59000. The price will experience strong resistance at the level of 59000. Lastly, if the price sustains above the level of 59000, then the probable strong bullish targets would be - 59250 and 59500..
🔴 Bearish Scenario
Level 58000 is a strong support. If the price decisively starts to trade below the level of 58000, then we can expect a weak bearish move till the level of 57750. Next, if the price sustains at least 15 minutes below the level of 57750, then there will be a strong sell-off until the level of 57500. The price will receive good support at the level of 57500. Lastly, if the price again breaks down below the level of 57500, then there will be sharp selling in the market. The probable bearish targets below the level of 57500 would be - 57250, 57000, and 56750.
🟡 No Trading Zone (NTZ): (58500 - 58000).
Presently, the price is in the NTZ. Only a breakout or breakdown would confirm the trend.
⏺ Range of Consolidation (ROC): (58500 - 57500).
For the past two weeks, the price has been extremely volatile in a range. Here, the level of 75000 is the median of the ROC. The median works like a sentiment. The price trading above the median would offer bullish sentiment, while the price trading below the median would trigger bearish sentiment.
● Event
There is no high-impact event in the upcoming week. However, there is the U.S. Independence Day Holiday on Friday (03rd of July). On Tuesday (30th of June), there will be Nifty 50 expiry. Therefore, we can expect a price anomaly till Tuesday.
● Intraday Bias
Establish intraday bias with respect to the opening price. If the price sustains above the opening price, then don't think of shorting. Look for bullish trades only. On the contrary, if the price sustains below the opening price, then don't think of going long. Look for bearish trades in that case.
● Top-Down Analysis
- Monthly TF: A green bullish candle with no sign of weakness. Minor resistance is 58500, and major resistance is 59000. Major support is 57500. The view is bullish.
- Weekly TF: Back-2-back two weeks are long-legged doji. But both the candles are green. Also, there is a higher-highs and lower-lows structure. The view is indecision to bullish.
- Daily TF: A red shooting star candle is formed. Maybe it is a sign of trend reversal. The level of 58500 is a major resistance. The level of 57500 is a major support. There is a higher-highs and lower-lows structure. The view is indecision to bullish.
- 30-minute TF: The higher-highs and lower-lows structure is intact. There is no trend clarity. The view is indecision to bullish.
● Disclaimer + End Note
- All the analyses would fail in the case of a major gap up, gap down, or price structure anomaly. Thus, practice PRAGMATISM in the live session.
- Trade only if there is a set-up. Remember, not trading is an extension of the trading activity.
- Mark your points. Trade your points. Price is GOD. Anything can happen in the markets. Thus, trade what you see, not what you believe.
- Always PRACTICE RISK MANAGEMENT. Always PROTECT YOUR CAPITAL. Be RESPONSIBLE.
- Be Strategic. Be Courageous. Be Patient. Be Wise.
- Every day is a new day. Thus, do not carry the baggage of past successes or failures. Leave the gardens of winning and losing. Establish yourself in equanimity. Always think from a new perspective.
- Let the joy of trading drive your effectiveness, not greed or fear. Believe in Possibilities.
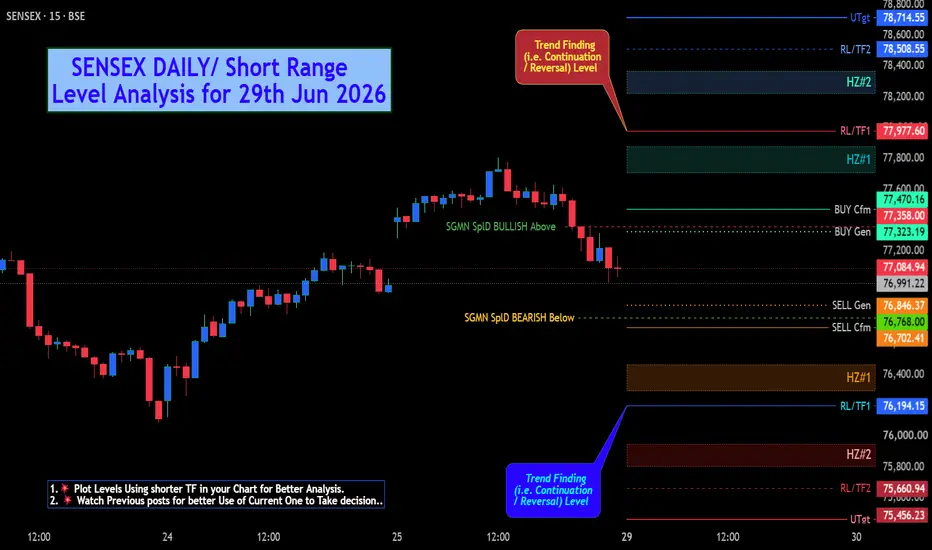
Happy Trading! SENSEX DAILY/ Short Range Level Analysis for 29th Jun 2026🔕 SGMN SplD BULLISH Above => 77358.
🔕 SGMN SplD Bearish BELOW => 76768.
Mentioned analysis based on 2 consecutive candle close in 15 min Time Frame.
━━━━━🟥🟧🟨🟩🟦🟪⬛━━━━━
💥Level Interpretation / description:
✍🏻L#1: If the candle crossed & stays above the “Buy Gen”, it is treated / considered as Bullish bias. Cfm=> Confirmation.
L#2: Possibility / Probability of REVERSAL near 🔕RL/TF1 & 🔔RL/TF2
L#3: If the candle stays above “Sell Gen” but below “Buy Gen”, it is treated / considered as Sidewise. Aggressive Traders can take Long position near “Sell Gen” either retesting or crossed from Below & vice-versa i.e. can take Short position near “Buy Gen” either retesting or crossed downward from Above.
L#4: If the candle crossed & stays below the “Sell Gen”, it is treated / considered a Bearish bias.
L#5: Possibility / Probability of REVERSAL near 🔕RL/TF1 & 🔔RL/TF2
HZB (Buy side) & HZS (Sell side) => Hurdle Zone,
✍🏻 *** Specialty of “HZB#1, HZB#2 HZS#1 & HZS#2” is Sidewise (behaviour in Nature)
Rest Plotted and Mentioned on Chart
Color code Used:
Green, BLUE =. Positive bias.
Safron, RED =. Negative bias.
RED in Between Green means Trend Finder / Momentum Change
/ CYCLE Change and Vice Versa.
Notice One thing: HOW LEVELS are Working.
Use any Momentum Indicator / Oscillator or as you "USED to" to Take entry.
━━━━━🟥🟧🟨🟩🟦🟪⬛━━━━━
⚠️ DISCLAIMER:
The information, views, and ideas shared here are purely for educational and informational purposes only. They are not intended as investment advice or a recommendation to buy, sell, or hold any financial instruments. I am not a SEBI-registered financial adviser.
Trading and investing in the stock market involves risk, and you should do your own research and analysis. You are solely responsible for any decisions made based on this research.
"🔔As HARD EARNED MONEY IS YOUR's, So DECISION SHOULD HAVE TO BE YOUR's".
━━━━━🟥🟧🟨🟩🟦🟪⬛━━━━━
❇️ Follow notification about periodical View
💥 Do Comment for Stock WEEKLY Level Analysis.🚀
📊 Do you agree with this view?
✈️ HIT THE PLANE ICON if this technical observation resonates with you. It will Motivate me.
━━━━━🟥🟧🟨🟩🟦🟪⬛━━━━━
💡 If You LOOKING any CHART & want for Level and ANALYZE?
Share your desired stock names in the comments below! I will try to analyze the chart Levels, patterns and share my technical view (so far my Knowledge).
If Viewers think It can identify meaningful setups. Looking forward to hearing from all of you — let's keep this discussion going and help each other make better trading decisions.
___________🔕^^^⚫⚪^🙏🏼🙏🏼🙏🏼^⚪⚫^^^🔔___________ Bull Trap at 77500Probable Scenario Analysis of SENSEX for the 29th of June, 2026. The day is Monday.
🟢 Bullish Scenario
There is no observable bullish setup. It is evident that the bulls are trapped just above the level of 77500. We have to wait for the price to offer a bullish setup, as in the present scenario, bulls are bleeding, and the bears are in power. However, if the price sustains above the level of 77500 for at least 30 minutes, then we can expect a weak bullish move till the level of 77750. Next, if the price starts to trade above 77750, then there will be a weak bullish move till the level of 78000. The price will experience strong resistance at the level of 78000. Lastly, if the price sustains above the level of 78000, then the probable strong bullish targets would be - 78250 and 78500.
🔴 Bearish Scenario
Level 77000 is a strong support. If the price decisively starts to trade below the level of 77000, then we can expect a weak bearish move till the level of 76750. Next, if the price sustains at least 15 minutes below the level of 76750, then there will be a strong sell-off until the level of 76500. The price will receive good support at the level of 76500. Lastly, if the price again breaks down below the level of 76500, then there will be sharp selling in the market. The probable bearish targets below the level of 76500 would be - 76250 and 76000.
🟡 No Trading Zone (NTZ): (77500 - 77000).
Presently, the price is in the NTZ. Only a breakout or breakdown would confirm the trend.
⏺ Range of Consolidation (ROC): (78000 - 76000).
For the past two weeks, the price has been extremely volatile in a 2000-point range. Here, the level of 77000 is the median of the ROC. The median works like a sentiment. The price trading above the median would offer bullish sentiment, while the price trading below the median would trigger bearish sentiment.
● Event
There is no high-impact event in the upcoming week. However, there is the U.S. Independence Day Holiday on Friday (03rd of July). On Tuesday (30th of June), there will be Nifty 50 expiry. Therefore, we can expect a price anomaly till Tuesday.
● Intraday Bias
Establish intraday bias with respect to the opening price. If the price sustains above the opening price, then don't think of shorting. Look for bullish trades only. On the contrary, if the price sustains below the opening price, then don't think of going long. Look for bearish trades in that case.
● Top-Down Analysis:
- Monthly TF: The price has been sideways for the last four months. The level of 78000 is a major resistance. The level of 76500 is a major support. The view is indecision.
- Weekly TF: Back-2-back two weeks are long-legged doji. The view is indecision.
- Daily TF: A red shooting star candle is formed. Maybe it is a sign of trend reversal. The level of 77500 is a major resistance. The level of 76500 is a major support. The view is indecision.
- 30-minute TF: The higher-highs and lower-lows structure is intact. However, the price is badly consolidating in a sinusoidal pattern in the range of (78000 - 76000). There is no trend clarity. The view is indecision.
● Disclaimer + End Note
- All the analyses would fail in the case of a major gap up, gap down, or price structure anomaly. Thus, practice PRAGMATISM in the live session.
- Trade only if there is a set-up. Remember, not trading is an extension of the trading activity.
- Mark your points. Trade your points. Price is GOD. Anything can happen in the markets. Thus, trade what you see, not what you believe.
- Always PRACTICE RISK MANAGEMENT. Always PROTECT YOUR CAPITAL. Be RESPONSIBLE.
- Be Strategic. Be Courageous. Be Patient. Be Wise.
- Every day is a new day. Thus, do not carry the baggage of past successes or failures. Leave the gardens of winning and losing. Establish yourself in equanimity. Always think from a new perspective.
- Let the joy of trading drive your effectiveness, not greed or fear. Believe in Possibilities.
Happy Trading! SENSEX WEEKLY/ Positional Level Analysis: 29th Jun-03rd Apr '26🔔 SGMN SplWP BULLISH Above => 77833
🔔 SGMN SplP BEARISH Below => 76217.
Mentioned analysis based on 2 consecutive candle close in 15 min Time Frame.
━━━━━🟥🟧🟨🟩🟦🟪⬛━━━━━
💥Level Interpretation / description:
✍🏻L#1: If the candle crossed & stays above the “Buy Gen”, it is treated / considered as Bullish bias. Cfm=> Confirmation.
L#2: Possibility / Probability of REVERSAL near 🔕RL/TF1 & 🔔RL/TF2
L#3: If the candle stays above “Sell Gen” but below “Buy Gen”, it is treated / considered as Sidewise. Aggressive Traders can take Long position near “Sell Gen” either retesting or crossed from Below & vice-versa i.e. can take Short position near “Buy Gen” either retesting or crossed downward from Above.
L#4: If the candle crossed & stays below the “Sell Gen”, it is treated / considered a Bearish bias.
L#5: Possibility / Probability of REVERSAL near 🔕RL/TF1 & 🔔RL/TF2
HZB (Buy side) & HZS (Sell side) => Hurdle Zone,
✍🏻 *** Specialty of “HZB#1, HZB#2 HZS#1 & HZS#2” is Sidewise (behaviour in Nature)
Rest Plotted and Mentioned on Chart
Color code Used:
Green, BLUE =. Positive bias.
Safron, RED =. Negative bias.
RED in Between Green means Trend Finder / Momentum Change
/ CYCLE Change and Vice Versa.
Notice One thing: HOW LEVELS are Working.
Use any Momentum Indicator / Oscillator or as you "USED to" to Take entry.
━━━━━🟥🟧🟨🟩🟦🟪⬛━━━━━
⚠️ DISCLAIMER:
The information, views, and ideas shared here are purely for educational and informational purposes only. They are not intended as investment advice or a recommendation to buy, sell, or hold any financial instruments. I am not a SEBI-registered financial adviser.
Trading and investing in the stock market involves risk, and you should do your own research and analysis. You are solely responsible for any decisions made based on this research.
"🔔As HARD EARNED MONEY IS YOUR's, So DECISION SHOULD HAVE TO BE YOUR's".
━━━━━🟥🟧🟨🟩🟦🟪⬛━━━━━
❇️ Follow notification about periodical View
💥 Do Comment for Stock WEEKLY Level Analysis.🚀
📊 Do you agree with this view?
✈️ HIT THE PLANE ICON if this technical observation resonates with you. It will Motivate me.
━━━━━🟥🟧🟨🟩🟦🟪⬛━━━━━
💡 If You LOOKING any CHART & want for Level and ANALYZE?
Share your desired stock names in the comments below! I will try to analyze the chart Levels, patterns and share my technical view (so far my Knowledge).
If Viewers think It can identify meaningful setups. Looking forward to hearing from all of you — let's keep this discussion going and help each other make better trading decisions.
___________🔕^^^⚫⚪^🙏🏼🙏🏼🙏🏼^⚪⚫^^^🔔___________
The Core Logic of Pullback Trading !Stop Chasing Candles — Wait for the Pullback 📉📈
Most beginners enter trades at the worst possible place.
They see a strong green candle.
They feel FOMO.
They hit BUY near the top.
Then price pulls back.
Now the same trader panics, exits early, and watches the market move again without them.
This is one of the most common beginner mistakes.
━━━━━━━━━━━━━━━━━━━━
🧠 What Professionals Do Differently
Professionals do not chase price.
They wait for price to come back to a logical level.
That level can be:
✅ Support zone
✅ Previous breakout level
✅ Trendline
✅ Moving average
✅ Demand zone
✅ Fibonacci retracement area
This temporary correction inside a trend is called a pullback.
A pullback is not always weakness.
Many times, it is simply the market taking a pause before continuing the main trend.
━━━━━━━━━━━━━━━━━━━━
📌 Simple Pullback Framework
1️⃣ Identify the Trend
In an uptrend, price should make:
Higher Highs + Higher Lows
In a downtrend, price should make:
Lower Highs + Lower Lows
⚠️ Without a clear trend, pullback trading becomes risky.
━━━━━━━━━━━━━━━━━━━━
2️⃣ Wait for Price to Return
Do not enter after a big impulsive candle.
Wait for price to come back near a logical area.
A good pullback usually comes near:
✅ Support in an uptrend
✅ Resistance in a downtrend
✅ 20 EMA / 50 EMA
✅ Breakout retest zone
✅ Trendline support or resistance
💡 Good traders do not run behind price.
They wait for price to come to their level.
━━━━━━━━━━━━━━━━━━━━
3️⃣ Look for Confirmation
Never buy just because price has fallen.
Wait for confirmation.
Examples:
✅ Rejection wick
✅ Bullish engulfing candle
✅ Bearish engulfing candle
✅ Break of minor structure
✅ Volume support
✅ Price holding the zone
⚠️ Confirmation helps you avoid catching a falling knife.
━━━━━━━━━━━━━━━━━━━━
4️⃣ Plan Entry, Stop-Loss and Target
For a bullish pullback:
🟢 Entry: After confirmation
🔴 Stop-loss: Below pullback low
🎯 Target: Previous swing high or next resistance
For a bearish pullback:
🔴 Entry: After confirmation
🟢 Stop-loss: Above pullback high
🎯 Target: Previous swing low or next support
This gives a cleaner trade setup with better risk-to-reward.
━━━━━━━━━━━━━━━━━━━━
📊 Why Pullback Trading Works Better for Beginners
Pullback trading helps you avoid emotional entries.
Instead of buying after price has already moved, you wait for value.
This can give you:
✅ Better entry
✅ Smaller stop-loss
✅ Cleaner risk-to-reward
✅ Less emotional pressure
✅ More disciplined execution
The goal is not to catch every move.
The goal is to enter only when price comes to your planned zone.
━━━━━━━━━━━━━━━━━━━━
⚠️ Important Warning
Not every dip is a pullback.
Sometimes a dip is the beginning of a reversal.
If price breaks the previous higher low in an uptrend, the structure may be changing.
If price breaks the previous lower high in a downtrend, the trend may be weakening.
Always check structure before entering.
━━━━━━━━━━━━━━━━━━━━
🧘 And Finally !
Beginners chase candles.
Professionals wait for levels.
The market will always create new opportunities.
You do not need to enter every fast-moving candle.
Wait for the trend.
Wait for the pullback.
Wait for confirmation.
Then execute with a plan. Education 
NIFTY DAILYY / Short Range Level Analysis for: 29th Jun 2026🔔 SGMN SplWP Above BULLISH BIAS => 24226
🔕 SGMN SplD BULLISH Above => 24131.
🔕 SGMN SplD Bearish BELOW => 23983.
🔔 SGMN SplWP BELOW Bearish BIAS => 23871.
Mentioned analysis based on 2 consecutive candle close in 15 min Time Frame.
━━━━━🟥🟧🟨🟩🟦🟪⬛━━━━━
💥Level Interpretation / description:
✍🏻L#1: If the candle crossed & stays above the “Buy Gen”, it is treated / considered as Bullish bias. Cfm=> Confirmation.
L#2: Possibility / Probability of REVERSAL near 🔕RL/TF1 & 🔔RL/TF2
L#3: If the candle stays above “Sell Gen” but below “Buy Gen”, it is treated / considered as Sidewise. Aggressive Traders can take Long position near “Sell Gen” either retesting or crossed from Below & vice-versa i.e. can take Short position near “Buy Gen” either retesting or crossed downward from Above.
L#4: If the candle crossed & stays below the “Sell Gen”, it is treated / considered a Bearish bias.
L#5: Possibility / Probability of REVERSAL near 🔕RL/TF1 & 🔔RL/TF2
HZB (Buy side) & HZS (Sell side) => Hurdle Zone,
✍🏻 *** Specialty of “HZB#1, HZB#2 HZS#1 & HZS#2” is Sidewise (behaviour in Nature)
Rest Plotted and Mentioned on Chart
Color code Used:
Green, BLUE =. Positive bias.
Safron, RED =. Negative bias.
RED in Between Green means Trend Finder / Momentum Change
/ CYCLE Change and Vice Versa.
Notice One thing: HOW LEVELS are Working.
Use any Momentum Indicator / Oscillator or as you "USED to" to Take entry.
━━━━━🟥🟧🟨🟩🟦🟪⬛━━━━━
⚠️ DISCLAIMER:
The information, views, and ideas shared here are purely for educational and informational purposes only. They are not intended as investment advice or a recommendation to buy, sell, or hold any financial instruments. I am not a SEBI-registered financial adviser.
Trading and investing in the stock market involves risk, and you should do your own research and analysis. You are solely responsible for any decisions made based on this research.
"🔔As HARD EARNED MONEY IS YOUR's, So DECISION SHOULD HAVE TO BE YOUR's".
━━━━━🟥🟧🟨🟩🟦🟪⬛━━━━━
❇️ Follow notification about periodical View
💥 Do Comment for Stock WEEKLY Level Analysis.🚀
📊 Do you agree with this view?
✈️ HIT THE PLANE ICON if this technical observation resonates with you. It will Motivate me.
━━━━━🟥🟧🟨🟩🟦🟪⬛━━━━━
💡 If You LOOKING any CHART & want for Level and ANALYZE?
Share your desired stock names in the comments below! I will try to analyze the chart Levels, patterns and share my technical view (so far my Knowledge).
If Viewers think It can identify meaningful setups. Looking forward to hearing from all of you — let's keep this discussion going and help each other make better trading decisions.
___________🔕^^^⚫⚪^🙏🏼🙏🏼🙏🏼^⚪⚫^^^🔔___________ NIFTY WEEKLY / Positional Level Analysis for: 29th Jun-03rd Apr 🔔 SGMN SplWP Above BULLISH BIAS => 24726.
🔔 SGMN SplWP BELOW Bearish BIAS => 23871.
Mentioned analysis based on 2 consecutive candle close in 15 min Time Frame.
━━━━━🟥🟧🟨🟩🟦🟪⬛━━━━━
💥Level Interpretation / description:
✍🏻L#1: If the candle crossed & stays above the “Buy Gen”, it is treated / considered as Bullish bias. Cfm=> Confirmation.
L#2: Possibility / Probability of REVERSAL near 🔕RL/TF1 & 🔔RL/TF2
L#3: If the candle stays above “Sell Gen” but below “Buy Gen”, it is treated / considered as Sidewise. Aggressive Traders can take Long position near “Sell Gen” either retesting or crossed from Below & vice-versa i.e. can take Short position near “Buy Gen” either retesting or crossed downward from Above.
L#4: If the candle crossed & stays below the “Sell Gen”, it is treated / considered a Bearish bias.
L#5: Possibility / Probability of REVERSAL near 🔕RL/TF1 & 🔔RL/TF2
HZB (Buy side) & HZS (Sell side) => Hurdle Zone,
✍🏻 *** Specialty of “HZB#1, HZB#2 HZS#1 & HZS#2” is Sidewise (behaviour in Nature)
Rest Plotted and Mentioned on Chart
Color code Used:
Green, BLUE =. Positive bias.
Safron, RED =. Negative bias.
RED in Between Green means Trend Finder / Momentum Change
/ CYCLE Change and Vice Versa.
Notice One thing: HOW LEVELS are Working.
Use any Momentum Indicator / Oscillator or as you "USED to" to Take entry.
━━━━━🟥🟧🟨🟩🟦🟪⬛━━━━━
⚠️ DISCLAIMER:
The information, views, and ideas shared here are purely for educational and informational purposes only. They are not intended as investment advice or a recommendation to buy, sell, or hold any financial instruments. I am not a SEBI-registered financial adviser.
Trading and investing in the stock market involves risk, and you should do your own research and analysis. You are solely responsible for any decisions made based on this research.
"🔔As HARD EARNED MONEY IS YOUR's, So DECISION SHOULD HAVE TO BE YOUR's".
━━━━━🟥🟧🟨🟩🟦🟪⬛━━━━━
❇️ Follow notification about periodical View
💥 Do Comment for Stock WEEKLY Level Analysis.🚀
📊 Do you agree with this view?
✈️ HIT THE PLANE ICON if this technical observation resonates with you. It will Motivate me.
━━━━━🟥🟧🟨🟩🟦🟪⬛━━━━━
💡 If You LOOKING any CHART & want for Level and ANALYZE?
Share your desired stock names in the comments below! I will try to analyze the chart Levels, patterns and share my technical view (so far my Knowledge).
If Viewers think It can identify meaningful setups. Looking forward to hearing from all of you — let's keep this discussion going and help each other make better trading decisions.
___________🔕^^^⚫⚪^🙏🏼🙏🏼🙏🏼^⚪⚫^^^🔔___________ The Psychology Behind FibonacciAsk ten traders how they identify potential reversal zones, and chances are several of them will mention the Fibonacci Retracement tool.
Whether they trade stocks, forex, cryptocurrencies, or commodities, Fibonacci levels appear on charts across every financial market.
This naturally raises an interesting question.
Why do Fibonacci levels seem to work?
Is there something magical about the numbers?
Or is something else happening beneath the surface?
The truth is that Fibonacci is less about mathematics and more about human behavior.
Markets don't react because of the tool itself. They react because thousands of traders around the world are watching the same levels and making decisions based on them.
Fibonacci Is a Framework, Not a Prediction
Many beginners believe Fibonacci can predict exactly where price will reverse.
It can't.
Instead, Fibonacci helps traders identify areas where buyers and sellers may become active.
Levels such as 38.2%, 50%, and 61.8% are not guarantees.
They are simply zones where market participants often pause, take profits, or look for new opportunities.
Thinking of Fibonacci as a decision-making framework rather than a prediction tool changes the way you use it.
Why Everyone Watches the Same Levels
Financial markets are driven by expectations.
When enough traders expect price to react near a particular level, many of them place orders around that area.
Some traders look for buying opportunities.
Others take profits.
Some reduce risk, while others prepare for reversals.
As more orders gather around the same price zone, the probability of a reaction naturally increases.
In many ways, Fibonacci becomes a self-fulfilling concept.
It works not because markets obey mathematics, but because traders collectively pay attention to it.
The Role of Fear and Greed
Imagine a strong bullish trend.
Price begins pulling back.
Some traders become nervous and close profitable positions.
Others patiently wait for a retracement before buying.
When price reaches a commonly watched Fibonacci level, both groups become active.
One side is taking profits.
The other is entering new trades.
This interaction between fear and opportunity often creates the reactions traders observe on their charts.
The same emotional process occurs during bearish markets.
Fibonacci Works Best with Market Context
One of the biggest mistakes traders make is drawing Fibonacci on every price swing they see.
Without context, the tool loses much of its value.
Experienced traders rarely use Fibonacci in isolation.
Instead, they combine it with:
* Support and resistance
* Trend analysis
* Market structure
* Candlestick confirmation
* Volume
* Price action
When multiple factors point to the same area, confidence in the setup naturally increases.
This is known as confluence.
The Importance of Patience
Another common misconception is that price must reverse the moment it touches a Fibonacci level.
Markets are rarely that precise.
Sometimes price reacts immediately.
Other times it moves slightly beyond the level before reversing.
This is why patient traders wait for confirmation instead of blindly placing trades.
The Fibonacci level identifies an area of interest.
Price action confirms whether buyers or sellers are actually taking control.
Fibonacci Reflects Crowd Behavior
Perhaps the greatest strength of Fibonacci is not the numbers themselves.
It is what those numbers represent.
They reveal where traders are likely to become interested.
Where profits may be taken.
Where emotions begin to change.
And where the balance between buyers and sellers may temporarily shift.
Understanding this psychological perspective helps traders avoid treating Fibonacci as a magical indicator.
Instead, it becomes a tool for understanding market behavior.
Final words:
Fibonacci is not a secret formula for predicting the future.
It is a way of identifying areas where human decisions are most likely to influence price.
The levels themselves are only part of the story.
The real story is the psychology behind them.
Because every retracement, every bounce, and every reversal begins with traders making decisions.
And in the financial markets, understanding people is often more valuable than memorizing numbers.
 Education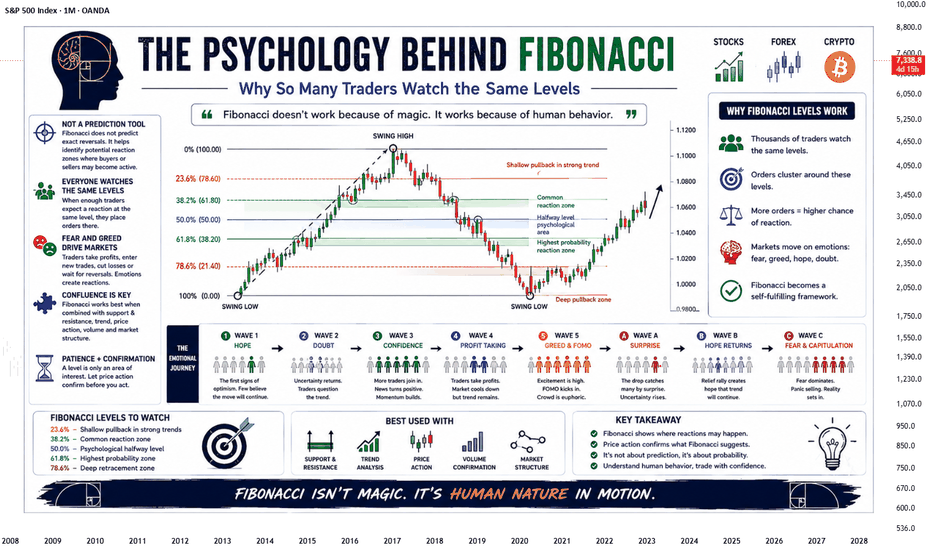
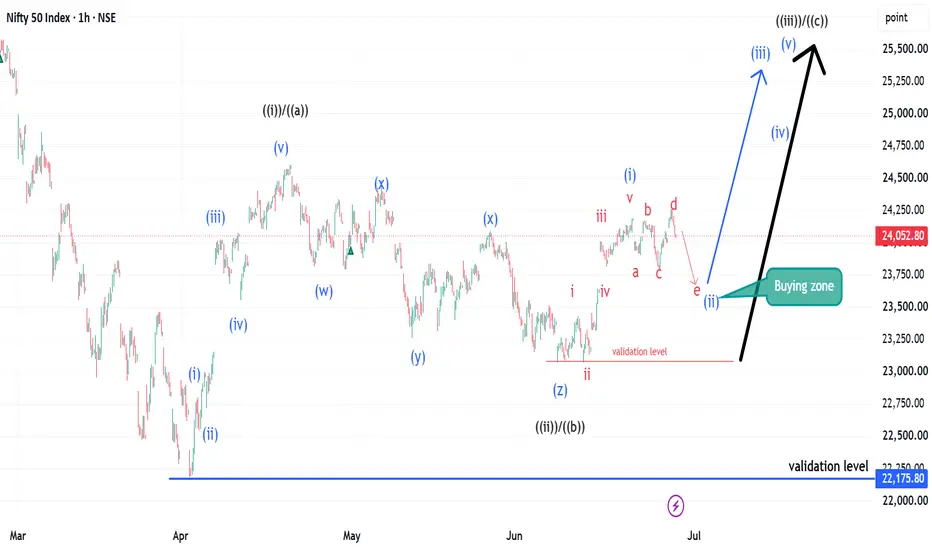
Nifty 1hrs time frame chart study or research we shared our ideas with you on 30th April 26 on 1 hour chart of Nifty, let us review the same and take it forward. First let me explain to you that market moves in impulsive moves and corrective moves, we study and read this so that we can understand which move is impulsive and which move is corrective phase, on the basis of this the corrective phase started from 21st April 26, in this phase instead of making simple ABC corrective wave, complex WXYZ corrective waves were made, the market has already completed this corrective phase and has started a new impulsive phase.
Now, let's study further. We'll separate these movements into different degrees so we can understand them by degree.
The degree is understood by their name and color coding.
Now, we're studying Nifty's 1-hour timeframe charts, so we'll explain them.
The market recently made a low of 22182 on 2 April , and a top of 24601 on 21 April. This is an impulsive move.
We have marked this degree as Minor Degree ((i))/((a)) in black color.
after that correction phase is made as WXYZ internal structure minuette degree in blue color which is complete at 23072 of minor degree ((ii))/((b)) wave.
Minor Degree ((iii))/((c)) is in progress.
From 23072 to 24189 an impulsive move occurs as internal structure i, ii, iii, iv, v Sub-minutte degree red in color
which we will keep (i) of Minute blue in color and after that correction phase is going on, as soon as the correction is completed a new impulse wave will start.
Let us discuss where wave(ii) can be completed ?
At this time, it is important to read the type of correction forming on the Nifty chart. Only then will the next impulse wave form. As per my experience, we can read that it should be a shallow correction. Now the question arises that what types of corrections are formed in a shallow correction. So, two types of corrections are formed - Flat and Triangle correction. Here, a flat correction was formed but it failed. Now, which one will be formed? A triangle will be formed. That too, what type of triangle am I seeing? It is an expanded type triangle whose last leg is the e wave pending or e wave should be completed around 23650.Wave 'e' of the triangle will mark wave (ii) of minuette degree in blue color. As soon as this wave is completed, a new impulse wave will emerge from here.
I cannot explain it in a simpler way than this and the degrees are marked on the chart with color and validation levels are marked with arrows.
Thanks
Disclaimer: I am not a SEBI registered financial advisor. Consult your financial advisor before making any trade or investment. This is being shared for educational purposes only.
MKT Learner