NIFTY DAILY / Short range Level Analysis for 24th Jun 2026.🔕 SGMN SplD BULLISH Above => 24900.
🔕 SGMN SplD Bearish BELOW => 24753.
Mentioned analysis based on 2 consecutive candle close in 15 min Time Frame.
━━━━━🟥🟧🟨🟩🟦🟪⬛━━━━━
💥Level Interpretation / description:
✍🏻L#1: If the candle crossed & stays above the “Buy Gen”, it is treated / considered as Bullish bias. Cfm=> Confirmation.
L#2: Possibility / Probability of REVERSAL near 🔕RL/TF1 & 🔔RL/TF2
L#3: If the candle stays above “Sell Gen” but below “Buy Gen”, it is treated / considered as Sidewise. Aggressive Traders can take Long position near “Sell Gen” either retesting or crossed from Below & vice-versa i.e. can take Short position near “Buy Gen” either retesting or crossed downward from Above.
L#4: If the candle crossed & stays below the “Sell Gen”, it is treated / considered a Bearish bias.
L#5: Possibility / Probability of REVERSAL near 🔕RL/TF1 & 🔔RL/TF2
HZB (Buy side) & HZS (Sell side) => Hurdle Zone,
✍🏻 *** Specialty of “HZB#1, HZB#2 HZS#1 & HZS#2” is Sidewise (behaviour in Nature)
Rest Plotted and Mentioned on Chart
Color code Used:
Green, BLUE =. Positive bias.
Safron, RED =. Negative bias.
RED in Between Green means Trend Finder / Momentum Change
/ CYCLE Change and Vice Versa.
Notice One thing: HOW LEVELS are Working.
Use any Momentum Indicator / Oscillator or as you "USED to" to Take entry.
━━━━━🟥🟧🟨🟩🟦🟪⬛━━━━━
⚠️ DISCLAIMER:
The information, views, and ideas shared here are purely for educational and informational purposes only. They are not intended as investment advice or a recommendation to buy, sell, or hold any financial instruments. I am not a SEBI-registered financial adviser.
Trading and investing in the stock market involves risk, and you should do your own research and analysis. You are solely responsible for any decisions made based on this research.
"🔔As HARD EARNED MONEY IS YOUR's, So DECISION SHOULD HAVE TO BE YOUR's".
━━━━━🟥🟧🟨🟩🟦🟪⬛━━━━━
❇️ Follow notification about periodical View
💥 Do Comment for Stock WEEKLY Level Analysis.🚀
📊 Do you agree with this view?
✈️ HIT THE PLANE ICON if this technical observation resonates with you. It will Motivate me.
━━━━━🟥🟧🟨🟩🟦🟪⬛━━━━━
💡 If You LOOKING any CHART & want for Level and ANALYZE?
Share your desired stock names in the comments below! I will try to analyze the chart Levels, patterns and share my technical view (so far my Knowledge).
If Viewers think It can identify meaningful setups. Looking forward to hearing from all of you — let's keep this discussion going and help each other make better trading decisions.
___________🔕^^^⚫⚪^🙏🏼🙏🏼🙏🏼^⚪⚫^^^🔔___________ NIFTY 50: Trading Inside a Major HTF Compression ZoneNIFTY 50: Trading Inside a Major HTF Compression Zone | Breakout or Breakdown Ahead?
Timeframe: 4H
Date: 23 June 2026
NIFTY is currently trapped between two significant higher-timeframe structures, creating a large compression pattern that could determine the next directional move.
The index recently tested a major monthly resistance zone and the descending trendline resistance, but buyers failed to sustain momentum above the supply area. The rejection from this confluence zone suggests that sellers are still defending higher prices.
Technical Overview
🔹 Price reacted from the Monthly Strong Resistance zone near 24,150 – 24,250.
🔹 The descending HTF trendline continues to act as dynamic resistance.
🔹 Recent candles show bearish rejection after testing resistance, indicating profit booking and supply absorption.
🔹 Sell-side liquidity remains below current price and could become the next attraction if weakness continues.
🔹 The broader structure remains a compression between:
Descending resistance trendline
Ascending support trendline
This creates a potential symmetrical triangle / squeeze setup on the higher timeframe.
Bearish Scenario
As long as NIFTY remains below the descending trendline and monthly resistance zone, downside pressure may persist.
Bullish Scenario
For buyers to regain control:
✔ Price must reclaim and hold above 24,150 – 24,250
✔ A decisive breakout above the HTF trendline would invalidate the current bearish rejection.
Such a move could trigger fresh momentum buying and continuation toward new swing highs.
Key Levels
Major Resistance: 24,150 – 24,250
Trendline Resistance: Dynamic
Sell-Side Liquidity Zone: Around 23,800
Monthly Strong Support: 22,950 – 23,100
Outlook
The market is approaching the apex of a large higher-timeframe compression structure. Historically, such conditions often lead to strong directional expansion once either boundary breaks.
Until a confirmed breakout occurs, traders should monitor reactions at both trendline resistance and the lower liquidity zones for clues regarding the next major move.
Bias: Neutral to Bearish below 24,150 | Bullish above 24,250
Trade what price confirms, not what you anticipate. Risk management remains essential.
#NIFTY #NIFTY50 #PriceAction #SmartMoneyConcepts #ICT #Liquidity #SupportAndResistance #TradingViewIndia #TechnicalAnalysis #IndianStockMarket #IndexTrading #SwingTrading
Disclaimer: This analysis is shared for educational purposes only and does not constitute investment advice. Markets involve substantial risk. Please conduct your own research and use appropriate risk management before taking any trade. I am not a SEBI-registered investment advisor. All views expressed are personal opinions based on technical analysis. Updated Analysis (Based on New Projection)I can see you've added a bullish trendline/projection from the current price (~23,795) toward the upper supply zone.
What Changed?
Previously:
Market structure was bearish.
Price was expected to move between the two zones.
Now:
Price is sitting exactly near a potential intraday support (~23,795).
Your blue trendline suggests a direct move toward the upper zone (23,955–23,975).
This creates a counter-trend long setup.
Bullish Scenario (Your Projection)
Entry Zone
23,790 – 23,810
Stop Loss
23,745
Targets
Target Level
T1 23,850
T2 23,900
T3 23,955
T4 23,975
Risk/Reward
Risk ≈ 50 points
Reward ≈ 180 points
R:R ≈ 1 : 3.5
Important Resistance Levels
Resistance 1
23,850
This is the first obstacle.
Resistance 2
23,900–23,920
Expect profit booking here.
Major Supply Zone
23,955–23,975
This is where I would expect sellers to become active.
Trade Management
Aggressive Trader
Buy:
23,790–23,810
SL:
23,745
Trail SL after:
23,850
Conservative Trader
Wait for a 15-minute candle close above:
23,850
Then buy.
Targets:
23,920
23,975
What Would Invalidate This Bullish View?
If NIFTY closes below:
23,745
Then your bullish projection becomes weak.
Next downside targets:
23,700
23,650
23,620 Demand Zone
Probability Assessment
Bullish Move to Supply Zone
65%
Sideways Movement
20%
Direct Breakdown to Demand Zone
15%
Trading Plan
Buy: 23,790–23,810
SL: 23,745
T1: 23,850
T2: 23,900
T3: 23,955
T4: 23,975
If price reaches 23,955–23,975, I would not initiate fresh longs there. That area is more suitable for:  Short
Short
HOW-TO: Large Capital Used Multi-Strategy Baskets in algotradingThis tutorial explains how high-capital traders use multi-strategy baskets combining Intraday S/R levels, Weekly Expiry Range, and BTST/STBT momentum signals. Learn to execute multiple strategies simultaneously with defined risk.
Markets: Nifty, BankNifty
Timeframe: 15-minute
Part 1: The Three-Tool Setup
From the chart:
Tool 1: Intraday S/R Indicator — Identifies entry/exit zones for each strategy
Tool 2: Weekly Expiry Range — Defines weekly boundaries for options selling
Tool 3: BTST/STBT Scanner — Overnight momentum signals for positioning
Current Setup:
Current Price: 23,905
Intraday Support 1: 23,800
Intraday Resistance 1: 24,000
Weekly Range: 23,500-24,200
Part 2: Strategy Mapping
Strategy 1: Breakout Trade
Entry: Above 24,000 (Intraday R1)
Stop-Loss: 23,900 (below resistance)
Trigger: BTST/STBT scanner shows bullish momentum
Basket: BUY Nifty at market
Strategy 2: Reversal Trade
Entry: At 23,800 (Intraday S1) with bullish candle
Stop-Loss: 23,700
Trigger: Price rejects support
Basket: BUY Nifty with defined stop-loss
Strategy 3: Non-Directional (Option Selling)
Entry: Sell Call above 24,200 (Weekly Upper)
Entry: Sell Put below 23,500 (Weekly Lower)
Trigger: Scanner shows range-bound condition
Basket: SELL Call + SELL Put together
Part 3: How BTST/STBT Scanner Enhances Execution
BTST/STBT Scanner identifies momentum signals during final 30 minutes (3:00-3:29 PM IST).
Integration with Baskets:
Bullish BTST signal → Activate breakout/reversal baskets
Bearish STBT signal → Activate short baskets
No scanner signal → Hold, wait
Part 4: How Weekly Expiry Range Defines Boundaries
Weekly Expiry Range provides structural boundaries:
Upper Line 2: 24,200 (Stop-loss zone for call selling)
Upper Line 1: 24,000 (Breakout trigger)
Lower Line 1: 23,800 (Reversal trigger)
Lower Line 2: 23,500 (Stop-loss zone for put selling)
Part 5: Complete Decision Rules
Range-Bound (Between 23,800-24,000):
Strategy: Option Selling (Non-Directional)
Basket: Sell Call + Sell Put
Exit: If price breaches Weekly Upper/Lower
Breakout (Above 24,000):
Strategy: Breakout Trade (Directional)
Basket: BUY Nifty
Exit: If price closes below 23,900
Reversal (At 23,800 with bullish candle):
Strategy: Reversal Trade
Basket: BUY Nifty
Exit: If price breaks below 23,700
Part 6: Why This Works for Large Capital
Factor Why It Matters
Multiple confirmation S/R + Scanner + Weekly range = high probability
Defined risk Each basket has clear SL
Scalable Works with multiple lots
Automated Webhook bridge executes baskets
For Automation
Set webhook alerts for each condition:
Alert 1: Price above 24,000 → Breakout basket
Alert 2: Price touches 23,800 with bullish candle → Reversal basket
Alert 3: Price between 23,800-24,000 → Option selling basket
Alert 4: BTST/STBT scanner signal → Confirm momentum
Disclaimer
This is for educational purposes only. Trading involves risk. Past performance does not guarantee future results.
Education 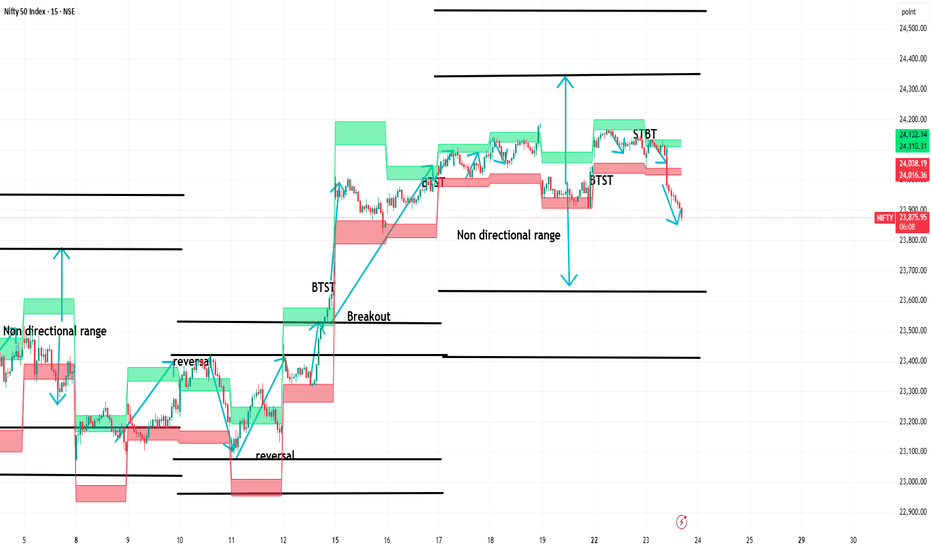
NIFTY: Trendline Breakout Meets Demand Zone – Bigger Move Ahead?🌍 The Bigger Picture Favors the Buyers 🌍
At first glance, NIFTY may appear to be moving sideways, but a closer look reveals an interesting story developing beneath the surface.
The most important area on this chart is the Weekly Demand Zone . This higher timeframe demand area has already demonstrated its strength by attracting buyers and preventing further downside. Recently, price revisited this zone and immediately found support, suggesting that institutional demand may still be active.
Higher timeframe zones often carry greater significance because they reflect decisions made by larger market participants. As long as this Weekly Demand Zone remains intact, the broader structure remains constructive.
📈 Daily Demand Emerging Inside Weekly Demand 📈
One of the strongest observations on this chart is the formation of a Daily Demand Zone within the larger Weekly Demand Zone.
This creates a powerful alignment between timeframes.
When a Daily Demand Zone forms inside an active Weekly Demand Zone, it often indicates that buyers are becoming active at multiple levels of the market.
The recent rally originated from this Daily Demand Zone, showing that buyers were willing to step in before price could move deeper into the Weekly Demand area.
This is exactly the type of behavior bulls want to see.
🔥 The Trendline Breakout Changes the Story 🔥
For several months, NIFTY remained under pressure from a falling trendline that guided the correction lower.
That situation has now changed.
Price has successfully broken above the descending trendline, which suggests that bearish momentum is weakening and market character may be shifting.
More importantly, after the breakout, price did not collapse back below the trendline. Instead, it has been consolidating above it.
This is often a healthier sign than a breakout followed by immediate rejection.
The Role of the Daily Supply Zone
The next important area on the chart is the Daily Supply Zone overhead.
This zone has already been tested previously, making it a key battleground between buyers and sellers.
Many traders focus only on the existence of supply, but the more interesting observation is that price continues to challenge this area after bouncing from demand.
Buyers defended the Daily Demand Zone.
Price broke the falling trendline.
The market recovered from the Weekly Demand Zone.
Price is now holding near Daily Supply instead of getting aggressively rejected.
This behavior can sometimes indicate that selling pressure is gradually being absorbed.
🎯 What the Price Action Is Telling Us 🎯
The current structure is no longer showing the characteristics of a strong downtrend.
Instead, the market appears to be transitioning into a phase of consolidation after a successful bounce from higher timeframe demand.
Weekly Demand Zone remains respected.
Daily Demand Zone successfully generated a rally.
Falling trendline has been broken.
Price is consolidating near Daily Supply.
Sellers have not regained complete control.
This doesn't guarantee a bullish move, but it does suggest that the market is in a much stronger position than it was during the decline.
🚦 What Traders Should Watch Next 🚦
Bullish Scenario
Daily Demand continues to hold.
Buyers maintain control above the broken trendline.
Daily Supply gets absorbed.
Momentum expands toward higher supply zones.
Bearish Scenario
Daily Supply produces a strong rejection.
Price falls back below the breakout area.
Daily Demand fails to attract buyers.
Market revisits deeper portions of the Weekly Demand Zone.
💡 Final Thoughts 💡
The most compelling aspect of this chart is not the Daily Supply Zone overhead, but the confluence between the Daily Demand Zone and the Weekly Demand Zone below.
This alignment, combined with the successful breakout above the falling trendline, suggests that buyers have started to regain control after months of corrective price action.
While the Daily Supply Zone remains an important obstacle, the overall structure appears healthier than many traders may initially assume.
The next major clue will come from how price behaves around this Daily Supply Zone. A successful breakout could significantly strengthen the bullish case, while a rejection would likely extend the current consolidation phase.
Great traders don't wait for certainty—they wait for confirmation. 📈🚀
This analysis is for educational purposes only and should not be considered financial, trading, or investment advice. I am not a SEBI registered analyst.
Thank you for your support, your likes & comments. Feel free to ask if you have questions. 📊
Long 
Short 
Nifty Intraday Outlook 23-June-2026📈 NIFTY 50: Consolidation Near Highs — Breakout or Pullback?
Nifty continues to trade in a bullish structure, but momentum has slowed as price consolidates below the 24,150 resistance zone.
🔴 Resistance: 24,150 – 24,200
🟢 Support: 24,040 – 24,000
Key Observations:
✔ Higher Highs & Higher Lows remain intact.
✔ Bull Flag / Consolidation pattern visible.
✔ Multiple rejections near 24,150 suggest profit booking.
Trading Plan:
📌 Bullish: Sustained move above 24,150 may open the gates for 24,250–24,320.
📌 Bearish: A breakdown below 24,000 could trigger profit booking towards 23,900.
⚠️ Avoid trading inside the current range. Wait for a confirmed breakout or breakdown before taking fresh positions.
Patience pays. Let price confirm the direction before committing capital.
What do you expect next: Breakout 🚀 or Pullback 📉?  Long
Long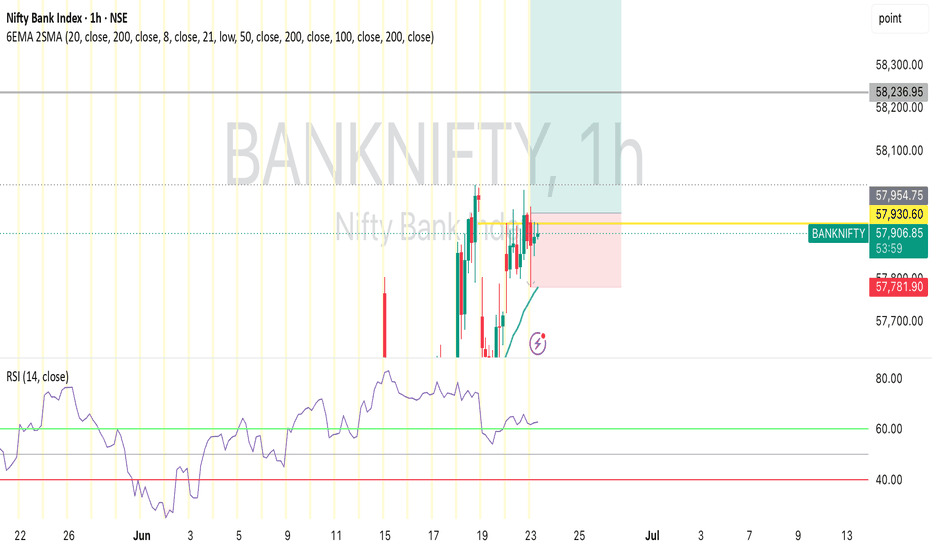
#BANKNIFTY Intraday PE & CE Levels(23/06/2026)Bank Nifty is expected to open with a flat bias around the 57850–57900 zone as the index continues to consolidate near a crucial resistance area after a strong recovery from lower levels. Despite some profit booking near higher levels, the broader trend remains positive with buyers maintaining control above key support zones.
For today's session, 58050 remains the immediate breakout level to watch. A sustained move above 58050 can trigger fresh buying momentum towards 58250, 58350, and 58450+ levels. The index is currently trading just below a major resistance zone, and a breakout above this level may lead to a fresh bullish expansion.
On the downside, 57950–57900 remains the key intraday resistance-based selling zone. Any weakness from this area may attract profit booking towards 57750, 57650, and 57550 levels. However, as long as Bank Nifty holds above the 57550 support zone, the overall market structure remains bullish and dips are likely to find buying interest. #NIFTY Intraday Support and Resistance Levels - 23/06/2026Nifty is expected to open with a flat bias around the 24050–24100 zone as the index continues to consolidate near a crucial breakout area after a strong recovery from lower levels. Despite some profit booking in the previous session, the overall structure remains positive with buyers actively defending key support levels.
For today's session, 24050 remains the immediate breakout level to watch. A sustained move above 24050 can trigger fresh buying momentum towards 24150, 24200, and 24250+ levels. The index is currently trading within a consolidation range, and a breakout above this zone may lead to an expansion in volatility on the upside.
On the downside, 23950–23900 remains the key intraday selling zone. Any weakness below this range may attract fresh selling pressure towards 23850, 23800, and 23750 levels. However, as long as Nifty holds above the 24000–23950 support area, the broader bullish structure remains intact. NIFTY 50 — INTRADAY PLAN | 23 JUNE 2026📊 Boost Target 25 for Next Post.
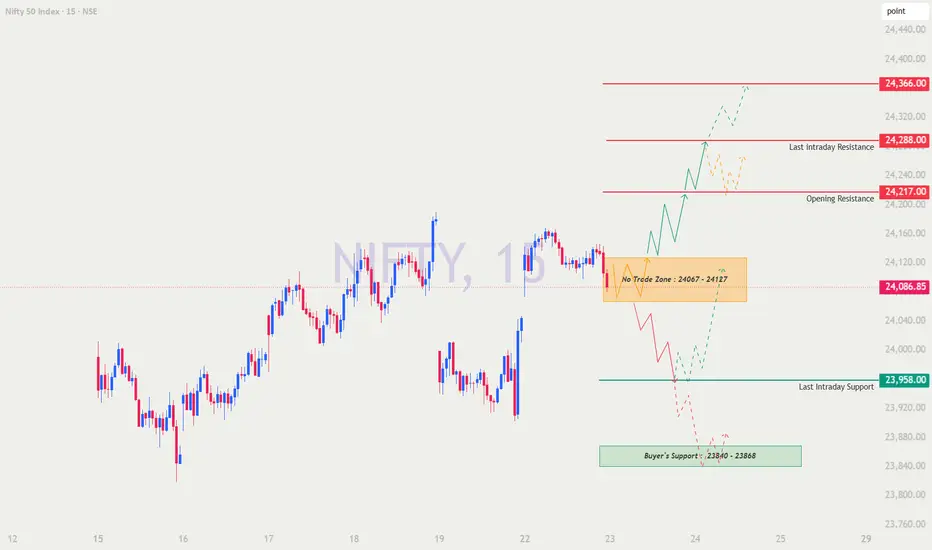
⏰ 15 Min Chart | 🏛 NSE | 📍 Ref Price : 24,086.85
━━━━━━━━━━━━━━━━━━━━━━━━━━━━━━━━━━━━━━━━━━━
💬 "Plan the trade. Trade the plan. Protect the capital."
━━━━━━━━━━━━━━━━━━━━━━━━━━━━━━━━━━━━━━━━━━━
🗝 KEY LEVELS
━━━━━━━━━━━━━━━━━━━━━━━━━━━━━━━━━━━━━━━━━━━
🔴 Upper Resistance ➤ 24,366
🔴 Last Intraday Resistance➤ 24,288
🔴 Opening Resistance ➤ 24,217
🟡 No Trade Zone (NTZ) ➤ 24,067 – 24,127
🟢 Last Intraday Support ➤ 23,958
🟢 Buyer's Support Zone ➤ 23,840 – 23,868
━━━━━━━━━━━━━━━━━━━━━━━━━━━━━━━━━━━━━━━━━━━
🟢 GAP UP — 100+ POINTS | Open Above 24,186
━━━━━━━━━━━━━━━━━━━━━━━━━━━━━━━━━━━━━━━━━━━
Price opens near or above Opening Resistance (24,217).
First instinct will be to BUY — resist it. Gap ups into
resistance are fade candidates until proven otherwise.
✅ BULLISH — If 15-min candle CLOSES above 24,217
◉ Entry : Above breakout candle high
◉ Target 1 : 24,288 ← Book 50–60% here
◉ Target 2 : 24,366 ← Trail SL aggressively
◉ Stop Loss : 24,150
◉ Options : Buy ATM CE
✅ BEARISH — Rejection candle at 24,217–24,288
◉ Entry : Below rejection candle low
◉ Target 1 : 24,127 (NTZ Upper Band)
◉ Target 2 : 24,067 (NTZ Lower Band)
◉ Stop Loss : 24,240
◉ Options : Buy ATM PE
⚡ Key Reminder : Wait for the full first 15-min candle.
Never buy blindly into resistance on a gap up open.
━━━━━━━━━━━━━━━━━━━━━━━━━━━━━━━━━━━━━━━━━━━
🟡 FLAT OPEN — ±50 to 100 Points | 23,986–24,186
━━━━━━━━━━━━━━━━━━━━━━━━━━━━━━━━━━━━━━━━━━━
Price opens inside or near the NTZ (24,067–24,127).
This is the most tradeable scenario — levels are intact
and price action is clean. The NTZ resolves the direction.
⛔ INSIDE NTZ → NO TRADE. Watch. Set alerts. Be patient.
✅ BULLISH — 15-min close above 24,127
◉ Entry : Above breakout candle high
◉ Target 1 : 24,217 ← Book partial here
◉ Target 2 : 24,288
◉ Stop Loss : 24,085
◉ Options : Buy ATM CE | Bull Call Spread
✅ BEARISH — 15-min close below 24,067
◉ Entry : Below breakdown candle low
◉ Target 1 : 23,958 (Last Intraday Support)
◉ Target 2 : 23,868 (Buyer's Zone)
◉ Stop Loss : 24,110
◉ Options : Buy ATM PE
✅ BOUNCE SETUP — If price dips to 23,958
◉ Wait for hammer / engulfing candle + volume spike
◉ Entry : Above reversal candle high
◉ Target : 24,067 → 24,127 | SL : Below 23,930
━━━━━━━━━━━━━━━━━━━━━━━━━━━━━━━━━━━━━━━━━━━
🔴 GAP DOWN — 100+ POINTS | Open Below 23,986
━━━━━━━━━━━━━━━━━━━━━━━━━━━━━━━━━━━━━━━━━━━
Price opens near or below Last Intraday Support (23,958).
Golden Rule : Do not panic-sell at the open. Do not
buy without confirmation. Let the first candle form first.
✅ BOUNCE — If 23,958 holds (2 bullish candles)
◉ Entry : Above 2nd confirmation candle high
◉ Target 1 : 24,067
◉ Target 2 : 24,127
◉ Stop Loss : Below 23,925 (strict — no averaging)
◉ Options : Buy ATM CE
✅ BREAKDOWN — If 23,958 fails (close below 23,940)
◉ Entry : Below breakdown candle low
◉ Target 1 : 23,868 (Buyer's Zone)
◉ Target 2 : 23,840
◉ Stop Loss : 23,975
◉ Options : Buy ATM PE
✅ IF OPENS AT BUYER'S ZONE 23,840–23,868
◉ High-value demand zone — expect a bounce attempt
◉ Wait for hammer / doji + volume confirmation
◉ Entry : Above confirmation candle high
◉ Target : 23,958 → 24,067 | SL : Below 23,815
◉ ⚠ If zone breaks → next support 23,700–23,628
⚡ Key Reminder : The lower the open, the higher the
bounce probability — IF a key zone is holding. Let
price show you the base before entering longs.
━━━━━━━━━━━━━━━━━━━━━━━━━━━━━━━━━━━━━━━━━━━
🛡 OPTIONS RISK MANAGEMENT — QUICK RULES
━━━━━━━━━━━━━━━━━━━━━━━━━━━━━━━━━━━━━━━━━━━
◉ Risk only 1–2% of capital per trade. No exceptions.
◉ Avoid far OTM options — cheap premium = cheap reason.
◉ Never trade the first 5 minutes (9:15–9:20 AM IST).
◉ Book 50% at Target 1. Trail stop on the rest.
◉ Set a daily max loss limit — hit it, stop for the day.
◉ Never average down on a losing options position.
◉ On gap days, cut your position size by 50%.
◉ If your setup didn't trigger → there is NO trade today.
━━━━━━━━━━━━━━━━━━━━━━━━━━━━━━━━━━━━━━━━━━━
📝 SUMMARY
━━━━━━━━━━━━━━━━━━━━━━━━━━━━━━━━━━━━━━━━━━━
🟢 Bullish above 24,127 → 24,217 → 24,288 → 24,366
🔴 Bearish below 24,067 → 23,958 → 23,840–23,868
⛔ Inside 24,067–24,127 → No Trade | Wait for breakout
The map is drawn. The levels are clear. Your only job
is to wait for the market to confirm direction — then
execute with discipline, not emotion. 🎯
🧠 "The best trade you ever make is the bad one you avoided."
━━━━━━━━━━━━━━━━━━━━━━━━━━━━━━━━━━━━━━━━━━━
⚠ DISCLAIMER
━━━━━━━━━━━━━━━━━━━━━━━━━━━━━━━━━━━━━━━━━━━
For educational purposes only. Not financial advice.
📢 I am NOT a SEBI Registered Research Analyst.
No buy/sell recommendation is intended or implied.
Please consult your SEBI-registered advisor before
making any trading or investment decisions.
Trade at your own risk. Protect your capital. 🙏
━━━━━━━━━━━━━━━━━━━━━━━━━━━━━━━━━━━━━━━━━━━
━━━━━━━━━━━━━━━━━━━━━━━━━━━━━━━━━━━━━━━━━━━
Long 
BANKNIFTY DAILY Short Range Level Analysis: 23rd Jun 2026🔕 SGMN SplD BULLISH Above => 58121.
🔕 SGMN SplD Bearish BELOW => 57759.
Mentioned analysis based on 2 consecutive candle close in 15 min Time Frame.
━━━━━🟥🟧🟨🟩🟦🟪⬛━━━━━
💥Level Interpretation / description:
✍🏻L#1: If the candle crossed & stays above the “Buy Gen”, it is treated / considered as Bullish bias. Cfm=> Confirmation.
L#2: Possibility / Probability of REVERSAL near 🔕RL/TF1 & 🔔RL/TF2
L#3: If the candle stays above “Sell Gen” but below “Buy Gen”, it is treated / considered as Sidewise. Aggressive Traders can take Long position near “Sell Gen” either retesting or crossed from Below & vice-versa i.e. can take Short position near “Buy Gen” either retesting or crossed downward from Above.
L#4: If the candle crossed & stays below the “Sell Gen”, it is treated / considered a Bearish bias.
L#5: Possibility / Probability of REVERSAL near 🔕RL/TF1 & 🔔RL/TF2
HZB (Buy side) & HZS (Sell side) => Hurdle Zone,
✍🏻 *** Specialty of “HZB#1, HZB#2 HZS#1 & HZS#2” is Sidewise (behaviour in Nature)
Rest Plotted and Mentioned on Chart
Color code Used:
Green, BLUE =. Positive bias.
Safron, RED =. Negative bias.
RED in Between Green means Trend Finder / Momentum Change
/ CYCLE Change and Vice Versa.
Notice One thing: HOW LEVELS are Working.
Use any Momentum Indicator / Oscillator or as you "USED to" to Take entry.
━━━━━🟥🟧🟨🟩🟦🟪⬛━━━━━
⚠️ DISCLAIMER:
The information, views, and ideas shared here are purely for educational and informational purposes only. They are not intended as investment advice or a recommendation to buy, sell, or hold any financial instruments. I am not a SEBI-registered financial adviser.
Trading and investing in the stock market involves risk, and you should do your own research and analysis. You are solely responsible for any decisions made based on this research.
"🔔As HARD EARNED MONEY IS YOUR's, So DECISION SHOULD HAVE TO BE YOUR's".
━━━━━🟥🟧🟨🟩🟦🟪⬛━━━━━
❇️ Follow notification about periodical View
💥 Do Comment for Stock WEEKLY Level Analysis.🚀
📊 Do you agree with this view?
✈️ HIT THE PLANE ICON if this technical observation resonates with you. It will Motivate me.
━━━━━🟥🟧🟨🟩🟦🟪⬛━━━━━
💡 If You LOOKING any CHART & want for Level and ANALYZE?
Share your desired stock names in the comments below! I will try to analyze the chart Levels, patterns and share my technical view (so far my Knowledge).
If Viewers think It can identify meaningful setups. Looking forward to hearing from all of you — let's keep this discussion going and help each other make better trading decisions.
___________🔕^^^⚫⚪^🙏🏼🙏🏼🙏🏼^⚪⚫^^^🔔___________ The Algo Liquidity Hunt: How Machines Find Retail Stop Losses?Many retail traders believe that the market randomly hits their stop loss before moving in the expected direction. While it may feel unfair, there is often a reason behind these sudden moves.
Modern markets are heavily influenced by algorithms and institutional traders that constantly search for liquidity. Since stop-loss orders represent a pool of pending orders, they naturally become attractive targets.
Understanding how liquidity hunts work can help traders avoid becoming easy prey.
The Liquidity Hunt Cycle:
The process usually follows a predictable pattern:
Retail Creates Stops
↓
Liquidity Builds
↓
Algorithms Detect Order Flow
↓
Stop Hunt
↓
Price Reversal
1. Retail Traders Create Stop Losses:
--------------------------------------------
Most traders are taught to place stop losses above resistance or below support levels.
Common stop-loss locations
Below swing lows.
Above swing highs.
Under support zones.
Above resistance levels.
Around round numbers.
Because thousands of traders use similar techniques, stop orders begin to accumulate in the same areas.
Why this matters:
Stop losses are visible as liquidity zones.
Clusters of orders attract large players.
Markets naturally seek areas with abundant liquidity.
The more obvious the level, the larger the pool of stop orders.
2. Liquidity Starts Building:
--------------------------------
As more traders enter positions, more stop-loss orders gather around key price levels.
Places where liquidity usually accumulates
Previous highs and lows
These are among the most common targets.
Support and resistance zones
Retail traders frequently hide stops around these levels.
Equal highs and equal lows
Multiple touches create obvious liquidity pools.
Trendline levels
Many traders use the same trendlines, causing stops to cluster.
Why institutions need liquidity
Large orders cannot always be filled instantly.
To enter or exit positions efficiently, institutions need a large number of counterparties. Stop-loss orders provide that liquidity.
3. Algorithms Detect Order Flow
---------------------------------------
Modern trading algorithms continuously analyze market behavior.
What algorithms look for:
Areas with heavy order concentration.
High-volume zones.
Repeated support and resistance levels.
Previous swing highs and lows.
Sudden increases in volatility.
These systems don't necessarily "see" individual stop losses, but they can identify where liquidity is likely to exist.
Their objective:
Find areas with abundant orders.
Access liquidity efficiently.
Minimize slippage.
Execute large positions smoothly.
In other words, algorithms follow liquidity because liquidity makes execution easier.
4. The Stop Hunt Begins:
-----------------------------
Once the price reaches a major liquidity zone, sharp moves often occur.
What happens during a stop hunt:
Price breaks above resistance or below support.
Retail stop losses are triggered.
Panic buying or selling increases momentum.
Extra liquidity enters the market.
This move often appears like a breakout.
Why traders get trapped:
Many traders:
Exit their positions.
Reverse their trades.
Chase the breakout emotionally.
Unfortunately, this is often exactly what institutions expect.
5. Price Reversal:
---------------------
After enough liquidity has been collected, price frequently reverses.
Signs of a potential reversal:
Long candle wicks.
False breakouts.
Sudden spikes in volume.
Sharp rejection from highs or lows.
Strong momentum in the opposite direction.
Why reversals happen:
Once institutions complete their transactions, there is no longer a need to push price further.
The market then resumes its original direction.
This is why traders often say:
"The market hit my stop loss and then immediately went where I expected."
How Smart Traders Avoid Liquidity Hunts
------------------------------------------------
Avoid obvious stop-loss locations.
Wait for confirmation before trading breakouts.
Understand market structure.
Watch for false breakouts.
Think like institutions rather than the crowd.
Instead of asking:
"Where should I place my stop?"
Ask:
"Where are most traders placing their stops?"
That question alone can completely change how you view the market.
My Conclusion:
Liquidity hunts are not necessarily market manipulation. They are a natural consequence of how modern markets operate.
The cycle usually looks like this:
Retail Creates Stops
↓
Liquidity Builds
↓
Algorithms Detect Order Flow
↓
Stop Hunt
↓
Price Reversal
Traders who understand this process stop thinking like the crowd and start thinking in terms of liquidity and market structure. In today's algorithm-driven markets, understanding where liquidity exists is often more important than predicting where the price will go.
By @BrightRally_Research on @tradingview Education