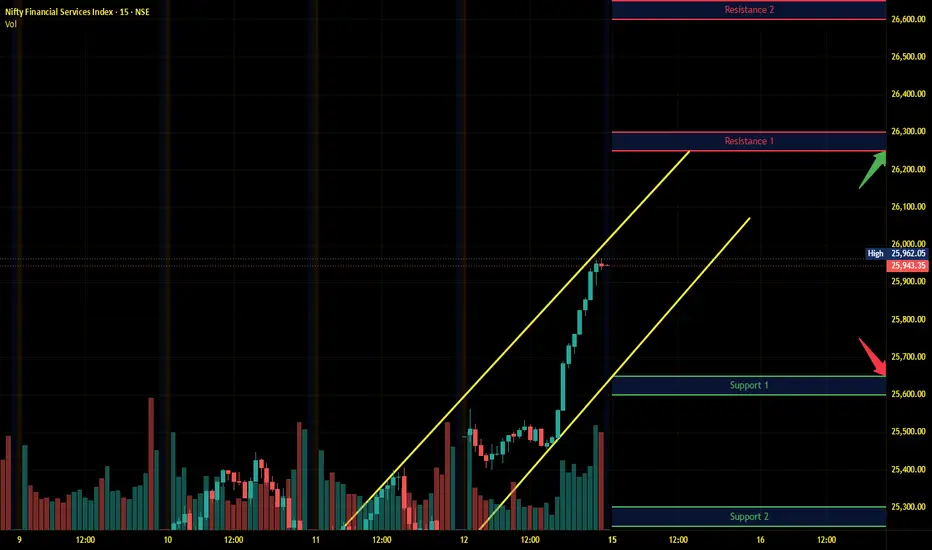
Long
Long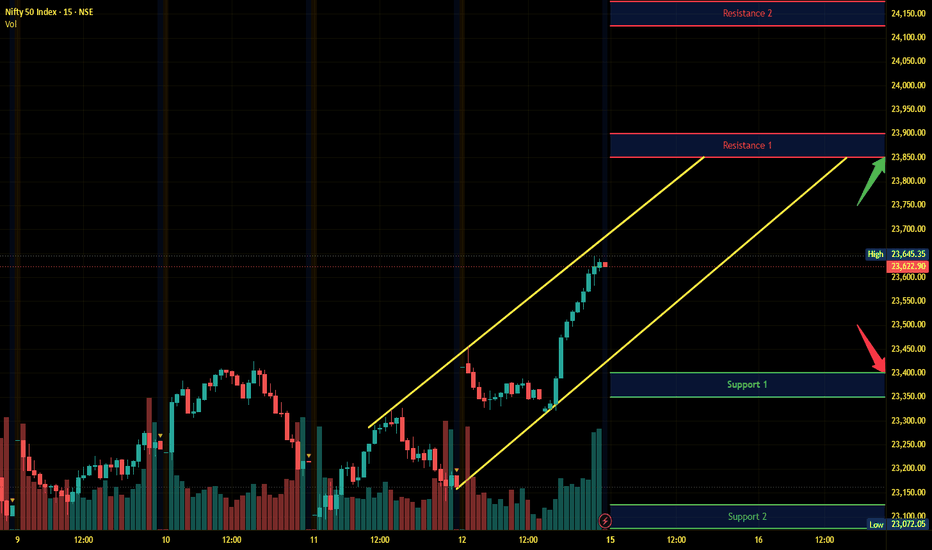
 Long
Long
 Long
Long
 Long
Long
HOW-TO: 1& 0DTE Range Trading System(Non-Directional+DirectionalThis educational tutorial explains a complete trading system using DTE Range levels (2 lines above Base, 2 lines below Base) for Non-Directional Trading with option selling, Directional Reversal trades from inner lines, and Directional Breakout trades beyond outer lines.
Markets: Nifty, BankNifty, and any liquid instrument with weekly or monthly expiry.
Timeframe: Best on 5-minute, 15-minute, or 1-hour charts.
Part 1: Understanding DTE Range Levels
DTE Range levels are calculated automatically based on historical range analysis and reference price at specified time.
The Output:
Upper Line 2 - Outer Resistance (Breakout level)
Upper Line 1 - Inner Resistance (Reversal level)
BASE - Pivot / Reference Price
Lower Line 1 - Inner Support (Reversal level)
Lower Line 2 - Outer Support (Breakdown level)
Key Insight: These levels are derived from actual market range behavior, adapting to current volatility.
Part 2: Premium Decay - The Technical Logic
What happens in the last 24 hours to expiry:
Force 1 - Time Value Exhaustion (Theta): With one day remaining, time value decays at its fastest rate. Approximately 60-70% of remaining time value typically erodes in the final trading day.
Force 2 - Volatility Smash (Vega Collapse): OTM implied volatility historically decreases significantly in the last 24 hours as demand for protection reduces.
Force 3 - Probability Concentration: Historical observation shows markets tend to stay within inner lines approximately 85-90% of the time in similar conditions during the final trading day.
Note: These are historical observations only, not guarantees of future performance.
Part 3: The Three Trading Strategies
Strategy 1: Non-Directional (Option Selling)
When: Market is between Lower Line 1 and Upper Line 1
Setup Steps:
Identify Base and Line 1 levels from chart
Sell Call at next strike ABOVE Upper Line 1
Sell Put at next strike BELOW Lower Line 1
Collect credit
Hold until expiry or 50-70% profit target
Risk Management: Close both legs if price breaches Line 2 (outer). Position size: 1-2% of capital per trade.
Best for: Range-bound markets, low volatility environment.
Strategy 2: Directional - Reversal (Mean Reversion)
When: Price touches Upper Line 1 or Lower Line 1 with candlestick confirmation
Reversal from Lower Line 1 (BUY):
Entry: At Lower Line 1 plus bullish candle (hammer, engulfing, or pin bar)
Stop Loss: Lower Line 2
Target: Base (conservative) or Upper Line 1 (aggressive)
Reversal from Upper Line 1 (SELL):
Entry: At Upper Line 1 plus bearish candle (shooting star, engulfing, or pin bar)
Stop Loss: Upper Line 2
Target: Base or Lower Line 1
Best for: Trending markets that respect levels, mean reversion strategies.
Strategy 3: Directional - Breakout (Trend Following)
When: Price closes beyond Upper Line 2 or below Lower Line 2
Bullish Breakout:
Entry: On candle close above Upper Line 2
Stop Loss: Upper Line 1
Target: Measured move (distance from Base to Line 2 projected upward)
Bearish Breakdown:
Entry: On candle close below Lower Line 2
Stop Loss: Lower Line 1
Target: Measured move projected downward
Best for: High volatility, news-driven markets, trend days.
Part 4: Complete Decision Matrix
Market Position: Between Lower Line 1 and Upper Line 1
Trade Type: Non-Directional
Entry: Sell Call at U1+1 and Sell Put at L1-1
Stop Loss: Close if Line 2 breached
Target: Premium decay
Market Position: Touches Lower Line 1
Trade Type: Reversal BUY
Entry: At L1 with bullish candle
Stop Loss: Lower Line 2
Target: Base
Market Position: Touches Upper Line 1
Trade Type: Reversal SELL
Entry: At U1 with bearish candle
Stop Loss: Upper Line 2
Target: Base
Market Position: Closes above Upper Line 2
Trade Type: Breakout BUY
Entry: Above U2
Stop Loss: Upper Line 1
Target: Measured move
Market Position: Closes below Lower Line 2
Trade Type: Breakout SELL
Entry: Below L2
Stop Loss: Lower Line 1
Target: Measured move
Part 5: Market Structure Mapping
How levels behave in different market conditions:
Low volatility / Range-bound: Levels tend to hold. Preferred strategy is Non-Directional.
Medium volatility / Trending: Levels act as pauses. Preferred strategy is Reversal from Line 1.
High volatility / Breakout: Levels may get breached. Preferred strategy is Breakout from Line 2.
Expiry week: Levels often act as magnets. Preferred strategies are Non-Directional and Reversal.
Event day (budget, RBI, FOMC): Levels may fail. Recommended to reduce size or wait.
Level interactions:
Bounce from Line 1 means level is respected. Action: Enter reversal.
Line 1 becomes support/resistance after breakout means level has flipped. Action: Trade in new direction.
Multiple touches at Line 1 without breach means level is strengthening. Action: Consider aggressive reversal.
Candle close beyond Line 2 suggests potential true breakout. Action: Consider breakout trade.
Part 6: Practical Application
To apply this system to your chart:
Look at the DTE levels displayed on your chart
Note the Base value
Note Upper Line 1 and Upper Line 2
Note Lower Line 1 and Lower Line 2
Identify where current price is trading relative to these levels
Use the decision matrix above to determine appropriate strategy
From the attached chart:
If current price is between L1 and U1, consider option selling.
If price touches L1 with bullish candle, consider reversal BUY.
If price touches U1 with bearish candle, consider reversal SELL.
If price is above U2, consider breakout BUY.
If price is below L2, consider breakout SELL.
Part 7: Risk Management Rules
Rule 1: Never risk more than 2% per trade for capital preservation.
Rule 2: Stop loss always at next level to remove subjectivity.
Rule 3: Take 50-70% profit on option selling to capture core decay.
Rule 4: No trades 30 minutes before or after major news to avoid volatility spikes.
Rule 5: Scale position size based on volatility - use smaller size in high VIX.
Part 8: Common Mistakes to Avoid
Mistake: Moving stop loss wider.
Correct Approach: Respect the next level.
Mistake: Entering reversal without candle confirmation.
Correct Approach: Wait for candle close beyond level.
Mistake: Selling options when market is at Line 2.
Correct Approach: Only sell when inside Line 1.
Mistake: Holding option selling for 100% profit.
Correct Approach: Take 50-70% and move on.
Mistake: Trading all three strategies simultaneously.
Correct Approach: Pick one based on market condition.
Part 9: Final Notes
This system is based on range probability concepts, not prediction. No strategy works 100% of the time. Consider backtesting before applying to live markets. Start with smaller position sizes. Maintain a trading journal for review. Education 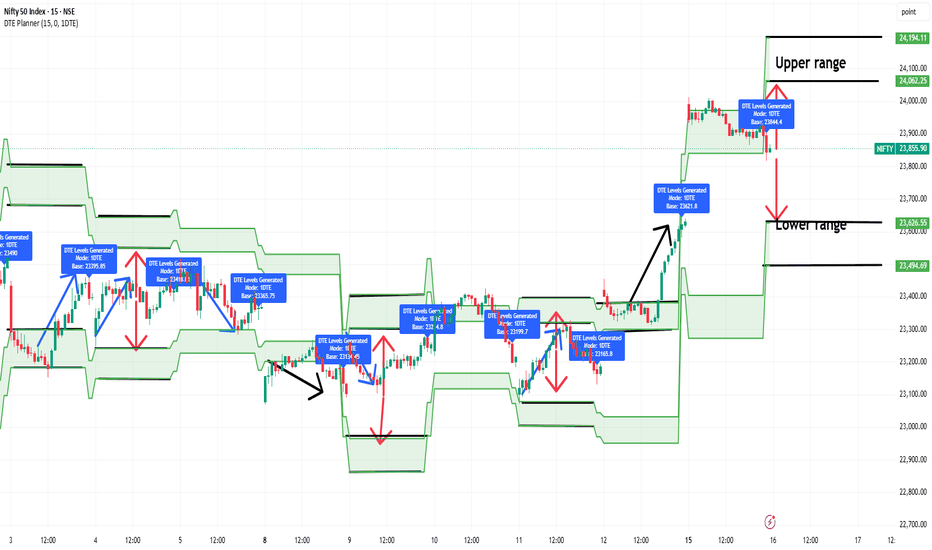
TRADE LIKE VIRAT KOHLI BATSTrade Like Virat Kohli Bats.
Not every ball deserves a shot. Not every candle deserves a trade.
Let me ask you something.
When Kohli walks into bat, does he swing at the very first ball? No. He watches it. He reads the pitch. He understands the bowler. He waits for the right delivery — and then he plays his shot with full conviction.
That is exactly how great traders approach the market.
The Cricket-Trading Parallels That Will Stick With You Forever:
1. You do not have to play every ball.
In cricket, leaving a ball outside off-stump is smart, not cowardly. In trading, skipping a mediocre setup is discipline, not weakness. Not trading is a position. A valid one.
2. One bad over will not end your innings.
Every batsman faces tough spells. Bumrah bowls three dots. You do not retire — you reset. In trading, a losing streak does not mean you quit. It means you reassess and come back stronger.
3. Consistency beats sixes every time.
Kohli's Test average is built on 40s and 50s, not only centuries. In trading, making steady 2-3% every month beats gambling for a 50% return and losing 60%.
4. Know when the pitch is against you.
On a sticky wicket, even Kohli plays cautiously. When the market is uncertain and choppy — reduce position size, tighten your game. Do not play your big shots in a thunderstorm.
5. The crowd noise does not change the game.
Kohli blocks out the noise and focuses on the ball. Twitter, YouTube gurus, WhatsApp tips — none of that is the ball. Your chart is the ball. Your plan is the bat. Everything else is crowd noise.
The next time you are about to jump into a random trade, ask yourself: "Is this the right ball to hit?"
If the answer is not a clear YES — leave it.
This post is intended for educational and informational purposes only and reflects a personal perspective on trading psychology and decision-making. Education 
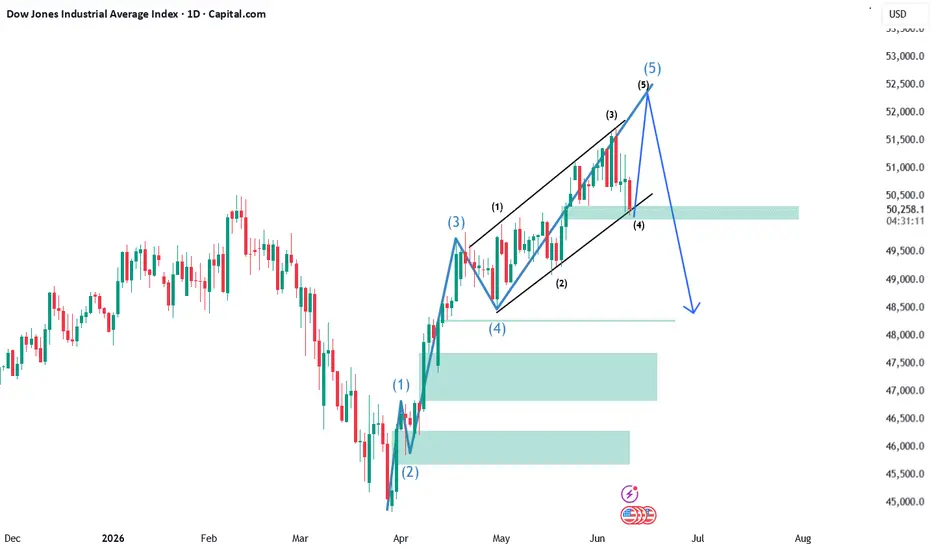
US 30 Bullish !!! Elliot Wave and Neo Wave PredictionDow Jones Industrial Average (DJIA) – Elliott Wave Analysis
The chart illustrates a bullish Elliott Wave structure that appears to be nearing completion within a larger impulsive advance. Following the sharp March 2026 decline that bottomed near the 45,000 region, the Dow Jones has staged a strong five-wave recovery.
Current Wave Structure
Wave (1) initiated the reversal from the March lows, signaling the end of the prior bearish phase.
Wave (2) completed as a corrective retracement, holding above the major low and confirming the new uptrend.
Wave (3) unfolded as the strongest and most extended rally, driving prices sharply higher toward the 49,500 zone.
Wave (4) formed a healthy correction, retracing a portion of Wave (3) while respecting key support near 48,500.
The market is currently progressing through Wave (5), which is developing inside an ascending channel and appears to be approaching its terminal phase.
Rising Channel Formation
The black parallel trendlines highlight a well-defined bullish channel containing the advance from Wave (1) onward. Price continues to respect both the upper and lower boundaries of this structure, indicating that buyers remain in control. However, the index is now approaching the upper channel resistance, where momentum exhaustion often occurs.
Key Resistance Zone
The projected Wave (5) target lies between 52,000 and 52,700, where:
The upper channel boundary converges.
The larger degree blue Wave (5) target is located.
Profit-taking pressure is likely to increase.
This region represents a potential completion area for the entire five-wave advance from the March lows.
Bearish Reversal Scenario
Once Wave (5) is completed, the chart suggests a significant corrective decline could begin. The projected blue path indicates:
Initial weakness below 50,500 support.
Breakdown of the ascending channel.
Acceleration toward the 48,500 area.
Potential continuation into deeper corrective territory.
Such a move would likely represent an ABC corrective phase following the completion of the impulsive five-wave structure.
Important Support Levels
50,200 – 50,300: Immediate support and highlighted demand zone.
48,500: Previous Wave (4) support and major structural level.
47,000 – 47,500: Strong demand zone from earlier accumulation.
46,000 – 46,300: Secondary support area if selling intensifies.
Outlook
The broader trend remains bullish while the index stays within the rising channel. However, the current structure suggests the Dow Jones is likely in the final stages of Wave (5), with upside potentially limited to the 52,500 region before a larger corrective decline unfolds. Traders should monitor the completion of the fifth wave and any breakdown below channel support as an early signal that a meaningful correction is underway.  Long
Long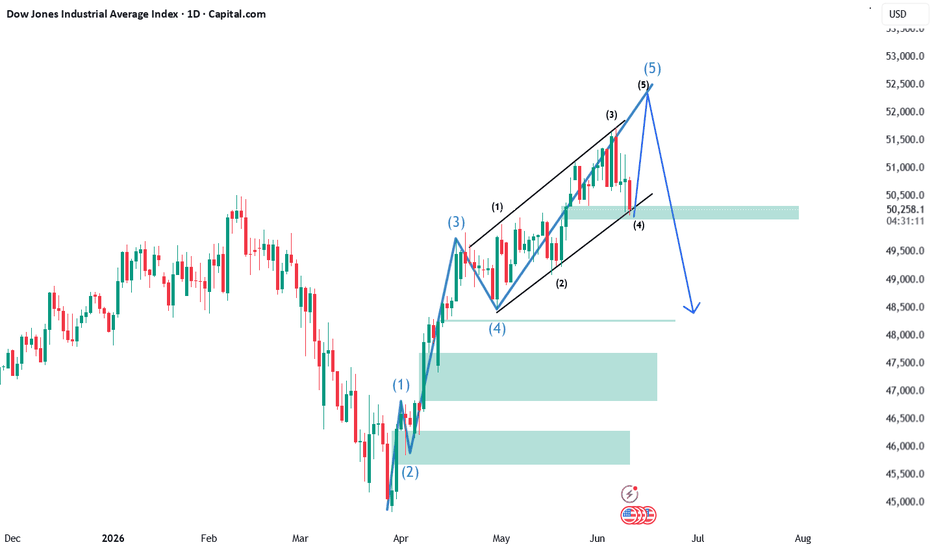
Nifty 50 – Smart Money Structure (1H)Here’s a concise trading idea you can share based on the Nifty 50 chart you uploaded:
---
Idea: Nifty 50 – Smart Money Structure (1H)
· Current Price: ~23,898 (+1.16%)
· Key Levels:
· Strong High: ~24,058
· Weak Low: ~23,000
· Structure:
· BOS (Break of Structure) to the upside confirmed earlier.
· CHoCH (Change of Character) near the bottom around 23,257, followed by a strong rally.
· Recently: Another CHoCH at ~23,558, now testing above the previous EQH (Equal High) around 23,939–23,970.
· Outlook:
· Sustaining above 23,900 could target the Strong High near 24,100.
· Failure to hold above 23,817 (EQH turned support) might see a retest of 23,639 or the Weak Low zone.
Trade setup:
· Bullish above 23,900, targeting 24,050–24,100.
· Stop below 23,800.
Let me know if you’d like this formatted for Twitter, TradingView, or a trading journal. @ss_capitals_36 🕉🧿 Short 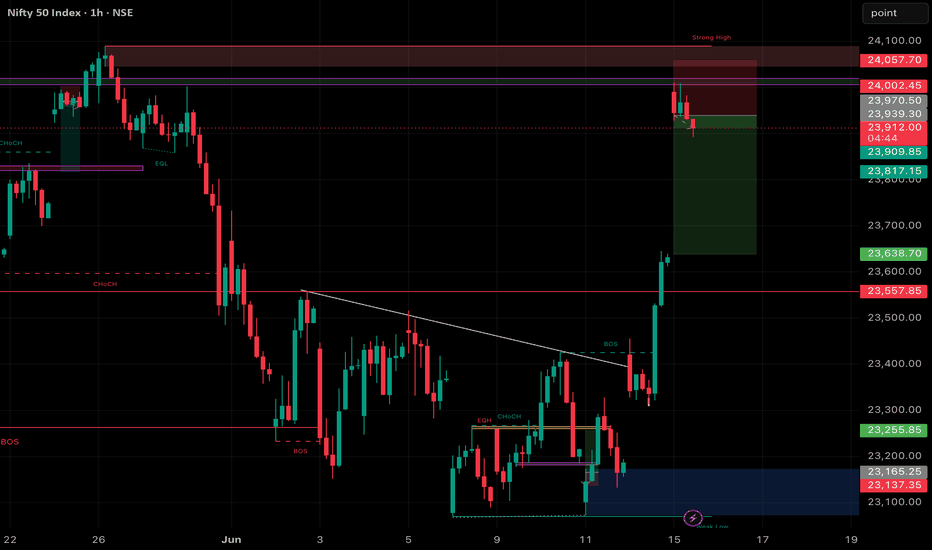
NIFTY ANALYSIS | MONDAY,15 JUNE 2026 | 4H → 1H → 15-MIN→5-MIN TF# 📊 📊 NIFTY ANALYSIS | MONDAY, 15 JUNE 2026 | 4H → 1H → 15-MIN → 5-MIN TF 🔥
## 🚨 FINAL VERDICT
### Market Bias
🟢 **Bullish**
### Institutional Summary
• Market Regime: Trend Continuation Bullish
• Market Control: Buyers
• Key Swing Resistance: 23,683 → 23,731 → 23,841
• Key Swing Support: 23,570 → 23,524 → 23,449
• Option Chain Bias: Put Writers Dominant
• Trader Action: Buy retracements, avoid chasing strength.
### Probability Matrix
🟢 Bullish: **65%**
🟡 Range Bound: **25%**
🔴 Bearish: **10%**
---
# 🟢 HIGH-PROBABILITY CE TRADE (PRIMARY)
### Setup Quality
⭐⭐⭐⭐⭐
### Probability
🟢 **65%**
### Trade Type
Bullish Continuation Pullback
### Entry Zone
**23,570 → 23,524**
(Daily Fib 23.6% - 38.2%)
### Fibonacci Confluence
✅ Daily Fib 23.6%
✅ Daily Fib 38.2%
✅ Previous Breakout Zone
✅ Price Acceptance Above 23,500
### OI Confluence
✅ Strong Put Writer Defense
✅ Institutions Positioned Higher
✅ Expiry Magnet Developing Near 24,000
### Stop Loss
**23,448**
(Daily Fib 61.8% Golden Pocket)
### Targets
🎯 T1: **23,731**
(Fib 127.2%)
🎯 T2: **23,841**
(Fib 161.8%)
🎯 T3: **23,964**
(Fib 200%)
🎯 T4: **24,160**
(Fib 261.8%)
### Risk Reward
⚖️ Approximately 1:3+
### Institutional Logic
The highest probability trade is not buying a breakout.
The highest probability trade is buying a retracement into Fibonacci support while the larger trend remains intact.
---
# 🔴 HIGH-PROBABILITY PE TRADE (CONTINGENCY)
### Setup Quality
⭐⭐
### Probability
🔴 **10%**
### Trade Type
Bullish Failure Breakdown
### Entry Trigger
**Below 23,395**
(Daily Fib 78.6%)
### Fibonacci Confluence
✅ Loss of 78.6%
✅ Loss of Golden Pocket
✅ Failure of Bullish Structure
### OI Confluence
Requires:
❌ Put Writer Exit
❌ Breakdown Acceptance
❌ Loss of Institutional Support
### Stop Loss
**23,486**
(Daily Fib 50%)
### Targets
🎯 T1: **23,327**
(Session Low)
🎯 T2: **23,250**
🎯 T3: **23,150**
### Institutional Logic
This trade is inactive unless buyers completely lose control.
Currently low probability.
---
# 📐 FIBONACCI CONFLUENCE ANALYSIS
## Swing Fibonacci (Institutional Bias)
Using:
High ≈ 24,060
Low ≈ 23,072
### Key Levels
| Fib | Level |
| ----- | ------ |
| 23.6% | 23,305 |
| 38.2% | 23,449 |
| 50.0% | 23,566 |
| 61.8% | 23,683 |
| 78.6% | 23,849 |
### Institutional Interpretation
Current Close:
**23,622.90**
Price sits between:
* Swing 50% = 23,566
* Swing 61.8% = 23,683
This is a critical institutional decision zone.
A sustained move above 23,683 strengthens the probability of a push toward 24,000.
---
## Daily Fibonacci (Execution Levels)
Using:
High = 23,645.35
Low = 23,326.95
### Retracement Levels
| Fib | Level |
| ----- | ------ |
| 23.6% | 23,570 |
| 38.2% | 23,524 |
| 50.0% | 23,486 |
| 61.8% | 23,449 |
| 78.6% | 23,395 |
### Golden Pocket
🟢 **23,438 - 23,449**
### Extension Levels
| Extension | Level |
| --------- | ------ |
| 127.2% | 23,731 |
| 161.8% | 23,841 |
| 200.0% | 23,964 |
| 261.8% | 24,160 |
---
# 🚨 INSTITUTIONAL DECISION MATRIX
## Market Regime
🟢 Trend Day Bullish
### Why?
✅ Strong bullish close
✅ Close near session high
✅ Higher High + Higher Low
✅ Strong recovery from prior weakness
✅ Buyers defended every meaningful dip
---
## Who Controls The Market?
🟢 Buyers
### Evidence
• Bullish daily candle
• Positive momentum
• Higher High Structure
• Price Acceptance Above 23,500
• Institutional Support Visible
---
## Option Writer Positioning
### Call Wall
24,000 CE
### Put Wall
24,000 PE
### Interpretation
The entire option chain is increasingly gravitating toward the 24,000 strike, creating a potential expiry magnet.
---
# 📈 4H TIMEFRAME ANALYSIS
### Trend
🟢 Bullish
### Swing Structure
Higher Highs
Higher Lows
### EMA Positioning
Bullish Alignment
### Momentum
Strong
### Institutional Interpretation
The primary trend remains upward.
---
# 📉 1H TIMEFRAME ANALYSIS
### Structure
Bullish Continuation
### Momentum
Positive
### Volume
Healthy
### Interpretation
Dips likely attract buyers.
---
# ⏱️ 15-MINUTE TRADE FRAMEWORK
## 🔴 Resistance
23,645
23,683
23,731
23,841
## 🟢 Support
23,570
23,524
23,449
23,395
### Trigger Zones
🟢 Bullish Trigger:
23,645
🔴 Bearish Trigger:
23,395
---
# ⚡ 5-MINUTE EXECUTION PLAN
## For CE Buyers
✔ Wait for retracement
✔ Fib support hold
✔ VWAP support
✔ Volume confirmation
---
## For PE Buyers
❌ No trade unless 23,395 breaks
---
## For Option Sellers
Prefer Put Selling above 23,500
---
# 📊 OPTION CHAIN ANALYSIS
### Market Message
Institutions remain positioned for higher prices.
### OI Interpretation
24,000 continues to act as the dominant strike.
### Writer Bias
🟢 Put Writers retain the edge.
---
# 🧠 MARKET PSYCHOLOGY
### Retail Behaviour
Chasing green candles after the strong Friday rally.
### Institutional Behaviour
Accumulating on retracements rather than chasing highs.
### Current Edge
🟢 Buyers
---
# 📌 TRADING DAY SCENARIOS
## Scenario 1 (Highest Probability)
### Probability
65%
### Trigger
Support holds above 23,524
### Targets
23,731 → 23,841 → 23,964
---
## Scenario 2
### Probability
25%
### Trigger
23,524 - 23,645
### Outcome
Range Consolidation
---
## Scenario 3
### Probability
10%
### Trigger
Below 23,395
### Targets
23,327 → 23,250 → 23,150
---
# 🚫 INVALIDATION LEVEL
### Entire Bullish Thesis Invalid Below
🔴 **23,395**
(Daily Fib 78.6%)
---
# 🔥 TRADER NOTE
The most important level for Monday is not the session high.
It is the **23,524 → 23,570 Fibonacci support cluster**.
Professional traders often make their money buying controlled retracements into support. Retail traders often make their losses buying extended candles after the move has already happened.
As long as NIFTY remains above **23,395**, the path of least resistance remains toward **23,731 → 23,841 → 23,964**, with **24,000** continuing to act as the dominant institutional magnet.
#mfi #moneyflowindex #tradingsignals #stockmarketindia #technicalanalysis #priceaction #daytrading #swingtrading #optiontrading #nifty50 #banknifty #volumeanalysis #momentumtrading #tradingstrategy #marketstructure #candlestick #supportandresistance #traderlife #marketanalysis
Long 
Long 
NIFTY 50 Intraday Outlook 15-06-2026NIFTY 50 Intraday Outlook | Range Breakout Setup 🎯
Nifty is currently consolidating inside a well-defined intraday range after the opening volatility.
📍 Resistance: 24,012
📍 Support: 23,928
📍 Current Price: ~23,970
The market is building energy for the next directional move. Until either side breaks, patience is the edge.
📈 Bullish Scenario
A sustained 5-minute close above 24,012 can trigger fresh momentum and short covering.
Long Entry: Above 24,012
Stop Loss: 23,970
🎯 Targets:
24,050
24,100
24,150
Trade Logic:
The 24,000 zone is acting as a psychological barrier. A breakout above the intraday high could invite aggressive buying and continuation toward higher levels.
📉 Bearish Scenario
A decisive 5-minute close below 23,928 would invalidate the range and signal weakness.
Short Entry: Below 23,928
Stop Loss: 23,960
🎯 Targets:
23,880
23,840
23,800
Trade Logic:
Failure to hold support may trigger long unwinding and accelerate downside momentum.
🔄 Support Bounce Setup
If Nifty revisits the 23,930–23,940 zone and forms a strong bullish candle pattern (Hammer / Bullish Engulfing), it can offer a low-risk buying opportunity.
Long Entry: 23,930–23,940 confirmation
Stop Loss: 23,910
🎯 Targets:
23,985
24,012
24,050
🎯 Options Traders
✅ Above 24,012 → Look for CE opportunities (ATM strikes preferred)
✅ Below 23,928 → Look for PE opportunities
⚠️ Avoid aggressive option buying while price remains trapped inside the range due to premium decay.
Patience pays. Wait for confirmation and let price come to your levels.
Trade what you see, not what you think. NIFTY KEY LEVELS FOR 15.06.2026NIFTY KEY LEVELS FOR 15.06.2026
Recommended Timeframe: 3 Minutes
If the candle stays above the pivot point, it is considered a bullish bias; if it remains below, it indicates a bearish bias. Price may reverse near Resistance 1 or Support 1. If it moves further, the next potential reversal zone is near Resistance 2 or Support 2. If these levels are also broken, we can expect the trend.
When a support or resistance level is broken, it often reverses its role; a broken resistance becomes the new support, and a broken support becomes the new resistance.
If the range(R2-S2) is narrow, the market may become volatile or trend strongly. If the range is wide, the market is more likely to remain sideways
Want to master this strategy and apply it to your daily trading? Reach out to me for details.
please like, comment and share my idea if you find it helpful
📢 Disclaimer
I am not a SEBI-registered financial adviser.
The information, views, and ideas shared here are purely for educational and informational purposes only. They are not intended as investment advice or a recommendation to buy, sell, or hold any financial instruments.
Please consult with your SEBI-registered financial advisor before making any trading or investment decisions.
Trading and investing in the stock market involves risk, and you should do your own research and analysis. You are solely responsible for any decisions made based on this research
S&P 500: Is the correction already over?After an impressive rally from the April lows, the S&P 500 has entered a period of consolidation rather than a full-scale reversal. Despite the recent pullback, the broader market structure remains constructive, and buyers continue to defend key support levels. The index remains the benchmark for global risk appetite, making its next move particularly important for investors across all asset classes.
From a fundamental perspective, market participants continue to focus on the trajectory of inflation, expectations regarding future Federal Reserve policy, and the resilience of corporate earnings. Stronger-than-expected economic data could support the bullish case, while renewed concerns over growth or monetary tightening may trigger another wave of volatility. The market is currently balancing optimism with caution.
From a technical standpoint, this analysis is based on the daily timeframe. Following the sharp advance from the spring lows, the index encountered resistance near the upper boundary of the rising structure and entered a corrective phase. However, instead of accelerating lower, price found demand within the 7,250–7,300 support zone and quickly recovered. The ability of buyers to defend this area suggests that the recent decline may represent a correction within a broader uptrend rather than the beginning of a deeper bearish move.
As long as the S&P 500 remains above the 7,250 support area, the primary scenario favors a continuation higher. The first upside target is located near 7,740, corresponding to the 0.382 Fibonacci level and the next significant resistance zone. A successful breakout above that area could pave the way toward 8,040, where the 0.618 Fibonacci extension may become the next major objective for the bulls.
The alternative scenario becomes relevant if the index loses the 7,250 support and establishes acceptance below it. Such a development would increase the probability of a deeper correction and force market participants to reassess the current bullish structure. Until that happens, buyers retain the strategic advantage.
In my opinion, the S&P 500 is approaching another critical decision point. The recent pullback has tested confidence, but it has not yet damaged the larger trend. If buyers continue to absorb selling pressure around support, the market may be preparing for the next leg higher. The reaction around the highlighted levels should provide valuable insight into the direction of the coming weeks.
This publication reflects my personal opinion and should not be considered investment advice.  Long
Long
BAKNIFTY : ADAM & EVE DOUBLE BOTTOMBANK NIFTY – Swing Structure Analysis
The chart structure is becoming very interesting here.
A clear Adam & Eve Double Bottom pattern is forming near the 52,500–53,000 zone, and now Bank Nifty is approaching the major breakout area around 55,500.
The entire move now depends on whether price can sustain above this zone.
----------------------------------------------------------------------------------------------------
Structure of the Pattern
1️⃣ First Bottom = “Adam”
This is the sharp V-shaped recovery.
In your chart:
Bank Nifty fell aggressively toward the 52,500–53,000 zone
Then immediately bounced sharply
This creates the first bottom.
Characteristics:
Fast panic selling
Sharp recovery
High volatility
2️⃣ Second Bottom = “Eve”
After the first recovery, price again comes near the same support zone, but this time forms a rounded, slower bottom.
In your chart:
Second dip was smoother and more controlled
Selling pressure reduced
Buyers started absorbing supply gradually
This creates the “Eve” portion.
Characteristics:
Rounded structure
Lower volatility
Accumulation phase
Neckline / Breakout Zone
🔥 55,500 Zone
This is why this level is extremely important.
A sustained breakout above it confirms:
Double bottom activation
Trend reversal continuation
Fresh momentum rally possibility
#NIFTY Intraday Support and Resistance Levels - 15/06/2026Nifty is expected to open with a strong gap-up bias near the 23950–24000 zone, supported by aggressive buying momentum in the previous session. The index has witnessed a sharp recovery from lower levels and is now approaching an important resistance zone, indicating strong bullish sentiment in the market.
For today's session, 24050 remains the key breakout level. A sustained move above 24050 can trigger fresh buying momentum towards 24150, 24200, and 24250+ levels. Traders can consider CE positions only after a confirmed breakout above this resistance zone.
The immediate support zone is placed around 23950–23900. As long as Nifty remains above this range, bulls are likely to maintain control. Any dip towards support levels may attract fresh buying interest.
On the downside, if Nifty fails to sustain above 23950 and slips below 23900, profit booking may emerge, dragging the index towards 23850, 23800, and 23750 levels. The 23750–23800 zone remains a strong support area and can provide a reversal buying opportunity if tested.
Overall, the trend remains strongly bullish with a gap-up opening expected near the 24000 level. Traders should focus on buy-on-dips opportunities and maintain a trailing stop-loss with partial profit booking at each target due to expected volatility around resistance zones. #BANKNIFTY Intraday PE & CE Levels(15/06/2026)Bank Nifty is expected to open with a gap-up bias near the 56850–56900 zone, supported by strong bullish momentum and a sharp upside rally in the previous session. The index has witnessed aggressive buying from lower levels and is now trading close to an important breakout area.
For today's session, 57050–57100 remains the immediate resistance zone. A sustained move above this level can trigger fresh buying momentum towards 57250, 57350, and 57450+ levels. If Bank Nifty manages to cross and sustain above 57550, the rally may extend further towards 57750, 57850, and 57950+ levels.
On the downside, 56950 is the key support level for intraday traders. Any weakness below 56950 may invite profit booking towards 56750, 56650, and 56550 levels. However, as long as the index remains above this support zone, the overall trend continues to favor the bulls.
Overall, the market structure remains strongly bullish with a gap-up opening expected. Traders should focus on buy-on-dips opportunities and maintain a trailing stop-loss, as volatility can increase near resistance levels. Partial profit booking at each target is recommended. Short