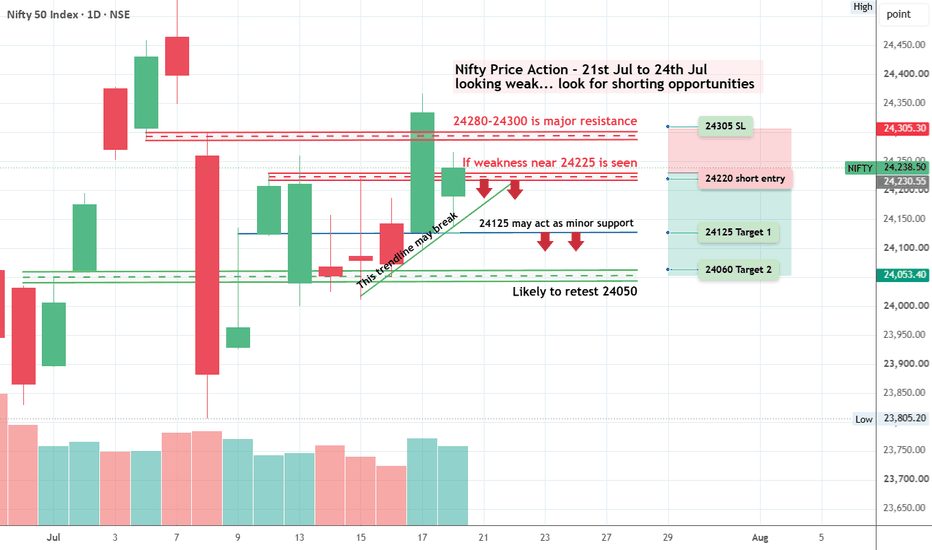
Nifty : Intraday Trading Plan: 22-Jul-2026
Welcome traders! 👋 Here is a detailed, professional trading plan for Nifty 50 for the upcoming session. We will analyze the chart structure to define our strategy for every possible opening scenario.
🎨 Chart Legend & Color Code
🟠 Orange Line/Box: No Trade Zone / Sideways Market / Caution Area.
🟢 Green Line/Box: Bullish Zone / Support / Long Side.
🔴 Red Line: Bearish Zone / Resistance / Short Side.
⚪ Dashed Line: Probable Trend (Maybe/Maybe Not) – Wait for confirmation!
📈 Overall Nifty Trend (Intraday)
Looking at the chart, Nifty is currently trading at 24,193.95. The market is in a consolidation phase after recent volatility.
Immediate Bias: Neutral to Slightly Bullish.
Key Observation: The price is sandwiched between the Opening Support (24,146) and Opening Resistance (24,230-24,251).
The "Green" Path: If buyers defend 24,146, we could see a solid move up towards 24,317 (Last Intraday Resistance) and potentially 24,375.
The "Red" Path: If sellers push price below 24,146, we might see a slide down to the 24,033-24,056 support zone.
🚀 Scenario 1: Gap Up Opening (100+ Points)
(Expected Open: ~24,295 - 24,300)
If the market gaps up by 100+ points, it will open very close to the Last Intraday Resistance (24,317) and well above the Opening Resistance Zone (24,230-24,251).
🔍 Analysis: A gap up of this magnitude often leads to profit booking. The price is entering the "Red Zone" (Resistance).
🟢 Bullish Action (Long): Do not chase the gap immediately. Wait for the price to sustain above 24,317 (Red Line). If a 15-min candle closes above this level, look for a move towards 24,375 (following the green dashed line).
🔴 Bearish Action (Short): If the price opens near 24,300 and shows rejection candles (Shooting Star, Bearish Engulfing) at 24,317, initiate a Short position. The target would be a gap fill down to 24,250.
🟠 No Trade: Avoid buying right at the open as the Risk:Reward ratio is poor near resistance.
⚖️ Scenario 2: Flat Opening
(Expected Open: ~24,180 - 24,210)
If the market opens flat, it opens right in the middle of the chart, between the Orange Line (24,146) and the Orange Box (24,230-24,251).
🔍 Analysis: This is the classic "Chop Zone". The market lacks direction initially.
🟠 No Trade Zone: The zone between 24,146 and 24,230 is your "Sideways" area. Trading here is dangerous for option buyers due to Theta decay.
🟢 Bullish Action (Long): Wait for a breakout above the Orange Box (24,251). Once confirmed, go Long with a target of 24,317.
🔴 Bearish Action (Short): Wait for a breakdown below the Orange Line (24,146). Once confirmed, go Short with a target of 24,056 (Green Box).
⚪ Dashed Line Logic: The red dashed line shows a potential drop from the resistance zone, while the green solid line shows a potential rise from support. Patience is key here!
📉 Scenario 3: Gap Down Opening (100+ Points)
(Expected Open: ~24,090 - 24,100)
If the market gaps down significantly, it opens below the Orange Line (24,146) and heads straight towards the Last Intraday Support (24,033-24,056).
🔍 Analysis: Panic selling might occur initially. The price is entering the "Green Box" (Strong Support).
🟢 Bullish Action (Long): Watch the 24,033-24,056 zone closely. If the price stabilizes here and forms a reversal pattern (like a Hammer), take a Long position for a bounce back to 24,146 (following the green dashed line up).
🔴 Bearish Action (Short): If the price crashes through 24,033 with high volume, the support has failed. Go Short (follow the trend down).
️ Caution: Gap downs often see a "Dead Cat Bounce". Don't short right at the support line; wait for a breakdown.
🛡️ Risk Management Tips for Options Trading
Trading options requires strict discipline. Here are some golden rules:
Stop Loss is Mandatory: Never trade without a Stop Loss (SL). For options, a 10-15% premium SL or a spot level SL (as mentioned above) is crucial.
🔹 Position Sizing: Never risk more than 2-5% of your total capital on a single trade. If you have ₹1 Lakh, don't lose more than ₹2,000-₹5,000 on one setup.
🔹 Avoid the "Orange Zone": If the market is sideways (Flat opening scenario), option buyers will lose money due to time decay (Theta). Stay out or trade very small quantities.
🔹 Trail Your SL: Once you are in profit, move your Stop Loss to your entry price (Cost-to-Cost). Protect your capital first!
🔹 Don't Average Losers: If a trade goes against you, exit. Do not add more quantity to a losing position hoping for a recovery.
Summary & Conclusion
To summarize the plan for 22-Jul-2026:
Trend: The market is range-bound. Watch 24,146 (Support) and 24,230-24,251 (Resistance).
Gap Up: Watch for rejection at 24,317 (Short) or breakout (Long to 24,375).
Flat: Stay out of the 24,146 - 24,230 zone (Orange/No Trade). Trade the breakout/breakdown only.
Gap Down: Watch for support at 24,033-24,056 (Long for bounce).
Conclusion: The chart suggests a battle between bulls and bears in the 24,146 - 24,251 range. The Orange zones indicate areas of confusion—avoid trading there. Wait for the market to pick a direction (Green or Red lines) before committing your capital. The dashed lines remind us that anything is possible, so always wait for candle confirmation! 📈📉
⚠️ Disclaimer:
I am not a SEBI registered analyst. This post is for educational purposes only. Trading in the stock market and F&O involves high risk and can lead to capital loss. Please consult your financial advisor before taking any trades. The charts and levels are based on technical analysis and probabilities, not guarantees. 🙏  Long
Long
DXY: Ready for the Next Leg? Flagpole Pattern!!The U.S. Dollar Index appears to be forming a Bull Flag after a strong impulsive rally.
A healthy trend rarely moves in a straight line. Strong markets often pause, consolidate, and absorb profit booking before attempting the next move. That's exactly what DXY is doing at the moment.
The initial rally formed the flagpole, reflecting strong buying momentum. Since then, price has been correcting inside a downward-sloping channel, creating the flag. This type of consolidation usually indicates that sellers are unable to reverse the trend, while buyers gradually absorb supply.
What's encouraging is that the entire correction is taking place above the previous breakout zone near 100, suggesting that former resistance is now acting as support. This is a constructive sign from a market structure perspective.
A decisive breakout above the flag would indicate that the correction is complete and could trigger the next leg higher. Until then, the pattern remains under development, and patience is essential.
This isn't just a Forex chart.
The next move in DXY can influence Gold, Silver, Crude Oil, USDINR, emerging markets, FII flows, and global equity indices.
Rather than predicting the direction, I'm simply identifying a high-probability structure and waiting for the market to confirm it.
Sometimes the best trades begin with a simple continuation pattern.  Long
Long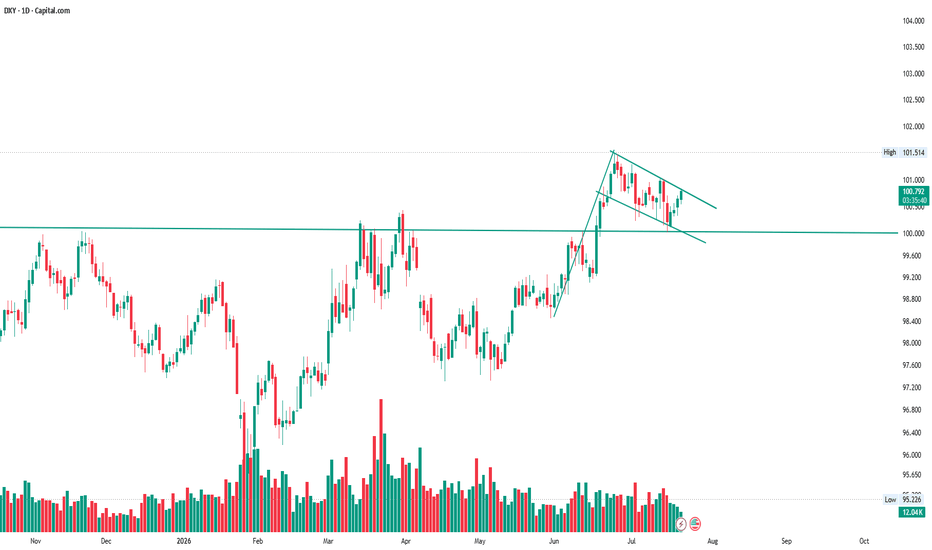
 Education


NIFTY DAILY / Short Range Level Analysis for 22nd Jul 2026🔕 SGMN SplD BULLISH Above => 24257.
🔕 SGMN SplD Bearish BELOW => 24122.
Mentioned analysis based on 2 consecutive candle close in 15 min Time Frame.
━━━━━🟥🟧🟨🟩🟦🟪⬛━━━━━
💥Level Interpretation / description:
✍🏻L#1: If the candle crossed & stays above the “Buy Gen”, it is treated / considered as Bullish bias. Cfm=> Confirmation.
L#2: Possibility / Probability of REVERSAL near 🔕RL/TF1 & 🔔RL/TF2
L#3: If the candle stays above “Sell Gen” but below “Buy Gen”, it is treated / considered as Sidewise. Aggressive Traders can take Long position near “Sell Gen” either retesting or crossed from Below & vice-versa i.e. can take Short position near “Buy Gen” either retesting or crossed downward from Above.
L#4: If the candle crossed & stays below the “Sell Gen”, it is treated / considered a Bearish bias.
L#5: Possibility / Probability of REVERSAL near 🔕RL/TF1 & 🔔RL/TF2
HZB (Buy side) & HZS (Sell side) => Hurdle Zone,
✍🏻 *** Specialty of “HZB#1, HZB#2 HZS#1 & HZS#2” is Sidewise (behaviour in Nature)
Rest Plotted and Mentioned on Chart
Color code Used:
Green, BLUE =. Positive bias.
Safron, RED =. Negative bias.
RED in Between Green means Trend Finder / Momentum Change
/ CYCLE Change and Vice Versa.
Notice One thing: HOW LEVELS are Working.
Use any Momentum Indicator / Oscillator or as you "USED to" to Take entry.
━━━━━🟥🟧🟨🟩🟦🟪⬛━━━━━
⚠️ DISCLAIMER:
The information, views, and ideas shared here are purely for educational and informational purposes only. They are not intended as investment advice or a recommendation to buy, sell, or hold any financial instruments. I am not a SEBI-registered financial adviser.
Trading and investing in the stock market involves risk, and you should do your own research and analysis. You are solely responsible for any decisions made based on this research.
"🔔As HARD EARNED MONEY IS YOUR's, So DECISION SHOULD HAVE TO BE YOUR's".
━━━━━🟥🟧🟨🟩🟦🟪⬛━━━━━
❇️ Follow notification about periodical View
💥 Do Comment for Stock WEEKLY Level Analysis.🚀
📊 Do you agree with this view?
✈️ HIT THE PLANE ICON if this technical observation resonates with you. It will Motivate me.
━━━━━🟥🟧🟨🟩🟦🟪⬛━━━━━
💡 If You LOOKING any CHART & want for Level and ANALYZE?
Share your desired stock names in the comments below! I will try to analyze the chart Levels, patterns and share my technical view (so far my Knowledge).
If Viewers think It can identify meaningful setups. Looking forward to hearing from all of you — let's keep this discussion going and help each other make better trading decisions.
___________🔕^^^⚫⚪^🙏🏼🙏🏼🙏🏼^⚪⚫^^^🔔___________ Daily Market Analysis: Nifty 50 Technical Outlook TodayExplore today's Nifty 50 daily market analysis with technical insights, key support and resistance levels, trend outlook, and educational market commentary.
Daily Market Analysis: Nifty 50 Technical Outlook, Key Levels & Market Trend
Welcome to today's Daily Market Analysis, where we examine the current technical structure of the Nifty 50 index using price action, trend analysis, support and resistance levels, and market momentum.
This analysis is intended for educational and informational purposes only. Financial markets are dynamic, and traders should always perform their own research and manage risk before making investment decisions.
Market Overview
The Indian equity market continues to trade within an important technical range as buyers and sellers remain active around key price levels. Recent sessions have shown balanced participation, indicating that market participants are waiting for confirmation before initiating aggressive positions.
Although the broader trend remains constructive, resistance zones continue to limit upside momentum. A decisive breakout or breakdown may determine the market's next directional move.
Current Market Trend
Overall Trend: Neutral to Mildly Bullish
Current price action suggests that Nifty is maintaining its higher-low structure on the daily timeframe while consolidating on lower timeframes. This type of consolidation often precedes a directional move; however, confirmation is essential before drawing conclusions.
Technical Analysis
From a technical perspective, the market continues to respect established support and resistance zones.
Several observations include:
Price is trading above important medium-term support.
Resistance remains active near recent swing highs.
Momentum indicators remain balanced without signaling extreme conditions.
Market participation suggests consolidation rather than trend reversal.
The current structure favors patience until price confirms the next breakout or breakdown.
Key Support Levels
The following support levels may attract buying interest if tested:
Immediate Support
Intraday Support
Short-Term Support
Major Swing Support
A sustained move below major support could indicate increasing selling pressure.
Key Resistance Levels
The following resistance zones remain important for traders to monitor:
Immediate Resistance
Near-Term Resistance
Swing Resistance
Major Resistance Zone
A convincing breakout above resistance may indicate strengthening bullish momentum.
Possible Market Scenarios
Bullish Scenario
If the index sustains above the immediate resistance zone with healthy participation, the market may attempt to extend its upward movement toward higher resistance levels.
Confirmation through price action and volume is generally considered more reliable than anticipating a breakout.
Range-Bound Scenario
Markets often spend time consolidating before making significant directional moves.
If the index continues trading between support and resistance, traders may experience:
Lower volatility
Stock-specific movement
Short-term trading opportunities
Frequent reversals near range boundaries
Bearish Scenario
If selling pressure increases and price closes below important support levels, market sentiment could weaken.
A confirmed breakdown may lead to additional downside movement toward the next technical support area.
Risk Management
Regardless of market direction, disciplined risk management remains one of the most important aspects of trading.
Consider following these general principles:
Trade only after confirmation.
Define your risk before entering a position.
Avoid emotional decision-making.
Maintain appropriate position sizing.
Review multiple timeframes before making trading decisions.
What Traders Should Watch
During the next trading session, market participants may monitor:
Opening price relative to previous close
Strength near support and resistance
Volume participation
Price action during the first trading hour
Global market sentiment
Sector performance
Institutional activity
These factors can provide additional context for understanding short-term market behavior.
Conclusion
Today's Daily Market Analysis suggests that Nifty remains in a consolidation phase within a broader constructive trend. The market is approaching important technical zones that may influence its next directional move.
Rather than predicting future prices with certainty, traders should focus on observing price action, respecting technical levels, and managing risk appropriately.
Consistent analysis, patience, and disciplined execution remain essential components of long-term trading success. Education 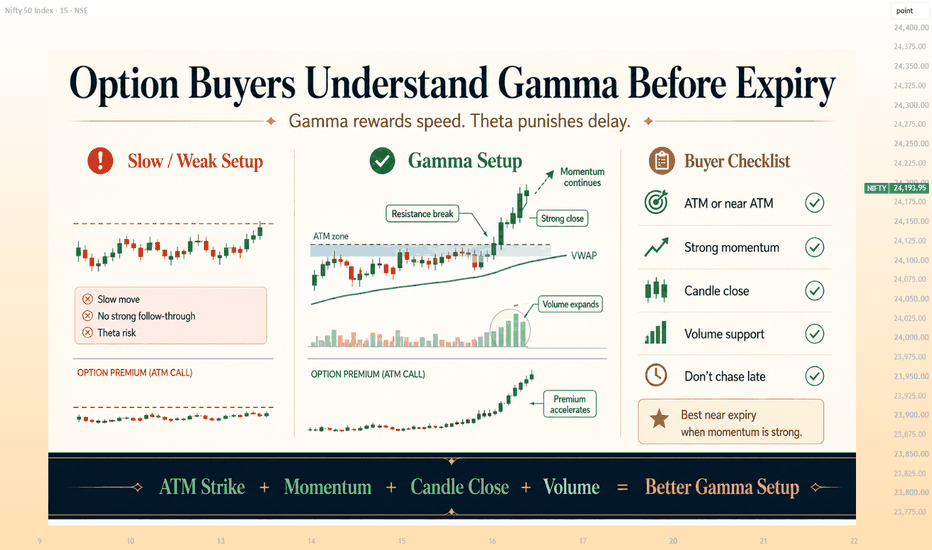
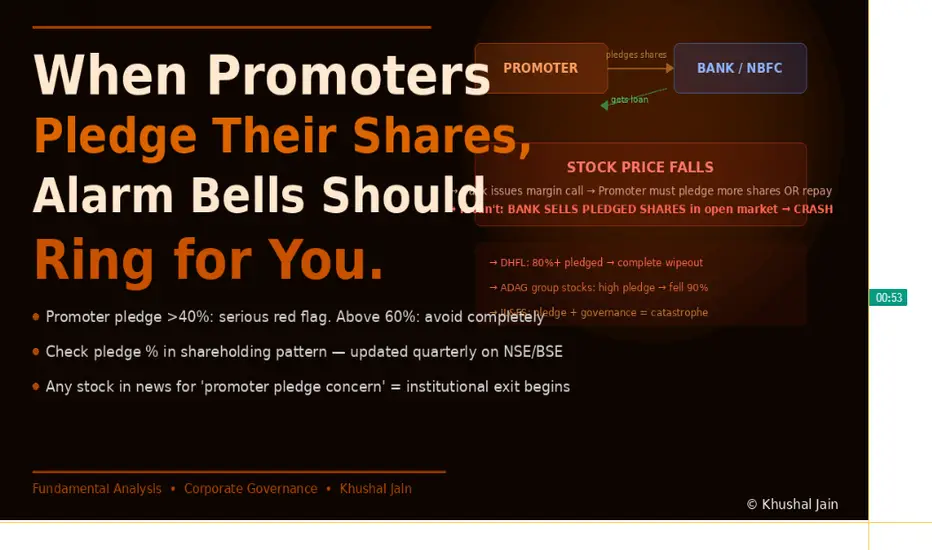
When Promoters Pledge Their Shares, Alarm Bells Should RingWhen Promoters Pledge Their Shares, You Should Be Getting Ready to Exit
Promoter pledging is hidden in plain sight in every quarterly shareholding report. Almost no retail investor checks it. It has preceded some of the biggest stock collapses in Indian market history.
The promoter of a company is its founder, controlling family, or original owner. They typically hold 40–75% of shares. When a promoter needs cash for personal reasons or business expansion but does not want to sell shares (which would signal confidence loss and trigger an immediate crash), they do something else: they pledge their shares to a bank as collateral for a loan.
This creates a time bomb inside the stock.
How the Pledge Trap Works — Step by Step
Step 1 — Promoter pledges shares:
Promoter holds 60% of a company at ₹500/share. Total holding value: ₹3,000 crore. They pledge 50% of their shares (₹1,500 crore of shares) to get a loan of ₹900 crore (typical 60% LTV).
Step 2 — Stock price falls:
For any reason — market correction, sector weakness, bad quarterly results — the stock falls from ₹500 to ₹380. The pledged shares are now worth ₹1,140 crore. The bank's LTV limit has been breached.
Step 3 — Margin call:
The bank issues a margin call: "Pledge more shares, or repay part of the loan." If the promoter has cash, they do so. If not — and often they do not, because they took the loan precisely because they needed cash — the bank moves to Step 4.
Step 4 — Bank sells in open market:
The bank begins selling the pledged shares in the open market to recover its loan. This selling pushes the stock price down further. Which triggers more margin calls. Which triggers more selling.
The downward spiral can be catastrophic and fast.
Real Indian Examples:
DHFL (2018–2019): Promoter pledge concerns triggered a crash from ₹690 to ₹17. Near-total wipeout.
Essel/Zee (2019): Promoter pledging concerns triggered a 50% crash.
ADAG group stocks (Reliance Comm, R-Power): High promoter pledge, cascading collateral calls, near-zero prices.
IL&FS: Complex pledge and debt structures contributed to system-wide NBFC crisis.
How to Check Promoter Pledge Instantly
Every quarter, companies file shareholding pattern data with NSE and BSE. This data is publicly available and shows:
Total promoter holding %
Pledged shares as a % of total promoter holding
Pledged shares as a % of total company shares
The Rules:
Pledge below 10%: Normal, no concern.
Pledge 10–40%: Monitor quarterly. Understand why.
Pledge above 40%: Serious yellow flag. Do extra due diligence.
Pledge above 60%: Significant risk. Most experienced investors avoid completely.
Pledge rising quarter-on-quarter: Danger signal regardless of absolute level.
Do you hold any stock in your portfolio where the Promoter Pledge is above 20%? Let’s analyze it together and see if it's sitting in the Red Flag Zone or if it's safe. Education 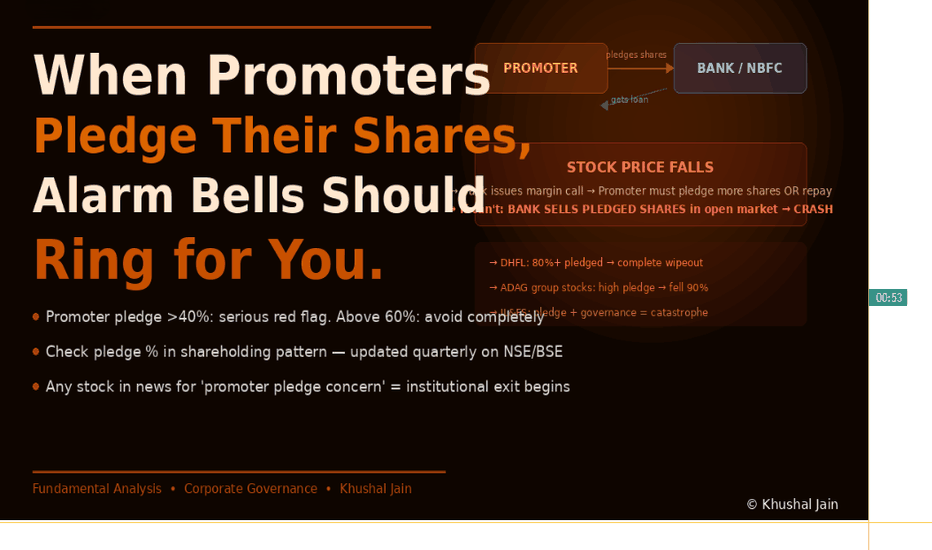
Education 
Short 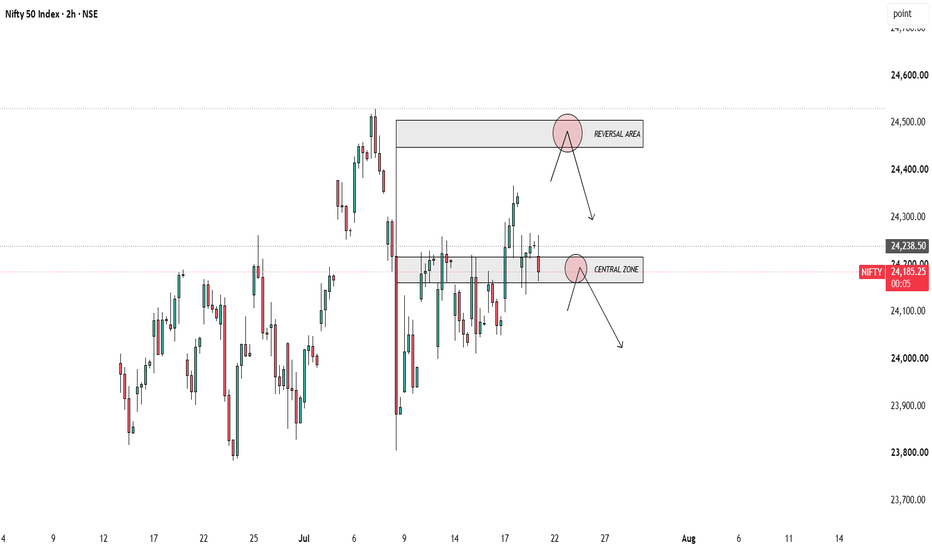
Short 
NIFTY: 24,200 Is the Battlefield. 24,250 Decides the Next Move.NIFTY: 24,200 Is the Battlefield. 24,250 Decides the Next Move.
I'm entering today's session with one level in mind—24,200.
On the daily chart, NIFTY is trading comfortably above the 20 SMA (24,106), 50 SMA (23,830) and 100 SMA (23,925), which keeps the broader trend constructive. However, the index is still below the 200 SMA (24,813), meaning the long-term trend has not turned bullish yet.
The daily pivot stands at 24,213.
- R1: 24,291
- R2: 24,344
- R3: 24,421
- S1: 24,161
- S2: 24,083
- S3: 24,031
Technically, the indicators are sending mixed signals:
- RSI (14): 55.58 – Positive but not overbought.
- MACD: -1.33 – Still bearish, showing momentum hasn't fully shifted.
- ADX: 10.19 – Weak trend, suggesting range-bound moves can continue until a breakout.
The option data also supports a balanced market. PCR for the current expiry is 1.38, indicating Put writers continue to dominate. However, a high PCR alone is not enough—it needs price confirmation.
On the 3-minute chart, buyers continue to defend higher lows, but the market is repeatedly stalling around 24,240–24,250. This makes 24,250 the immediate breakout level.
My trading plan is straightforward:
- Above 24,250: I expect momentum to improve, with room toward 24,291, 24,344, and potentially 24,421.
- Below 24,200: The intraday structure weakens. A sustained break below 24,200 could invite aggressive selling toward 24,160 and 24,080, where the next support zones lie.
📚 Trading Lesson
A market doesn't become bullish because indicators are green.
It becomes bullish when it starts holding above important price levels.
Today, 24,200 is support. 24,250 is confirmation. Until one of these levels decisively breaks, expect the market to respect this range more than predictions. Nifty Intraday Outlook for 21-07-2026NIFTY 15 Min Chart Reading
Overall Bias: 🟠 Neutral to Mildly Bearish (until key resistance is reclaimed)
Current Market Drivers
Rising crude oil prices and renewed Middle East geopolitical tensions are weighing on sentiment.
GIFT Nifty indicated a weaker start, while recent FII selling continues to pressure the market despite DII support.
Q1 earnings season is likely to increase stock-specific volatility rather than broad index strength.
NIFTY is trading near 24,239, holding above short-term support but still below immediate resistance.
The chart is showing sideways consolidation after recovery. Bulls need a clean breakout above 24,270 for fresh upside momentum.
__________________________________
Key Levels
Resistance: 24,270
Target 1: 24,360
Target 2: 24,470
Support: 24,230
Lower Target 1: 24,140
Lower Target 2: 24,050
__________________________________
Trade Plan
Bullish above 24,270
Targets: 24,320 / 24,360 / 24,470
Buy-on-dip near 24,230–24,200
Only if bullish rejection appears.
Bearish below 24,220
Targets: 24,180 / 24,141 / 24,049
__________________________________
View
NIFTY is not fully bullish yet.
Above 24,270 → buyers active
Below 24,220 → sellers active
Inside range → wait patiently
__________________________________
Educational view only. Trade with strict risk management. #NIFTY Intraday Support and Resistance Levels - 21/07/2026Nifty is expected to witness a flat opening with no major overnight triggers. The index is consolidating near the 24200–24250 support zone after the recent recovery, indicating that traders should wait for confirmation before taking fresh positions.
If Nifty sustains above 24250–24300 after the opening, traders can consider long positions with upside targets of 24350, 24400, and 24450. A decisive breakout above 24450 will confirm fresh bullish momentum and can extend the rally further.
On the downside, if Nifty fails to hold 24200 and slips below this support, traders can consider short positions with downside targets of 24150, 24100, and 24050. A sustained move below 24050 will strengthen the bearish bias and may lead to further selling pressure.
Overall, a flat opening is expected with range-bound trading likely during the initial session. As long as Nifty holds above the 24200–24250 support zone, buying on dips remains the preferred strategy. Traders should wait for confirmation near the opening range and maintain strict stop-losses while booking profits gradually at the mentioned target levels. #BANKNIFTY Intraday PE & CE Levels(21/07/2026)Bank Nifty is expected to witness a flat opening with no major overnight cues. The index is consolidating near the 57950–58050 zone after Friday's sharp rally, indicating a wait-and-watch approach before the next directional move. Traders should wait for confirmation around key support and resistance levels before initiating fresh positions.
If Bank Nifty sustains above 57550–57600 after the opening, traders can consider buying CE options with upside targets of 57750, 57850, and 57950. A decisive breakout above 58050 will confirm fresh bullish momentum and can extend the rally towards 58250, 58350, and 58450+.
On the downside, if Bank Nifty fails to hold the 57950–57900 resistance zone and shows rejection, traders can consider buying PE options with downside targets of 57750, 57650, and 57550. A breakdown below 57450 will further strengthen the bearish momentum and can drag the index towards 57250, 57150, and 57050.
Overall, a flat opening is expected with stock-specific action likely to dominate during the initial session. As long as Bank Nifty trades above the 57550–57600 support zone, buying on dips remains the preferred strategy. Traders should wait for confirmation near the opening range and maintain strict stop-losses while booking profits gradually at the mentioned target levels. Short