 Long
Long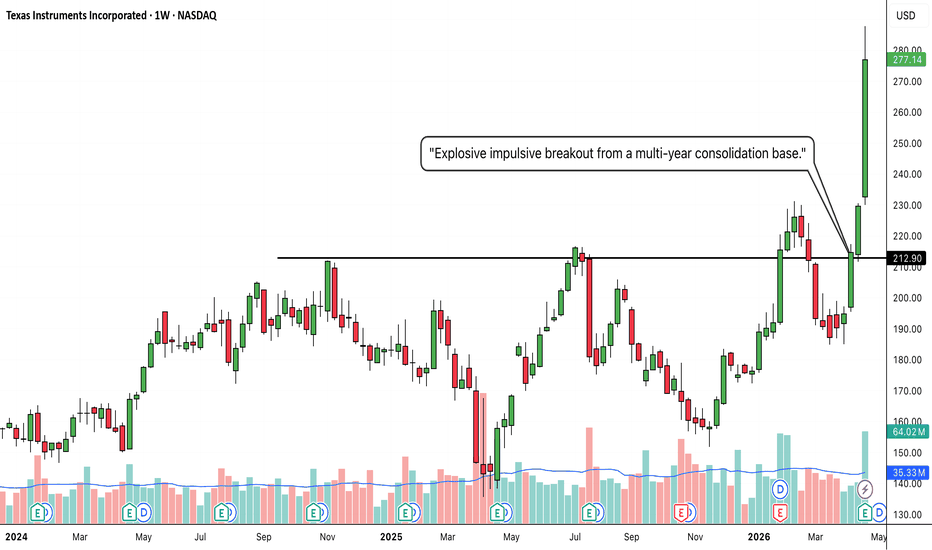
AMAT: Bullish Continuation and Decisive Breakout Above Key ResisThe Setup (Bias): I am taking a LONG bias on Applied Materials, Inc. (AMAT) on the weekly timeframe.
The "Why" (Technical Reasons): 1. Major Resistance Breakout: The price has forcefully broken out above the recent swing high, cleanly slicing through the established resistance level at $375.15 with a strong, full-bodied green weekly candle.
2. Textbook Stair-Step Trend: This breakout confirms a highly robust macro uptrend. Looking historically, the chart demonstrates a perfect pattern of breaking resistance levels and flipping them into solid support floors (as seen clearly at the $270.29 and $334.74 levels). This structural behavior indicates buyers are consistently in control.
Trade Plan (Entry & Exits): * Entry: Momentum traders can look for entries near the current market price of $417.04 to ride the immediate upside. A more conservative, lower-risk entry would involve placing limit orders to catch a potential pullback/retest of the $375.15 to $385.00 zone, waiting for that old ceiling to prove itself as a new floor.
Take Profit (Target): With the stock entering fresh price discovery and showing excellent relative strength, the next major psychological targets are $450.00, followed by the $500.00 milestone.
Stop Loss: Placed safely below the previous structural support step, around $325.00. A weekly close below the $334.74 base would indicate a breakdown in the current stair-step structure and invalidate the immediate bullish thesis.
Duration: Because this analysis is built on a 1-Week chart, this is a medium-to-longer-term swing trade designed to play out over the coming weeks to months.  Long
Long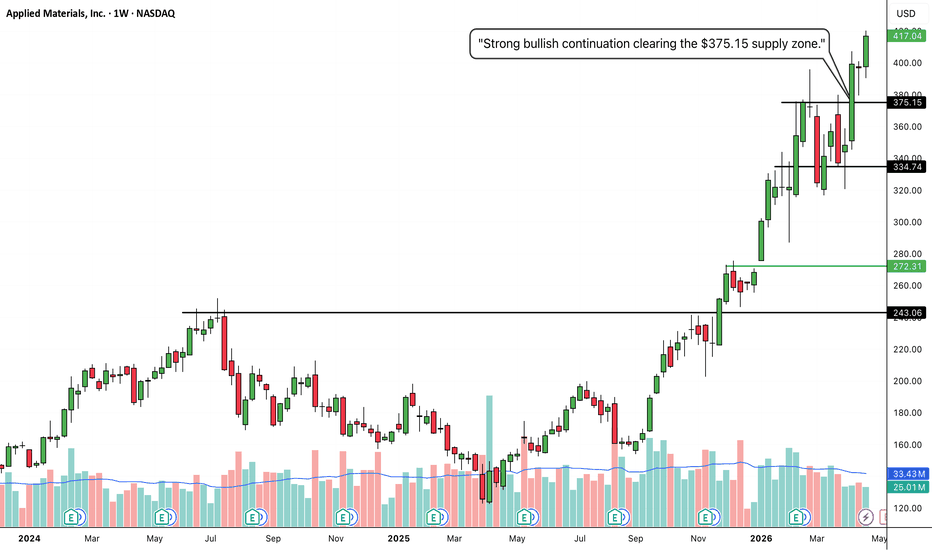
 Long
Long
NUE: Explosive Macro Breakout and Volatility ExpansionThe Setup (Bias): I am taking a LONG bias on Nucor Corporation (NUE) on the macro monthly (1M) timeframe.
The "Why" (Technical Reasons): 1. Historic Structural Breakout: Zooming out to the monthly timeframe reveals the true magnitude of this move. The price has forcefully broken out of a massive, multi-year consolidation base, cleanly slicing through the heavy macro resistance ceiling at 195.07 that has capped the stock for years.
2. Volatility Expansion: By applying Bollinger Bands, we can see a textbook volatility squeeze and subsequent expansion. The bands are opening up rapidly as the price rides the upper band, confirming that this breakout is backed by extreme momentum and aggressive institutional buying pressure.
Trade Plan (Entry & Exits): * Entry: Momentum and position traders can look for entries near the current extended market price of 225.11 to capture the aggressive phase transition. A safer, lower-risk approach would be waiting for the momentum to cool and placing limit orders to catch a potential monthly pullback to retest the 195.00 to 200.00 breakout zone, letting that old macro ceiling prove itself as a new floor.
Take Profit (Target): With the stock breaking out into fresh territory with this much monthly momentum, the trend can carry it significantly higher. The next major psychological targets are the 250.00 milestone, followed by 300.00.
Stop Loss: Placed safely below the middle of the recent monthly consolidation block, around the 160.00 level. A monthly close back below the 195.07 structural level would be an early warning sign of a failed macro breakout.
Duration: Because this analysis is built on a massive 1-Month chart capturing a macro trend continuation, this is a long-term position trade designed to play out over the coming months to years.  Long
Long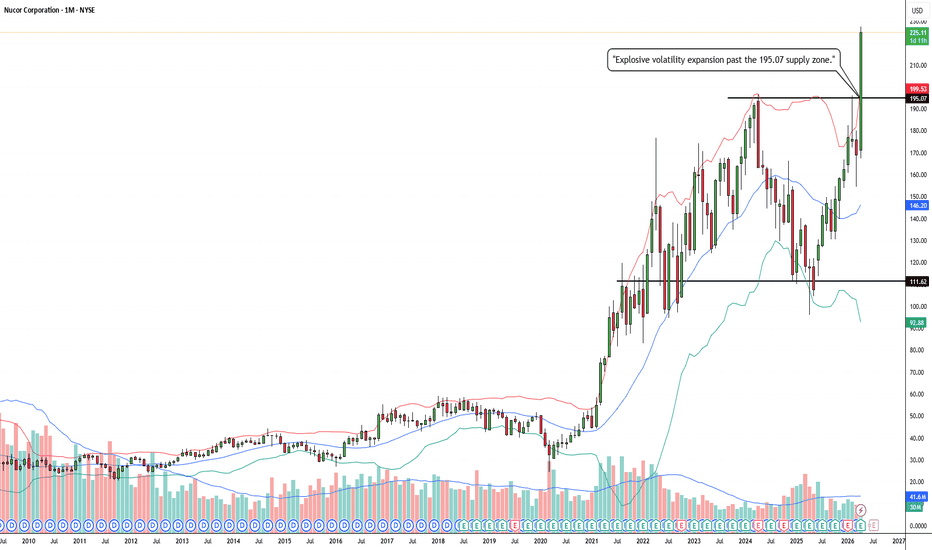
 Long
Long
ENLT: Explosive High-Tight Flag Breakout and Bullish ContinuatioThe Setup (Bias): I am taking a LONG bias on Enlight Renewable Energy Ltd. (ENLT) on the weekly timeframe.
The "Why" (Technical Reasons): 1. High-Tight Flag Breakout: After a truly historic, multi-month run originating from a massive base at 19.77, the stock entered a very healthy, tight consolidation phase. Instead of experiencing a deep correction, buyers defended the price at high levels, forming a "High Tight Flag." The price has now violently broken out above the 79.30 resistance ceiling of this flag, signaling that the next massive leg up has begun.
2. Bollinger Band Volatility Expansion: By looking at the Bollinger Bands, we can see the bands pinched tight during the recent consolidation. With this week's explosive green candle pushing the upper band outward again, we have clear confirmation of a volatility expansion. Momentum is back, and institutional buyers are aggressively stepping up.
Trade Plan (Entry & Exits): * Entry: Momentum traders can look for entries near the current extended market price around 88.78 to capture the immediate velocity of the breakout. A safer, lower-risk approach would be waiting for a potential minor pullback on a lower timeframe to retest the 79.30 to 82.00 zone, letting the old flag ceiling act as a new launchpad.
Take Profit (Target): With the stock breaking out of a high-level continuation pattern with this much relative strength, the immediate target is the major 100.00 psychological milestone. If momentum sustains, 110.00 to 120.00 is next.
Stop Loss: Placed safely below the bottom of the flag consolidation, around the 68.00 to 70.00 level. A weekly close back below the 79.30 structural level would be a warning sign that the breakout is stalling.
Duration: Because this analysis is built on a 1-Week chart capturing a high-momentum trend continuation, this is a medium-term swing trade designed to play out over the coming weeks.  Long
Long
 Long
Long
DLR: Impulsive Structural Breakout from Long-Term ConsolidationThe Setup (Bias): I am taking a LONG bias on Digital Realty Trust, Inc. (DLR) on the weekly timeframe.
The "Why" (Technical Reasons): 1. Major Range Breakout: After months of choppy consolidation, the price has forcefully broken out of its trading range, slicing through the heavy structural resistance at $187.77.
2. Extreme Bullish Momentum: The breakout candle is a massive, full-bodied weekly green candle closing near its absolute high. This indicates immense buyer demand and a complete lack of selling pressure at these new levels.
Trade Plan (Entry & Exits): 1. Entry: Momentum traders can enter near the current market price of $199.98. A more conservative, lower-risk entry would be placing limit orders to catch a potential retest of the $187.77 level, looking for that old resistance to act as new support.
2. Take Profit (Target): With the stock breaking into fresh territory, the next logical psychological targets are $220.00, followed by $230.00.
3. Stop Loss: Placed safely below the intermediate support level and breakout origin, around $175.00. A weekly close below this level would indicate a false breakout and invalidate the setup.
Duration: Because this analysis is built on a 1-Week chart, this is a longer-term swing trade designed to play out over the coming weeks to months.  Long
Long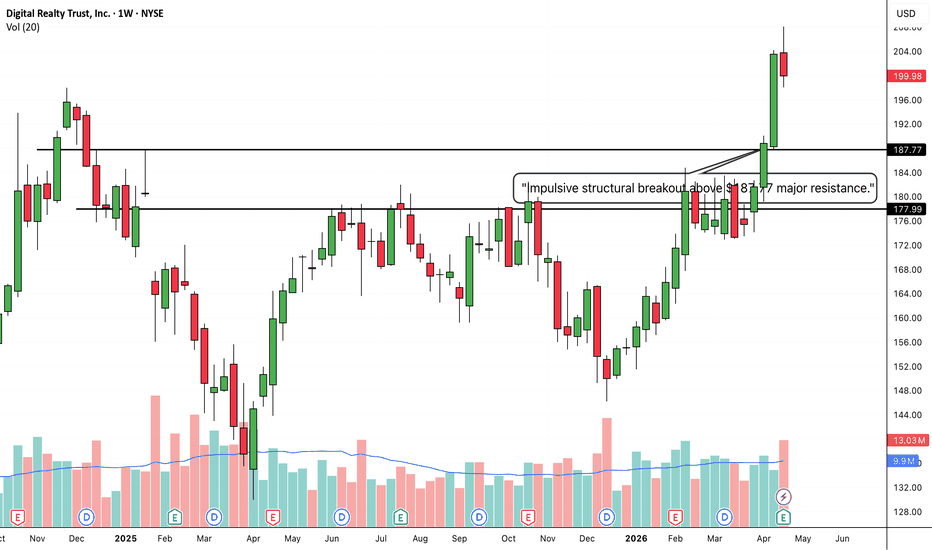
CSX: Stepping Up – Major Resistance Cleared for Trend ContinuatiThe Setup (Bias): I am taking a LONG bias on CSX Corporation (CSX) on the weekly timeframe.
The "Why" (Technical Reasons): 1. Secondary Breakout: The price has cleanly broken through the recent swing-high resistance at $43.11 with a strong, full-bodied weekly candle, indicating aggressive buyer momentum.
2. Textbook S/R Flip: Before this latest push, we saw the price break above the long-term historical resistance at $38.15, pull back to retest it, and bounce perfectly. That prior ceiling is now a confirmed floor, validating the structural strength of this uptrend.
Trade Plan (Entry & Exits): * Entry: Entering near the current market price of $45.41. A more conservative entry would be waiting for a minor daily pullback to retest the $43.11 level as new support.
Take Profit (Target): Riding the momentum into new territory, the next logical psychological targets are $50.00, followed by $55.00.
Stop Loss: Placed below the recent swing low and the previous breakout zone, around $39.50. If the price breaks back below the $40 psychological level, the current upward structure is broken.
Duration: Because this analysis is built on a 1-Week chart, this is a longer-term swing trade designed to play out over the coming weeks to a few months.  Long
Long
 Long
Long
ANET: Explosive Macro Breakout and High-Tight Flag Formation1. The Macro Perspective: Conquering the Ceiling
I am taking a LONG bias on Arista Networks, Inc. (ANET) on the daily (1D) timeframe.
When analyzing pure market structure, we have to respect major historical pivot points. Look at the black horizontal line at 160.91. Earlier in the chart, this level acted as a massive brick wall, aggressively rejecting the price and sending the stock into a deep, multi-month washout. However, the stock eventually found its footing, formed a series of higher lows, and methodically grinded its way right back up to the "scene of the crime."
2. The Educational Setup: The Power of the Breakout Candle
To understand why this setup is so bullish, look at how the price reacted when it finally reached 160.91 again:
No Hesitation: Often, stocks will form a "handle" or consolidate directly under major resistance before breaking out. ANET didn't even pause. It sliced through the 160.91 macro ceiling with a massive, full-bodied green expansion candle.
The Vacuum: When a stock breaks a major historical level with that kind of velocity, it triggers a massive short squeeze and forces sidelined institutional buyers to chase the price, creating a vacuum of upward momentum.
3. Current Price Action: The High-Tight Flag
Look at the most recent price action on the far right, currently trading near 172.62. After a massive explosive move, you expect profit-taking. However, instead of pulling all the way back to the 160.91 line, the stock is refusing to give up its gains. It is chopping sideways in a very tight, controlled range right at the absolute highs. This is a "High Tight Flag." It shows that buyers are happily absorbing any selling pressure at premium prices, storing kinetic energy for the next leg up.
4. The Trade Plan: Entries, Targets, and Risk Management
Entry Strategy: Momentum traders can look for an entry on a decisive daily close above the current tight flag consolidation (roughly above 175.00) to catch the immediate continuation. A safer, secondary strategy would be to place limit orders lower down, just in case the flag breaks downward to execute a standard "break and retest" of the 160.91 support floor.
Take Profit (Targets): Because the stock has shattered its macro resistance and is entering pure price discovery (blue sky territory), there is no historical supply to slow it down. The immediate psychological and measured targets are the 185.00 and 200.00 macro levels.
Invalidation (Stop Loss): A trade thesis is only valid if the market structure holds. For an entry on the flag breakout, a tight stop loss can be placed just below the flag's lower boundary (around 165.00). The ultimate invalidation for the macro thesis would be a definitive daily close completely back below the 160.91 line, which would signal a severe bull trap.
5. Time Horizon:
Because this technical setup is built on a 1-Day chart capturing a high-momentum breakout and flag consolidation, this is a short-to-medium-term swing trade designed to capture the immediate institutional markup phase. Let the trend run!  Long
Long
 Long
Long
 Long
Long
 Long
Long
 Long
Long
 Long
Long
 Short
Short
 Long
Long
 Long
Long
 Long
Long
 Long
Long


