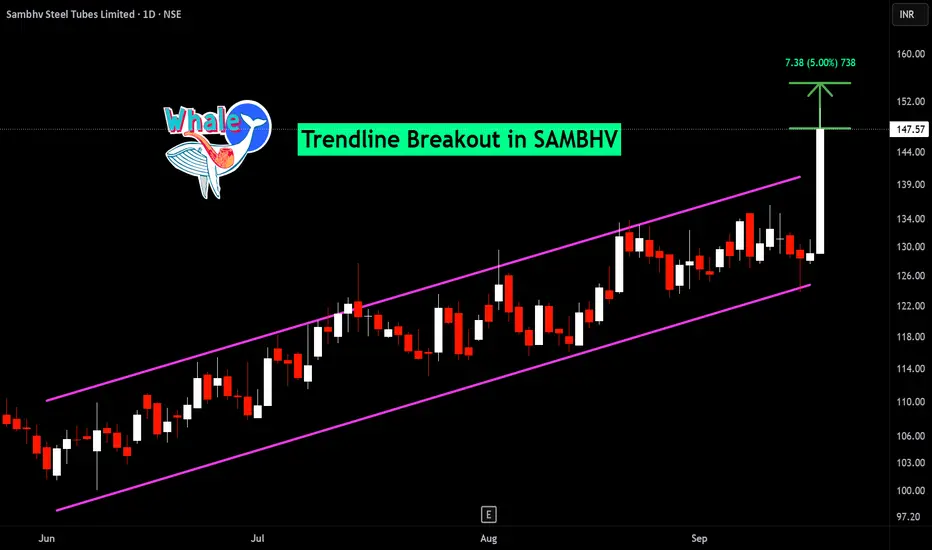
UNO MINDA - A GOOD BET ?We’ve seen a significant move in UNO Minda over the last couple of sessions. The move seems to have been supported by the company’s recent capex announcement, followed by investor meetings, which have brought fresh attention to the stock.
The chart is also showing good strength, with the recent move accompanied by higher volumes. This suggests that there could still be some room for further upside. That said, it’s important to keep an eye on the previous intraday highs around ₹1,297 (10th Aug) and ₹1,309 (1st Sept).
The 18th Sept candle was particularly strong — a solid bullish candle with virtually no upper wick and noticeably higher volumes. If the stock manages to sustain above the ₹1,309–₹1,320 zone, it could potentially trigger another leg of momentum.
For now, UNO Minda is definitely a stock worth keeping on the radar and watching closely around these resistance levels.
 Long
Long
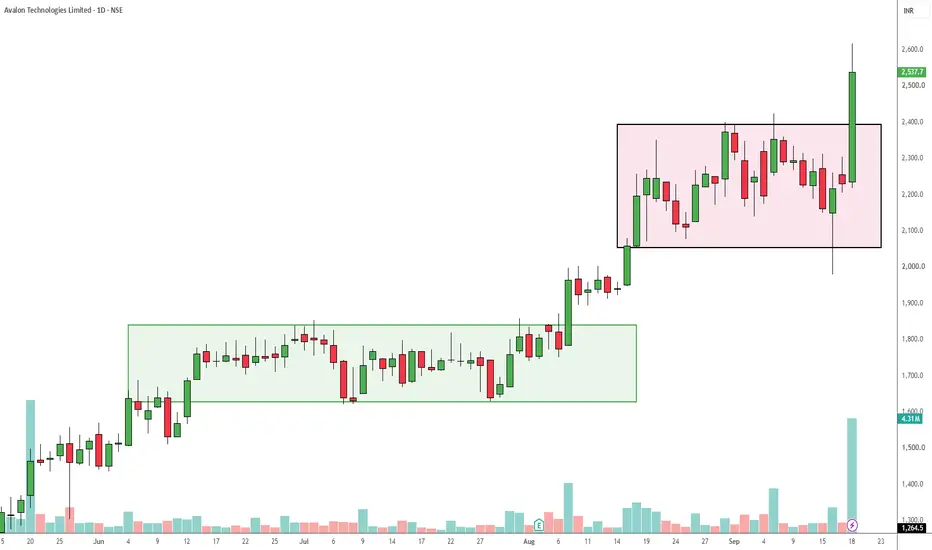
AVALON : Massive Volume Surge Following Secondary Consolidation.Chart Analysis:
The daily chart for Avalon Technologies Limited (NSE: AVALON) illustrates a classic multi-stage markup phase.
After an initial accumulation and breakout from the lower base (green box), the stock established a secondary consolidation range (pink box) roughly between the 2,050 and 2,400 levels.
In the most recent session, AVALON delivered a decisive bullish breakout above the 2,400 resistance level, gaining +13.80% to close at 2,537.7.
This price action is supported by a massive volume spike of 4.31M shares, which strongly validates the breakout's momentum and suggests heavy buying interest.
Trade Setup:
Entry Point: Entry can be considered near the Current Market Price (2,537.7) for aggressive momentum follow-through, or ideally on a pullback and retest of the previous resistance-turned-support level near 2,400 for a stronger risk-to-reward ratio.
Target: Based on the depth of the previous consolidation box (approximately 350 points from 2,050 to 2,400), an initial technical target is projected around 2,750.
A secondary psychological target sits at the 3,000 mark.
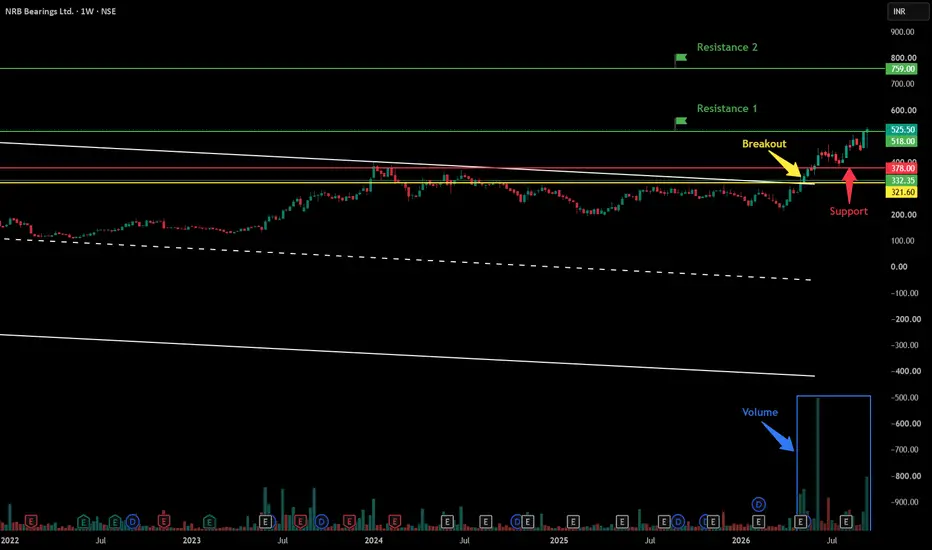
Stop Loss: To manage downside risk, a stop loss could be placed just below the breakout candle's low at 2,218.3 for tighter risk management, or below the primary consolidation support near 2,050 to allow the trade more room to breathe. Nrb Bearing Limited - Breakout Setup, Move is ON...#NRBBEARING trading above Resistance of 518
Next Resistance is at 759
Support is at 378
Here is previous chart:
This weekly chart for NRB Bearings Limited displays a strong bullish breakout from a consolidation pattern, supported by significant volume and long-term trendline context.
Chart Overview
Timeframe & Asset: NRB Bearings Ltd. (1-Week Chart, NSE).
Current Price: 525.50 INR (+2.11% change shown on the chart header).
Key Technical Observations
Horizontal & Channel Breakout: The stock consolidated within a downward-sloping mini-channel (white lines) and horizontal consolidation zone before breaking out above 321.60 INR, marked by the yellow Breakout arrow.
Volume Expansion: The blue arrow highlights a substantial surge in trading volume during the initial breakout phase, confirming strong institutional buying conviction.
Support Levels:
321.60 INR (Yellow Line): The horizontal level corresponding to the initial breakout point and dynamic base support.
378.00 INR (Red Line): A major horizontal level (marked with a red arrow) that previously acted as resistance before flipping to become the primary structural support level on subsequent pullbacks.
Resistance Levels:
Resistance 1 (518.00 INR): A structural resistance level (green line) that the current price candle has tested and breached to trade at 525.50 INR.
Resistance 2 (759.00 INR): The long-term upside projection level marked near the top green line.
Long-Term Trend Lines: The solid blue lines form a multi-year ascending channel that defines the macro uptrend, with the price currently advancing along the upper expansion zone above this channel.
Conclusion & Current Price Action
The current price action reflects strong bullish momentum following the volume-backed breakout above 321.60 INR and a successful retest of the 378.00 INR support zone. The stock has recently cleared its immediate hurdle at Resistance 1 (518.00 INR).
A sustained weekly close above this Resistance 1 zone indicates room for extended upside toward the long-term upside projection level of 759.00 INR (Resistance 2). On any potential pullbacks, the 378.00 INR level will serve as the primary line of defense for buyers to keep the structural uptrend intact.
A parallel channel (also known as an ascending, descending, or horizontal channel) is a technical analysis pattern bounded by two parallel trendlines that encompass a security’s price action over time.
Structure & Mechanics
Main Components:
Trendline / Base Line: Connects a series of prominent reaction lows (in an uptrend) or reaction highs (in a downtrend).
Channel Line: Drawn parallel to the trendline, connecting the peaks (top boundary) or troughs (bottom boundary).
Price Movement: Price oscillates between the upper boundary (which acts as dynamic resistance) and the lower boundary (which acts as dynamic support).
Types of Channels
Ascending Channel (Bullish): Characterized by higher highs and higher lows. Indicates a steady uptrend where buying pressure dominates.
Descending Channel (Bearish): Characterized by lower highs and lower lows. Represents a controlled downtrend or corrective pullback.
Horizontal Channel (Consolidation): Moving sideways between static support and resistance lines, signaling market indecision or range-bound trading.
How Traders Use Parallel Channels
Trading Within the Range: Buying near the channel's lower boundary (support) and selling or shorting near the upper boundary (resistance).
Breakout Trading: A strong, high-volume candle breaking outside either boundary signals potential trend acceleration or continuation in the direction of the breakout (as seen in the charts provided previously).
Midline (50% Line): Often, a dashed line is drawn down the middle of the channel. Price reacting to this midline can confirm the channel's validity and act as interim support or resistance.
Disclaimer: This is for demonstration and educational purpose only. This is not buying or selling recommendations. I am not SEBI registered financial advisor. Please consult your financial advisor before taking any trade.  Long
Long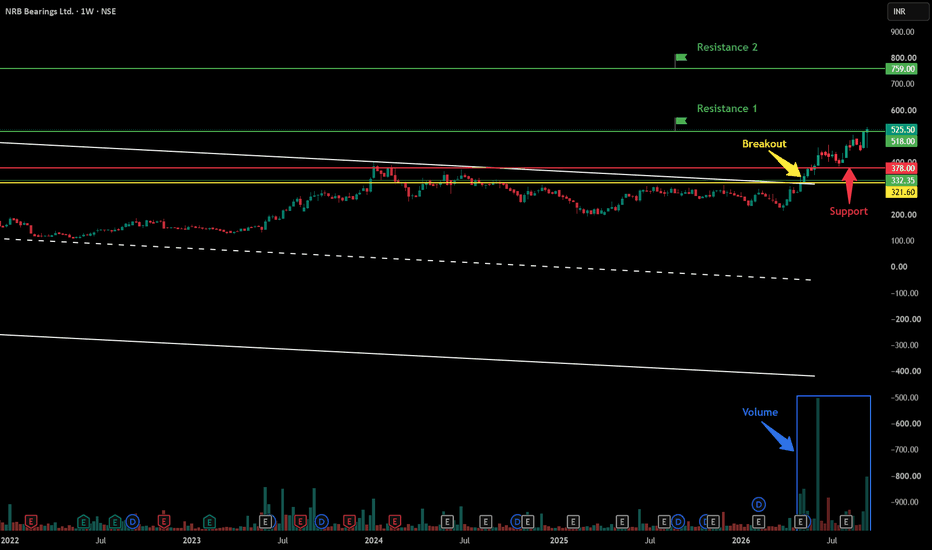
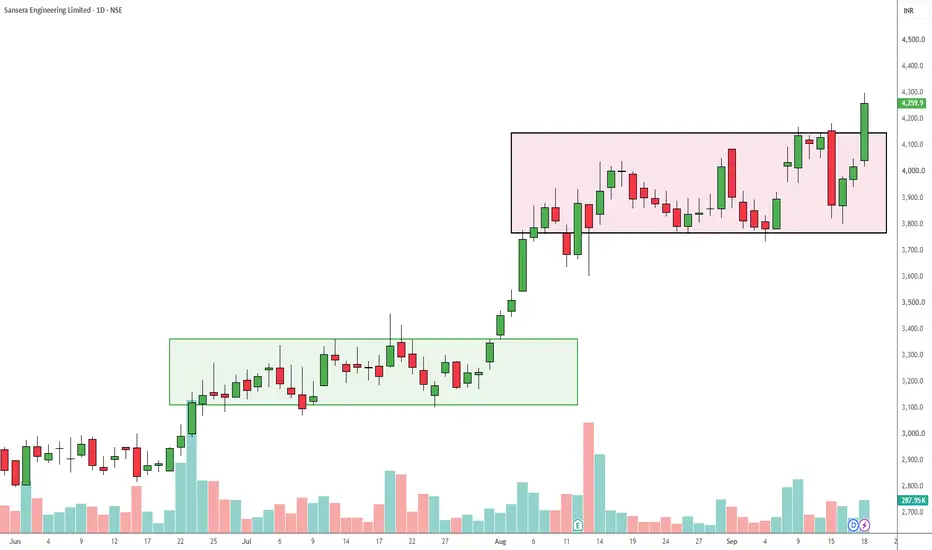
SANSERA : Powerful Breakout Signalling Trend Continuation.Based on the daily timeframe for Sansera Engineering Limited, the stock has just confirmed a strong breakout from a prolonged consolidation phase.
As seen in the provided chart, the stock previously exhibited a similar price action behavior:
It consolidated within a designated range (green box) before triggering a massive rally.
Recently, the price has been digesting those gains by trading sideways within a new, higher consolidation zone (pink box) with support near the 3,750 level and strong resistance around 4,150.
The most recent daily candle shows a highly bullish expansion, slicing through the upper boundary of the pink box and closing strongly around 4,259.9.
This volume-backed momentum suggests the accumulation phase is complete and the primary uptrend is resuming.
Here is the trade setup based on this technical breakout:
Entry Point: Current Market Price (~4,260) is valid for momentum traders, though a conservative approach would be to ladder entries or wait for a minor retest of the breakout level at 4,150.
Target: Using the measured move of the consolidation box (roughly 400 points from 3,750 to 4,150), projecting this upward from the breakout point gives a primary technical target of 4,550.
Stop Loss: A strict stop loss should be placed below the breakout candle's origin or the recent swing low inside the box, around 3,900.
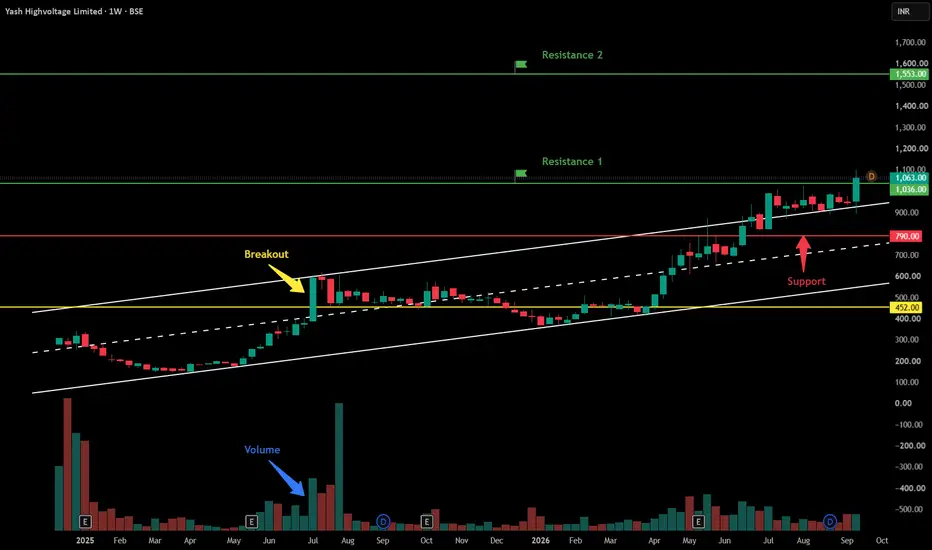
For a wider, structural stop loss to give the trade more breathing room, place it below the consolidation box support at 3,700. Yash Highvoltage Ltd - Breakout Setup, Move is ON...#YASHHV trading above Resistance of 1036
Next Resistance is at 1553
Support is at 790
Here is previous chart:
This weekly chart for Yash Highvoltage Limited displays a strong bullish breakout from a consolidation pattern, supported by significant volume and long-term trendline context.
Chart Overview
Timeframe & Asset: Yash Highvoltage Limited (1-Week Chart, BSE).
Current Price: 1,063.00 INR (+12.40% change shown on the chart header).
Key Technical Observations
Horizontal & Channel Breakout: The stock consolidated within an ascending channel (white lines) and horizontal consolidation zone before breaking out above 452.00 INR, marked by the yellow Breakout arrow.
Volume Expansion: The blue arrow highlights a substantial surge in trading volume during the initial breakout phase, confirming strong institutional buying conviction.
Support Levels:
452.00 INR (Yellow Line): The horizontal level corresponding to the initial breakout point and dynamic base support.
790.00 INR (Red Line): A major horizontal level (marked with a red arrow) that previously acted as resistance before flipping to become the primary structural support level on subsequent pullbacks.
Resistance Levels:
Resistance 1 (1,036.00 INR): A structural resistance level (green line) that the current price candle has tested and breached to trade at 1,063.00 INR.
Resistance 2 (1,553.00 INR): The long-term upside projection level marked near the top green line.
Long-Term Trend Lines: The solid white lines form an ascending channel that defines the macro uptrend, with the price currently advancing along the upper boundary zone.
Conclusion & Current Price Action
The current price action reflects strong bullish momentum following the volume-backed breakout above 452.00 INR and a successful retest of the 790.00 INR support zone. The stock has recently cleared its immediate hurdle at Resistance 1 (1,036.00 INR).
A sustained weekly close above this Resistance 1 zone indicates room for extended upside toward the long-term upside projection level of 1,553.00 INR (Resistance 2). On any potential pullbacks, the 790.00 INR level will serve as the primary line of defense for buyers to keep the structural uptrend intact.
A parallel channel (also known as an ascending, descending, or horizontal channel) is a technical analysis pattern bounded by two parallel trendlines that encompass a security’s price action over time.
Structure & Mechanics
Main Components:
Trendline / Base Line: Connects a series of prominent reaction lows (in an uptrend) or reaction highs (in a downtrend).
Channel Line: Drawn parallel to the trendline, connecting the peaks (top boundary) or troughs (bottom boundary).
Price Movement: Price oscillates between the upper boundary (which acts as dynamic resistance) and the lower boundary (which acts as dynamic support).
Types of Channels
Ascending Channel (Bullish): Characterized by higher highs and higher lows. Indicates a steady uptrend where buying pressure dominates.
Descending Channel (Bearish): Characterized by lower highs and lower lows. Represents a controlled downtrend or corrective pullback.
Horizontal Channel (Consolidation): Moving sideways between static support and resistance lines, signaling market indecision or range-bound trading.
How Traders Use Parallel Channels
Trading Within the Range: Buying near the channel's lower boundary (support) and selling or shorting near the upper boundary (resistance).
Breakout Trading: A strong, high-volume candle breaking outside either boundary signals potential trend acceleration or continuation in the direction of the breakout (as seen in the charts provided previously).
Midline (50% Line): Often, a dashed line is drawn down the middle of the channel. Price reacting to this midline can confirm the channel's validity and act as interim support or resistance.
Disclaimer: This is for demonstration and educational purpose only. This is not buying or selling recommendations. I am not SEBI registered financial advisor. Please consult your financial advisor before taking any trade.  Long
Long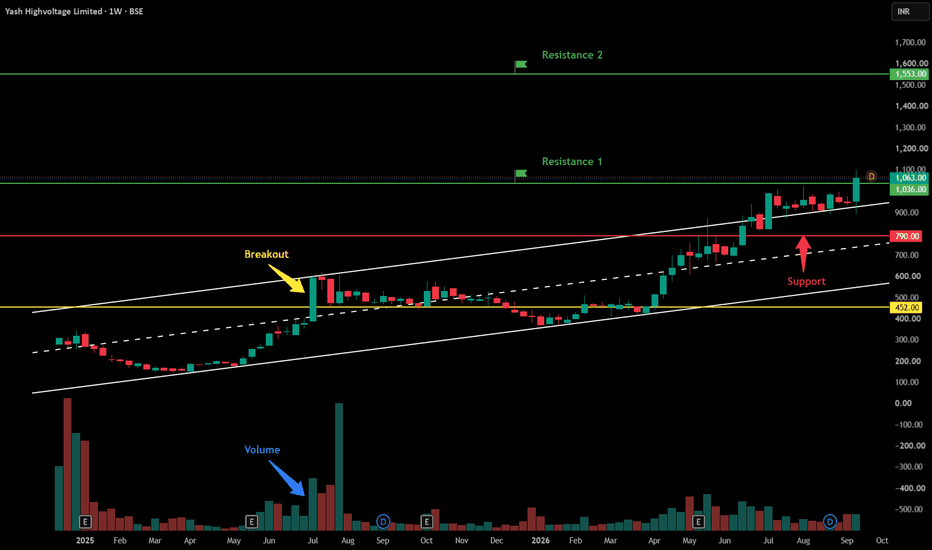
 Long
Long
Syrma SGS Technology Ltd - Breakout Setup, Move is ON...#SYRMA trading above Resistance of 1642
Next Resistance is at 2579
Support is at 1272
Here are previous charts:
This weekly chart for Syrma SGS Technology Limited displays a strong bullish breakout from a consolidation pattern, supported by significant volume and long-term trendline context.
Chart Overview
Timeframe & Asset: Syrma SGS Technology Limited (1-Week Chart, NSE).
Current Price: 1,728.90 INR (+8.78% change shown on the chart header).
Key Technical Observations
Horizontal & Channel Breakout: The stock consolidated within an ascending mini-channel (white lines) and horizontal consolidation zone before breaking out above 679.00 INR, marked by the yellow Breakout arrow.
Volume Expansion: The blue arrow highlights a substantial surge in trading volume during the initial breakout phase, confirming strong institutional buying conviction.
Support Levels:
679.00 INR (Yellow Line): The horizontal level corresponding to the initial breakout point and dynamic base support.
1,159.00 INR (Red Line): A major horizontal level (marked with a red arrow) that previously acted as resistance before flipping to become the primary structural support level on subsequent pullbacks.
Resistance Levels:
Resistance 1 (1,272.00 INR): A structural resistance level (green line) that the price previously interacted with during the consolidation phase.
Resistance 2 (1,642.00 INR): A structural resistance level (green line) that the current price candle has tested and breached to trade at 1,728.90 INR.
Resistance 3 (2,579.00 INR): The long-term upside projection level marked near the top green line.
Long-Term Trend Lines: The solid blue lines form a multi-year ascending channel that defines the macro uptrend, with the price currently advancing along the upper expansion zone above this channel.
Conclusion & Current Price Action
The current price action reflects strong bullish momentum following the volume-backed breakout above 679.00 INR and a successful retest of the 1,159.00 INR support zone. The stock has recently cleared its immediate hurdle at Resistance 2 (1,642.00 INR).
A sustained weekly close above this Resistance 2 zone indicates room for extended upside toward the long-term upside projection level of 2,579.00 INR (Resistance 3). On any potential pullbacks, the 1,159.00 INR level will serve as the primary line of defense for buyers to keep the structural uptrend intact.
A parallel channel (also known as an ascending, descending, or horizontal channel) is a technical analysis pattern bounded by two parallel trendlines that encompass a security’s price action over time.
Structure & Mechanics
Main Components:
Trendline / Base Line: Connects a series of prominent reaction lows (in an uptrend) or reaction highs (in a downtrend).
Channel Line: Drawn parallel to the trendline, connecting the peaks (top boundary) or troughs (bottom boundary).
Price Movement: Price oscillates between the upper boundary (which acts as dynamic resistance) and the lower boundary (which acts as dynamic support).
Types of Channels
Ascending Channel (Bullish): Characterized by higher highs and higher lows. Indicates a steady uptrend where buying pressure dominates.
Descending Channel (Bearish): Characterized by lower highs and lower lows. Represents a controlled downtrend or corrective pullback.
Horizontal Channel (Consolidation): Moving sideways between static support and resistance lines, signaling market indecision or range-bound trading.
How Traders Use Parallel Channels
Trading Within the Range: Buying near the channel's lower boundary (support) and selling or shorting near the upper boundary (resistance).
Breakout Trading: A strong, high-volume candle breaking outside either boundary signals potential trend acceleration or continuation in the direction of the breakout (as seen in the charts provided previously).
Midline (50% Line): Often, a dashed line is drawn down the middle of the channel. Price reacting to this midline can confirm the channel's validity and act as interim support or resistance.
Disclaimer: This is for demonstration and educational purpose only. This is not buying or selling recommendations. I am not SEBI registered financial advisor. Please consult your financial advisor before taking any trade.  Long
Long
Iol Chemicals & Pharmaceuticals Ltd - Breakout Setup, Move is ON#IOLCP trading above Resistance of 203
Next Resistance is at 265
Support is at 165
Here is previous chart:
This weekly chart for IOL Chemicals & Pharmaceuticals Limited displays a strong bullish breakout from a consolidation pattern, supported by significant volume and long-term trendline context.
Chart Overview
Timeframe & Asset: IOL Chemicals & Pharmaceuticals Ltd. (1-Week Chart, NSE).
Current Price: 203.15 INR (+4.55% change shown on the chart header).
Key Technical Observations
Horizontal & Channel Breakout: The stock consolidated within a downward-sloping mini-channel (white lines) and horizontal consolidation zone before breaking out above 104.00 INR, marked by the yellow Breakout arrow.
Volume Expansion: The blue arrow highlights a substantial surge in trading volume during the initial breakout phase, confirming strong institutional buying conviction.
Support Levels:
104.00 INR (Yellow Line): The horizontal level corresponding to the initial breakout point and dynamic base support.
165.00 INR (Red Line): A major horizontal level (marked with a red arrow) that previously acted as resistance before flipping to become the primary structural support level on subsequent pullbacks.
Resistance Levels:
Resistance 1 (203.00 INR): A structural resistance level (green line) that the current price candle has tested and breached to trade at 203.15 INR.
Resistance 2 (265.00 INR): The long-term upside projection level marked near the top green line.
Long-Term Trend Lines: The solid blue lines form a multi-year ascending channel that defines the macro uptrend, with the price currently advancing along the upper expansion zone above this channel.
Conclusion & Current Price Action
The current price action reflects strong bullish momentum following the volume-backed breakout above 104.00 INR and a successful retest of the 165.00 INR support zone. The stock has recently cleared its immediate hurdle at Resistance 1 (203.00 INR).
A sustained weekly close above this Resistance 1 zone indicates room for extended upside toward the long-term upside projection level of 265.00 INR (Resistance 2). On any potential pullbacks, the 165.00 INR level will serve as the primary line of defense for buyers to keep the structural uptrend intact.
A parallel channel (also known as an ascending, descending, or horizontal channel) is a technical analysis pattern bounded by two parallel trendlines that encompass a security’s price action over time.
Structure & Mechanics
Main Components:
Trendline / Base Line: Connects a series of prominent reaction lows (in an uptrend) or reaction highs (in a downtrend).
Channel Line: Drawn parallel to the trendline, connecting the peaks (top boundary) or troughs (bottom boundary).
Price Movement: Price oscillates between the upper boundary (which acts as dynamic resistance) and the lower boundary (which acts as dynamic support).
Types of Channels
Ascending Channel (Bullish): Characterized by higher highs and higher lows. Indicates a steady uptrend where buying pressure dominates.
Descending Channel (Bearish): Characterized by lower highs and lower lows. Represents a controlled downtrend or corrective pullback.
Horizontal Channel (Consolidation): Moving sideways between static support and resistance lines, signaling market indecision or range-bound trading.
How Traders Use Parallel Channels
Trading Within the Range: Buying near the channel's lower boundary (support) and selling or shorting near the upper boundary (resistance).
Breakout Trading: A strong, high-volume candle breaking outside either boundary signals potential trend acceleration or continuation in the direction of the breakout (as seen in the charts provided previously).
Midline (50% Line): Often, a dashed line is drawn down the middle of the channel. Price reacting to this midline can confirm the channel's validity and act as interim support or resistance.
Disclaimer: This is for demonstration and educational purpose only. This is not buying or selling recommendations. I am not SEBI registered financial advisor. Please consult your financial advisor before taking any trade.  Long
Long
MACPOWER : Weekly Consolidation Breakout Signalling ContinuationOn the weekly timeframe, Macpower CNC Machines Limited is exhibiting strong bullish price action.
The stock previously broke out above a major long-term resistance level at 1,736.6 (marked by the green horizontal line).
Instead of reversing, the price consolidated beautifully above this newly formed support, creating a tight rectangular continuation pattern (highlighted by the pink box) between the 1,800 and 2,050 zones.
This week's price action shows a definitive breakout from this consolidation phase, characterized by a strong bullish marubozu-style candle closing near its highs at 2,104.5 with a 14.19% gain.
The combination of a prior structural breakout, healthy consolidation, and a subsequent momentum breakout suggests that the stock is ready for its next upward leg in price discovery. The volume profile also supports the upward momentum.
Trade Setup:
Entry Point: Current Market Price around 2,104, or on a slight pullback/retest of the consolidation box top near 2,050.
Target:
TP1: 2,350 (Based on the measured move of the 250-point consolidation box projected upwards).
TP2: 2,500 (Psychological round number in uncharted territory).
Stop Loss: 1,790 (A weekly close below the pink consolidation box and the psychological 1,800 mark invalidates the immediate bullish continuation setup). ACE : Strong Bullish Breakout Above Resistance.Directional Bias: Long
Technical Analysis & Reasoning:
The daily chart for Action Construction Equipment Limited presents a compelling long setup based on a clear technical breakout.
Horizontal Resistance Breakout: Price action has decisively broken above the key overhead resistance line at 1,191.1 INR. This level previously acted as a ceiling for the price, and breaking it indicates a strong shift in market momentum.
Bullish Price Action: The stock is maintaining a steady uptrend characterized by consistent higher highs and higher lows since June. The current daily candle is strongly bullish, trading around 1,229.2 INR (+1.96%), showing strong conviction from buyers following the breakout.
Volume Support: The recent upward price action and breakout are accompanied by visible volume clusters at the bottom of the chart, validating the move and suggesting broad market participation.
Trade Idea & Levels:
Entry: Scaling in near the current price of 1,229 INR, or waiting for a potential minor pullback to retest the 1,191.1 INR level (previous resistance turning into new support).
Stop-Loss: A daily close below the recent consolidation zone (around the 1,140–1,150 INR level) to protect capital against a false breakout scenario.
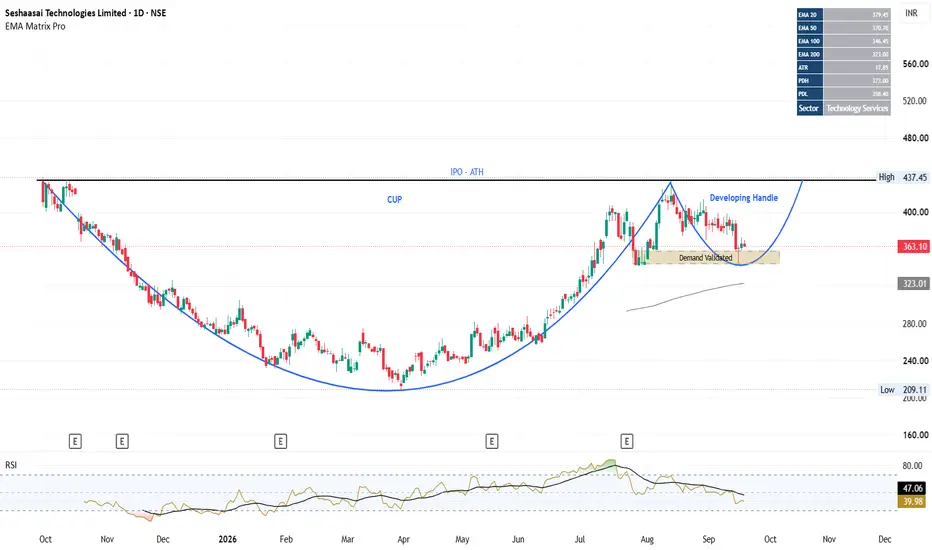
Target: As the stock is clearing major resistance, traders can utilize trailing stops to ride the upward momentum or target psychological round numbers (like 1,300 INR) depending on individual risk-reward preferences. STYL : Cup & Handle Taking Shape — Demand Zone HoldsSeshaasai Technologies Ltd. NSE:STYL is developing an interesting Cup & Handle structure on the daily chart, with the handle currently testing an important demand/confluence area.
Key Observations :
1. Cup formation: After the post-listing decline, price formed a broad base and recovered toward the IPO/major high zone around ₹433–437, completing the larger cup structure.
2. Supply reaction: The first attempt near the previous high was rejected, followed by another pullback. This indicates that the ₹433–437 area remains the major supply/resistance zone.
3. Handle development: The subsequent decline has so far held the ₹343–358 demand zone, which is close to the lower portion of the developing handle.
4. EMA confluence: The demand area is supported by the 100 EMA around ₹346.5, while the 50 EMA around ₹370.8 is currently acting as an intermediate dynamic level.
5. Momentum: RSI has cooled from the previous overbought region and is now around the neutral zone. This gives the handle room to develop without the stock remaining excessively extended.
Trade Plan:
Trigger:
A sustained move above ₹394 and RSI above 50 can be treated as a confirmation of the developing handle breakout / short-term structure reversal.
Upside levels:
₹437–438: Major resistance / previous high
Above ₹437–438: price discovery becomes possible, subject to breakout strength and volume.
Invalidation:
A decisive breakdown below the ₹343–358 demand zone, particularly a daily close below the lower boundary, would weaken the current Cup & Handle thesis.
Risk management:
Rather than entering solely because price is inside the demand zone, the cleaner setup is to wait for price confirmation above ₹394, preferably accompanied by expanding volume. Position size should be calculated according to the predefined risk per trade.
Important technical distinction:
₹394 does not validate the demand zone itself. It validates the handle/recovery structure. The demand-zone thesis is already supported by the reaction from ₹343–358; ₹394 is the potential confirmation trigger.
------------------------------------------------------------------------------------------------------------
Disclaimer: This is a personal technical-market observation for educational/informational purposes and is not investment advice. I am not a SEBI-registered investment adviser/research analyst. Please conduct your own research and manage risk according to your individual circumstances.  Long
Long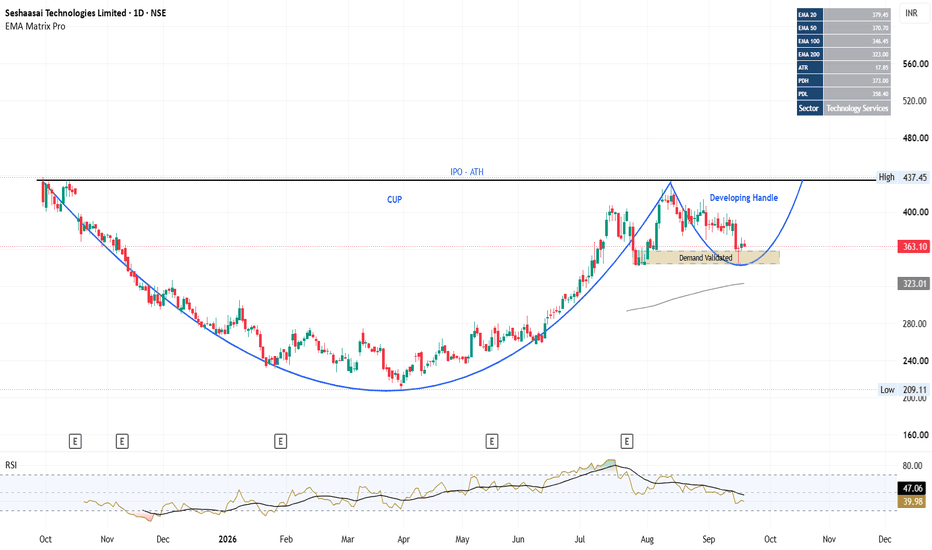
 Education

 Long
Long