• Products
  • Community
  • Markets
  • Brokers
  • More
Get started
  • Markets
  • /World stocks
  • /Ideas
BALRAMCHINBALRAMCHIN is looking strong on the daily timeframe. After facing continuous selling pressure from the 620 zone, the stock made a low near 393 and started forming a reversal structure. Since then, price has been making higher highs and higher lows, indicating improvement in overall market structure. Recently, the stock gave a breakout above the important 510 resistance zone and is now sustaining above it. Previous resistance is now acting as support, which is generally considered a positive sign in price action. The stock has also re-tested the breakout area and buyers are still active near those levels. Another positive point is that price is trading above the key EMAs, and the EMAs have started aligning upwards again. Momentum has improved in the recent sessions, and volume activity has also increased during the upside move. Currently, the stock is moving near the 540 zone. If price sustains above the breakout area and gives a fresh breakout from the current consolidation, then there is probability of an upside move towards the next resistance zone near 590-600 levels. Important zones to watch: • Support zone: 510 area • Immediate resistance: 552 zone • Major resistance: 590-600 zone As long as price sustains above the recent breakout zone, bullish structure remains intact. This is my personal analysis, share your viewpoint. ✅ If you like my analysis, please follow me here as a token of appreciation :) in.tradingview.com/u/SatpalS/ 📌 For learning and educational purposes only, not a recommendation. Please consult your financial advisor before investing.
NSE:BALRAMCHIN
by SatpalS
Updated
44
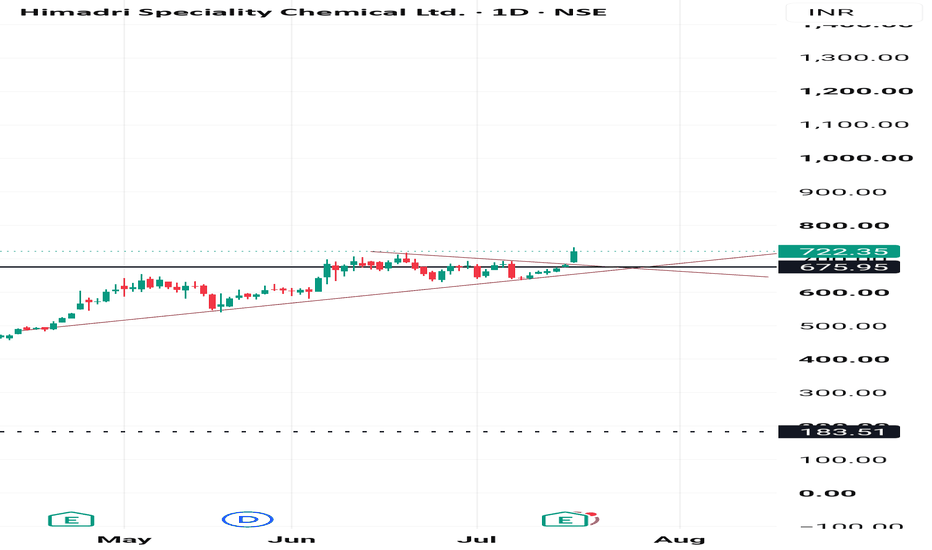
HSCL Breakout HSCL has delivered a strong breakout from a multi-week symmetrical triangle, backed by a powerful bullish candle, indicating renewed buying momentum. The breakout also comes above a key horizontal resistance level, strengthening the bullish structure. Price continues to trade above the major moving averages, suggesting the primary trend remains positive. If the breakout sustains, the stock could be setting up for the next leg of its uptrend. A healthy retest of the breakout zone would further improve the technical setup.
NSE:HSCLLong
by thp_trading_lunatic
UPL Share Analysis (4H Timeframe)Bias: Bullish (Short-Term) Strategy: Buy on dips/breakout continuation. 🔹 Strong Reversal from Demand Zone UPL has shown a sharp bounce from the discount/demand zone near ₹560–₹570, indicating strong buying interest and possible trend reversal. 🔹 Break of Structure (BOS) Price has broken short-term resistance and moved above the equilibrium zone (~₹625–₹630), signaling bullish momentum building up. 🔹 Momentum Shift to Buyers After a prolonged downtrend, higher lows formation and an impulsive bullish candle confirm buyer dominance in the short term. 🎯 Key Levels to Watch ✅ Entry Zone: Around ₹625–₹630 (on retest / continuation) 🛑 Stop Loss: ₹590 (below recent swing low) 🎯 Target 1: ₹645 – ₹650 (supply zone) 🎯 Target 2: ₹660 – ₹680 (strong resistance/premium zone) **If price sustains above ₹630, we may see a continuation rally towards ₹660+ levels.
NSE:UPL
by DattuAtp
Why Markets Move Every day, millions of traders watch price charts, searching for the next big move. Some rely on indicators. Others study chart patterns or economic news. Yet beneath every candle, every breakout, and every trend lies one simple process that drives every financial market: An auction between buyers and sellers. The market doesn't move because an indicator turns green or a news headline appears. It moves because buyers and sellers constantly negotiate what an asset is worth. Understanding this auction changes the way you see price charts. Instead of looking at random candles, you begin to see a continuous battle between supply and demand. Every Trade Has Two Sides For every buyer, there must be a seller. When you buy a stock, someone else is willing to sell it. When you sell Bitcoin, another trader believes it's worth buying. This exchange creates the market. Price doesn't move simply because people buy or sell. It moves when one side becomes more aggressive than the other. If buyers are willing to pay increasingly higher prices, the market rises. If sellers become more eager to accept lower prices, the market falls. The chart is simply a visual record of this ongoing negotiation. Why Price Doesn't Stay Still Imagine an auction for a valuable painting. If several people want it, they continue raising their bids. Each higher bid pushes the price upward. Financial markets work the same way. Strong buying pressure forces buyers to offer higher prices. Strong selling pressure forces sellers to accept lower prices. This constant competition creates trends, pullbacks, consolidations, and breakouts. Price is always searching for a level where buyers and sellers temporarily agree. The Balance Between Supply and Demand Markets spend much of their time searching for balance. When buyers and sellers are equally active, price often moves sideways. This is known as consolidation. Eventually, one side gains confidence. Perhaps buyers become more aggressive after positive earnings. Perhaps sellers react to disappointing economic data. The balance shifts, and price begins moving in a new direction. Every trend begins with an imbalance between supply and demand. The Role of Institutions Retail traders are only one part of the market. Large institutions, hedge funds, banks, and investment firms manage enormous positions. Because of their size, they cannot always enter or exit trades immediately. They often require significant liquidity to complete their orders. This is one reason price frequently revisits important highs, lows, and support or resistance zones. These areas contain the volume institutions need to execute large transactions. Understanding this helps explain why the market sometimes appears to move in unexpected ways. Why Markets Trend A trend is simply the result of one side consistently winning the auction. During an uptrend, buyers repeatedly show they are willing to pay higher prices. Each higher high and higher low reflects growing demand. During a downtrend, sellers become increasingly aggressive. Each lower high and lower low shows that supply is overpowering demand. The trend continues until the balance changes. Why Consolidation Happens Not every trading session produces a strong trend. Sometimes buyers hesitate. Sometimes sellers become less aggressive. Neither side has enough conviction to move price significantly. This creates consolidation. Many traders become frustrated during these periods. Professional traders understand that consolidation is simply the market preparing for its next decision. The longer the balance remains, the more meaningful the eventual breakout often becomes. Reading the Story Behind the Candles Every candlestick tells part of the auction's story. A strong bullish candle shows buyers overwhelming sellers. A long upper wick reveals sellers rejecting higher prices. A small candle reflects uncertainty. A large bearish candle signals aggressive selling pressure. Instead of memorizing patterns, ask a simple question: Who is winning the auction right now? That single question often provides more insight than any indicator. Final words: Markets are not random. They are continuous auctions where buyers and sellers negotiate value every second. Every trend begins with an imbalance. Every consolidation reflects temporary agreement. Every breakout signals a shift in conviction. When you stop looking at charts as collections of candles and start viewing them as a record of buyer and seller behavior, technical analysis becomes much easier to understand. Because every move in the market begins with one simple question: Who is willing to pay more, and who is willing to accept less? The answer to that question is what moves every market.
AEducation
by Karrie_mantor
TCPL Packaging cmp 3265.30 Daily ChartTCPL Packaging cmp 3265.30 Daily Chart - Support Zone 2900 to 3200 Price Band - Resistance Zone 3400 to 3750 Price Band - Breakout done of Falling Resistance Trendlines - Repeat Rounding Bottoms around Support Zone - Volumes seen spiking heavily over the past few days
NSE:TCPLPACK
by PIYUSHCHAVDA
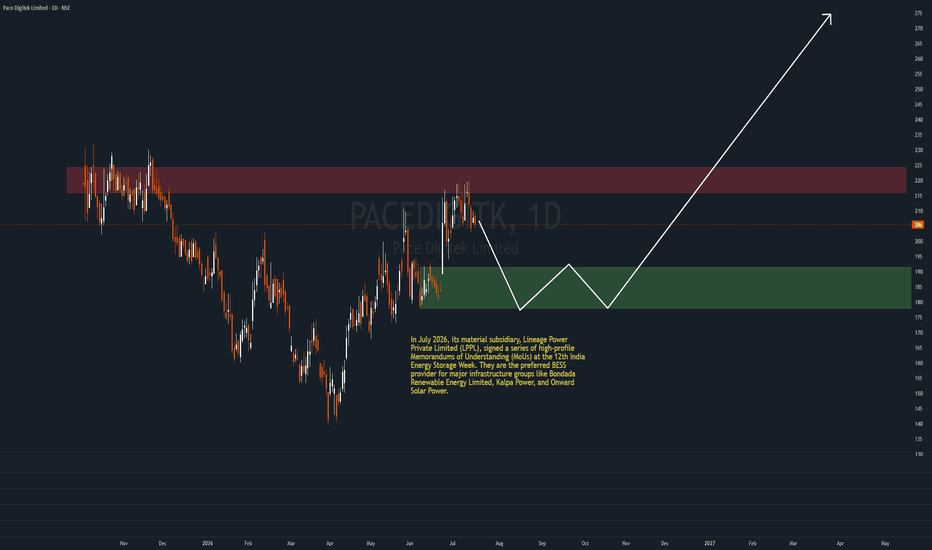
Holds a massive total order book of approximately ₹11,400 croreThe company carries a market capitalization of roughly ₹4,439 crore with a healthy Return on Equity (ROE) track record over three years sitting at 26.4%. Capital Raised: The company recently filed for a ₹900 crore fundraising initiative approved by SEBI specifically targeted to accelerate and expand its energy manufacturing pipeline. Pace Digitek is aggressively executing an expansion strategy to secure its place as India's largest operational BESS manufacturer: Current Capacity: Upgraded rapidly to a 5 GWh manufacturing line by mid-2026. Targeting 10 GWh: Installs a third manufacturing line through August and September, aiming to scale up to an active 10 GWh production capacity by October 2026. Backward Integration: The company has already mapped plans to transition into direct lithium-ion cell manufacturing and container fabrication to decouple from global supply dependencies. DISCLAIMER: Do your own research.
NSE:PACEDIGITKLong
by PriceVolumePro
Nice buying Opportunity in ACEMaking Pole N Flag pattern on daily time, high chances of golden cross over. Nice chart patterns on Weekly and Monthly timeframe as well.
NSE:ACE
by ppcworld22
Building BESS capacity and expanding itBESS is emerging as a major growth opportunity for WAAREE ENERGIES. The company is building a planned BESS capacity of 20 gigawatt hours(GWh). Of this, Phase 1 comprising 3.5 GWh is expected to be commissioned during the current financial year, while the remaining 16.5 GWH is targeted for the next financial year. The total capex outlay is approximately 100 billion INR. The facility is expected to become India's largest integrated advanced cell chemistry and battery pack manufacturing hub.
NSE:WAAREEENERLong
by PriceVolumePro
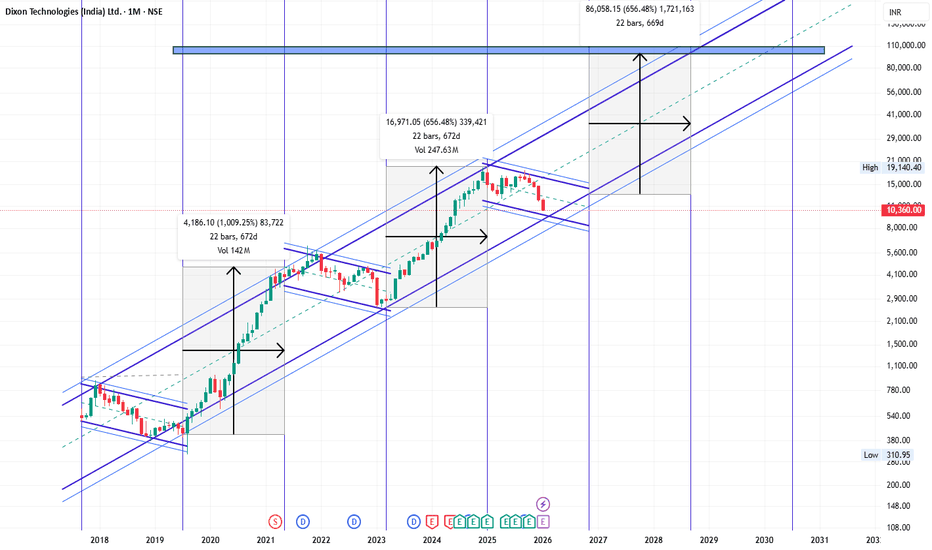
DIXON Monthly chart Suggest 5x ROI Possible in next 7-8 yearsDIXON Monthly chart Suggest 5x ROI Possible in next 7-8 years. Fundamentals: Company has delivered good profit growth of 45% CAGR over last 5 years 3 Years ROE 28.1% Sales growth is 45% of last 10 years. Technical: DIXON is following Monthly cycle of 22 months. It may still correct a bit but upside potentials is huge so time to accumulate on all dips. LTP - 10360 Targets - 52000+ Timeframe - 7-8 Years Happy Investing.
NSE:DIXONLong
by ChartsBoltahai
Updated
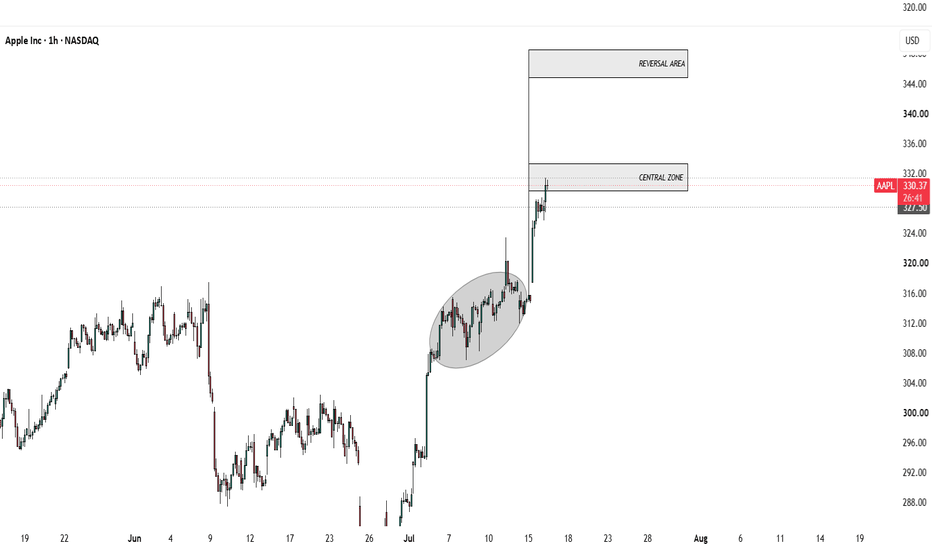
AAPL Stock Analysis: Identifying Key Reversal Areas for AppleIn this video/analysis, I take a look at the current price action for Apple Inc. (AAPL) on the 1-hour timeframe. We identify a significant breakout from the previous consolidation zone and highlight the key "Reversal Areas" where price action may encounter resistance. Watch to see if AAPL holds these levels or if we can expect a potential trend reversal in the coming sessions. AAPL stock forecast, trading strategies, supply and demand trading, chart patterns, hourly chart analysis, stock breakout, market trends, technical analysis for beginners, Apple stock prediction
NASDAQ:AAPLShort
by maheshdeoghar
22
Apar Inds cmp 14030 Daily ChartApar Inds cmp 14030 Daily Chart - Support Zone 12300 to 13800 Price Band - Resistance Zone 14245 to 15665 Price Band - Rising Price Channel Broke down after the ATH - Breakout from Falling Resistance Trendline stable - Good Support base formed near 13400 to 13800 - Rising Support Trendline shouldering Price up move - Support Zone been tested retested for upside move - Volumes needed to support the upwards price breakout
NSE:APARINDS
by PIYUSHCHAVDA
22
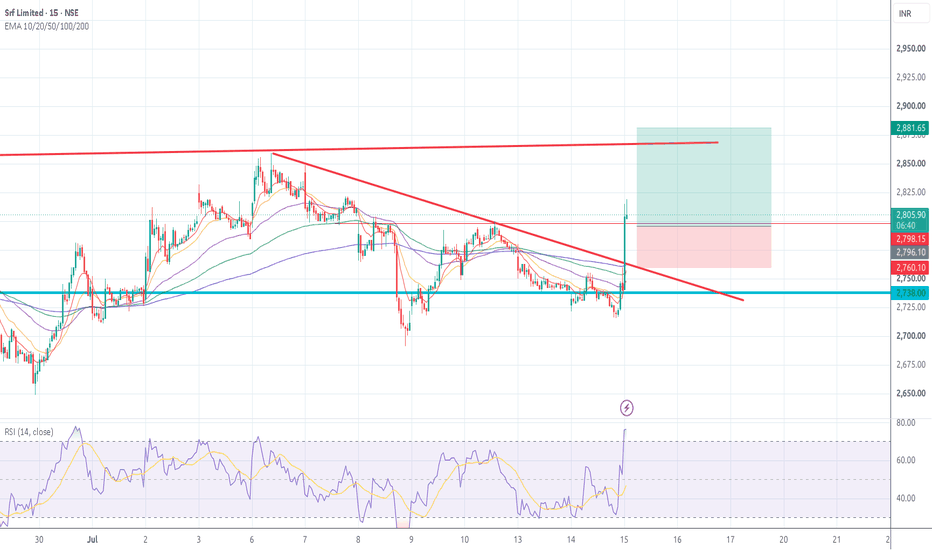
srf breakout on 15 minute chart srf broken the structure from LL HL to upside on 15 minute chart for intra day buy in zone 2790 2800 with sl 2760 tgt will 2850 2880 , go with strict sl, volume is good wati for dip
NSE:SRFLong
by casualtrader_ct
Updated
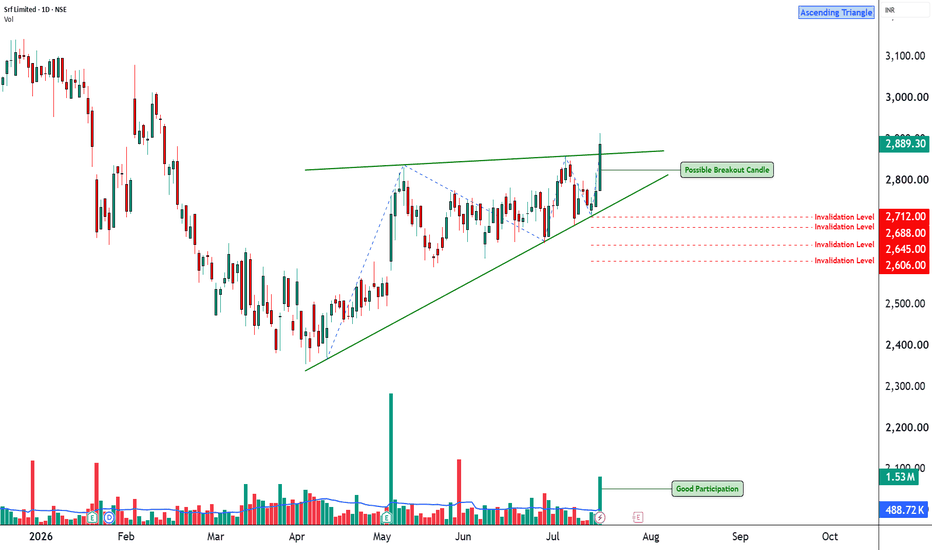
SRF Ascending Triangle Breakout (Possible)________________________________________ 📊 SRF: Daily Technical Snapshot – Ascending Triangle Breakout (Possible) 📊 STWP Technical Analysis ________________________________________ MARKET STRUCTURE SNAPSHOT | NSE: SRF | DAILY Closing Price: ₹2,889.30 (+₹113.70 | +4.10%) Core Trend: Strong Uptrend Market State: Confirmed Breakout in Progress Price Structure: Price has broken above an Ascending Triangle, supported by a strong bullish candle and exceptionally high trading volume. The breakout reflects increasing buying pressure following a period of consolidation. ________________________________________ OPERATIONAL PRICE GRID & KEY REFERENCE LEVELS Model Reference Level: ₹2,916.00 Hard Invalidation Level: ₹2,606.80 Structural Risk: ₹309.20 (10.60%) Resistance Levels: R1 ₹2,944.50 | R2 ₹2,999.70 | R3 ₹3,083.40 Support Levels: S1 ₹2,805.60 | S2 ₹2,721.90 | S3 ₹2,666.70 Range Structure: Low ₹2,606.80 | High ₹3,083.40 Higher Timeframe Observation Zones: ₹3,000 | ₹3,083 | ₹3,150 ________________________________________ MOMENTUM, PARTICIPATION & CPR DATA Volume Profile: 1.53 Million Shares Volume Character: Extremely High Relative Participation RSI: 63.62 (Strong Momentum Zone) ADX: 10.48 (Early Trend Development) ROC: +3.21% MACD Status: Fresh Bullish Crossover CCI: +198.29 (Strong Bullish Momentum) Stochastic Reading: 90.01 (Extended Momentum Zone) Current Bias: BUY ON PULLBACKS CPR State: Bullish Zone | CPR Moving Up (Narrow) Today's CPR: Pivot ₹2,777.55 | Top ₹2,776.55 | Base ₹2,778.50 Tomorrow's CPR (Projected): Pivot ₹2,860.80 | Top ₹2,875.05 | Base ₹2,846.55 ________________________________________ 📚 EDUCATIONAL OBSERVATION SRF has confirmed a breakout from an Ascending Triangle, a bullish continuation pattern that often develops during an established uptrend. The pattern is characterised by a series of higher lows, indicating increasing buyer aggression, while repeated tests of a relatively flat resistance level gradually absorb selling pressure. The eventual breakout above resistance suggests that buyers have gained control and that the prior uptrend may be ready to resume. The latest breakout is supported by a strong bullish candle, exceptionally high trading volume and expanding momentum, reflecting broad market participation. Increased volume during a triangle breakout generally strengthens the reliability of the move, as it indicates that the breakout is supported by genuine buying interest rather than low-volume price fluctuations. Momentum indicators continue to remain constructive. The RSI at 63.62 reflects healthy bullish momentum without reaching extreme overbought territory. MACD has generated a fresh bullish crossover, signalling improving trend strength, while the ROC of +3.21% indicates continued upside acceleration. The CCI reading of +198.29 confirms strong buying momentum, and the Stochastic reading of 90.01 reflects sustained participation, although elevated momentum readings may occasionally lead to short-term consolidations. The projected Central Pivot Range (CPR) for the next trading session has shifted higher, with the projected Pivot at ₹2,860.80. A rising CPR generally indicates improving market acceptance of higher prices and often supports trend continuation when accompanied by strong participation. The dashboard therefore continues to maintain a Buy on Pullbacks approach rather than chasing prices after a sharp advance. The immediate technical focus remains on the resistance zone between ₹2,945 and ₹3,000. Sustained trading above this region could reinforce the breakout and bring the higher-timeframe observation zones near ₹3,083 and ₹3,150 into focus. On the downside, ₹2,806 remains the first important support, while the structural invalidation level is positioned near ₹2,607. ________________________________________ 🏢 BUSINESS OVERVIEW SRF Limited is a diversified chemicals and manufacturing company with businesses spanning specialty chemicals, fluorochemicals, packaging films and technical textiles. The company continues to benefit from increasing global demand for specialty chemicals, expanding export opportunities and ongoing capacity additions across its high-margin businesses. Its diversified product portfolio and focus on innovation provide a constructive long-term business outlook. ________________________________________ 📖 Educational Note Support and resistance levels should be treated as observation zones rather than predictive targets. Chart patterns, price action, volume analysis, momentum indicators and CPR are educational tools that help market participants understand evolving market structure within a disciplined risk-management framework. ________________________________________ ⚠️ Disclaimer This analysis is provided strictly for educational and informational purposes. It does not constitute financial, investment or trading advice and should not be interpreted as a recommendation to buy or sell any security. Investments in the stock market are subject to market risks, including the possible loss of capital. Historical performance, chart patterns and technical indicators do not guarantee future results. Please conduct your own research and consult a SEBI-registered investment adviser before making investment decisions. STWP assumes no responsibility or liability for any financial loss arising directly or indirectly from the use of this analysis.
NSE:SRFLong
by simpletradewithpatience
BUY TODAY SELL TOMORROW for 5%DON’T HAVE TIME TO MANAGE YOUR TRADES? - Take BTST trades at 3:25 pm every day - Try to exit by taking 4-7% profit of each trade - SL can also be maintained as closing below the low of the breakout candle Now, why do I prefer BTST over swing trades? The primary reason is that I have observed that 90% of the stocks give most of the movement in just 1-2 days and the rest of the time they either consolidate or fall Resistance breakout in SATIA BUY TODAY SELL TOMORROW for 5%
NSE:SATIA
by Kapil-Mittal
44
Potential uptrend - Himadri Specialty Chemical Ltd. (NSE: HSCL)Timeframe: 1D CMP: ₹722.35 Change: +5.99% Volume: 28.44M (Significantly Above Average) 📈 Technical Overview Himadri has delivered a strong bullish breakout above the major resistance zone of ₹700-705 after spending several weeks consolidating between ₹640 and ₹700. Today's candle is a wide-range bullish breakout candle accompanied by a massive volume spike, indicating aggressive institutional participation rather than a low-volume breakout. The stock has now confirmed: ✅ Higher High ✅ Higher Low structure ✅ Breakout above consolidation ✅ Strong volume confirmation This significantly improves the probability of trend continuation. Key Levels 🟢 Immediate Support ₹700-705 (Fresh breakout level) ₹685-690 ₹640 (Major demand zone) 🔴 Resistance ₹740 (Immediate supply) ₹760 ₹790-800 (Psychological resistance) Bullish Scenario As long as price sustains above ₹700, bulls remain firmly in control. Targets Target 1: ₹740 Target 2: ₹760 Target 3: ₹790-800 Extended Swing Target: ₹840+ Entry Strategy Aggressive Entry Buy on dips between: ₹710-720 Conservative Entry Wait for: Pullback towards ₹700-705 Bullish reversal candle Volume contraction during pullback Stop Loss Swing Traders: ₹685 Closing Basis Positional Traders: ₹670 Closing Basis Volume Analysis The breakout is supported by one of the highest volumes seen in recent weeks. This generally indicates: Institutional accumulation Fresh buying Higher conviction breakout A breakout without volume often fails. This one has the required participation. Momentum Price has exited a prolonged sideways range. The stock is now entering price discovery above recent swing highs. Unless profit booking becomes aggressive near ₹740-760, momentum favors continuation. Risk Factors Watch for: Failure to sustain above ₹700 High-volume bearish engulfing candle Sharp rejection from ₹740 followed by increasing selling volume These would indicate a possible false breakout. Trading Plan Bias: 🟢 Bullish Buy Zone: ₹705–720 Stop Loss: ₹685 Targets: 🎯 ₹740 🎯 ₹760 🎯 ₹790-800 Risk-Reward: Approximately 1:2.5 to 1:4 depending on entry.
NSE:HSCL
by Abhishek_Patil_2510
BHEL - multi timeframe analysisIn the lower time frame, the price has formed a rounding bottom pattern. And now, it is giving a breakout. In the daily time frame, the price has formed a W pattern. Both patterns are bullish. Buying zone is 432 - 436 with the stop loss of 428 for the targets 440, 446, 450, 456 and 460. The price is bearish below 420. If it breaks 420, it can test the 400 zone. Always do your analysis before taking any trade.
NSE:BHELLong
by vanathi
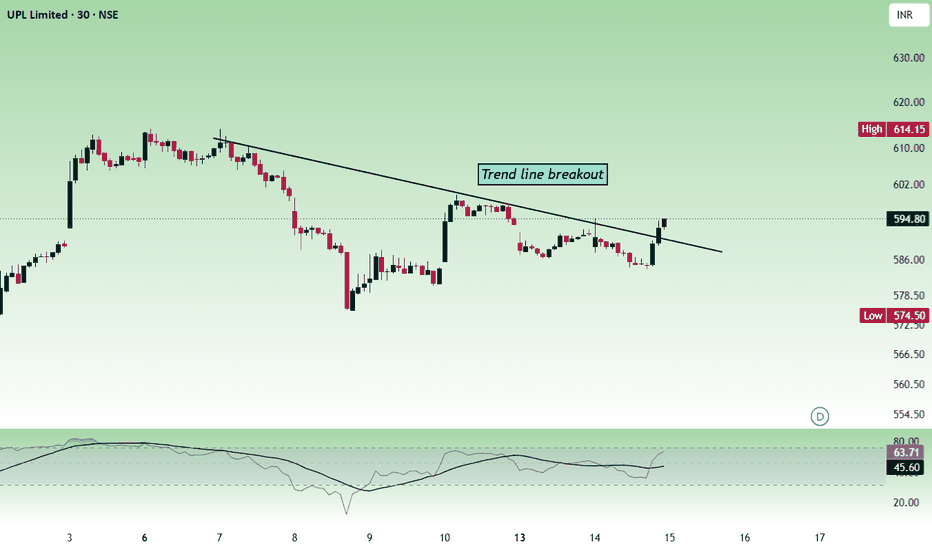
UPL Limited - Multi time frame analysis.In the lower time frame, the price has given a trend line breakout. In the daily time frame, the price is nearing a trendline resistance. Sustaining above the trendline with bullish strength at the 600 - 602 zone is important to move up. Buy above 593 with the stop loss of 588 for the targets 598, 603, 608, 612 and 619. Always do your analysis before taking any trade.
NSE:UPLLong
by vanathi
Updated
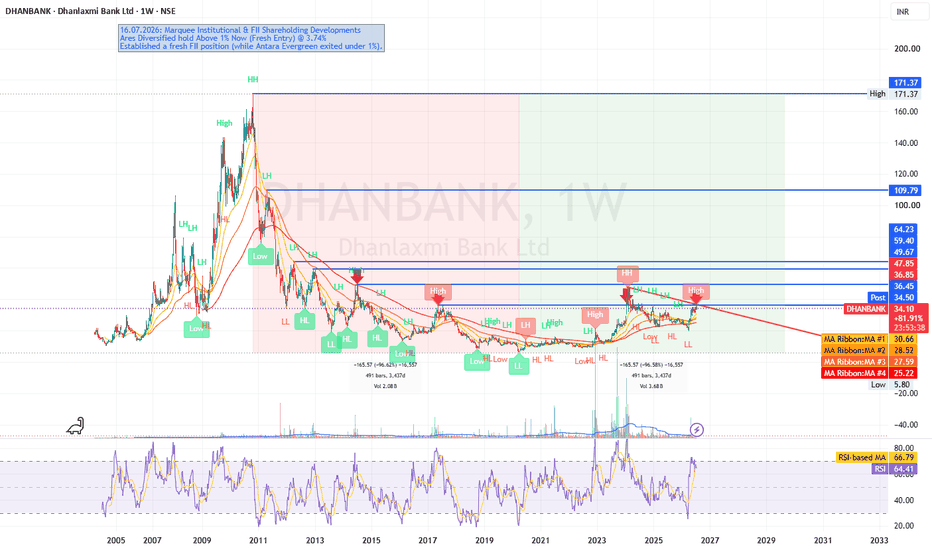
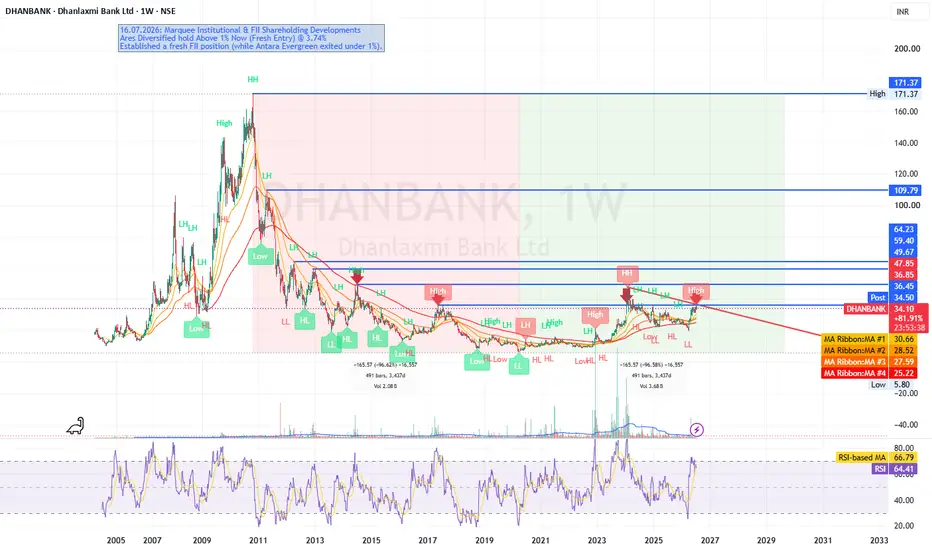
DHANBANK: Multi-Year Base Breakout & Fresh FII CatalystOverview : Dhanlaxmi Bank Ltd (NSE: DHANBANK) is exhibiting a textbook macro trend reversal on the weekly (1W) timeframe. After suffering a grueling multi-year downtrend that pushed the price to a low of ₹5.80, the stock has spent several years forming a massive accumulation base. It has recently broken out of a primary descending resistance trendline and is currently trading near ₹33.94, establishing a new bullish sequence. Fundamental Catalyst (The "Smart Money" Factor): A major structural driver for this technical turnaround is the recent institutional activity. The chart highlights significant FII shareholding developments as of July 16, 2026. Ares Diversified has established a fresh position, holding a notable 3.74% stake. This massive influx of "smart money" provides strong fundamental backing to the ongoing technical breakout. Key Technical Observations: Trend Structure & Moving Averages: The macro trend is officially shifting. By breaking the long-term descending trendline and printing a clear sequence of Higher Highs (HH) and Higher Lows (HL), the price action dictates a bullish reversal. This structural shift implies that macro moving averages (like the 50 and 200 EMAs) are beginning to curl upward to provide dynamic support. Momentum (RSI): The Weekly RSI is currently at 63.78, sitting just below its RSI-based moving average of 66.74. This indicates healthy bullish momentum with plenty of room to run before hitting extreme overbought territory. Volume Accumulation: There are distinct spikes in volume during upward price advances over the last few years, confirming that institutions have been quietly accumulating shares within this massive base. Key Levels to Watch: Immediate Resistance: The stock is currently testing a heavy supply zone between ₹36.45 and ₹36.85. A decisive weekly close above this red zone is critical for the next major leg up. Secondary Targets: Reclaiming ₹36.85 opens the door to macro historical resistance levels at ₹47.85, ₹49.67, and eventually the ₹64.23 zone. Immediate Support: The recent Higher Low (HL) structure. Holding above the ₹25.00 - ₹30.00 base is essential to maintain the current bullish sequence. Directional Bias: BULLISH (Buy on Breakout / Hold) The convergence of a multi-year technical breakout and a fresh 3.74% FII entry makes this a high-probability swing setup. For New Entries: A weekly close above the ₹36.85 resistance zone provides a clean breakout entry signal. For Existing Positions: Hold and trail your stop-loss below the recent structural Higher Low to protect capital while letting the macro trend develop. Disclaimer : This analysis is for educational purposes only and does not constitute financial advice. Always manage your risk and position sizing carefully.
NSE:DHANBANKLong
by bhanushalimonish
44
LICI is in breakout with good volumeafter long perido of time life insturance corporation of India is in a breakout. fundamenta is good but due to some macro news it is not perofrming for long period of time.
NSE:LICILong
by guddusarkar70
11
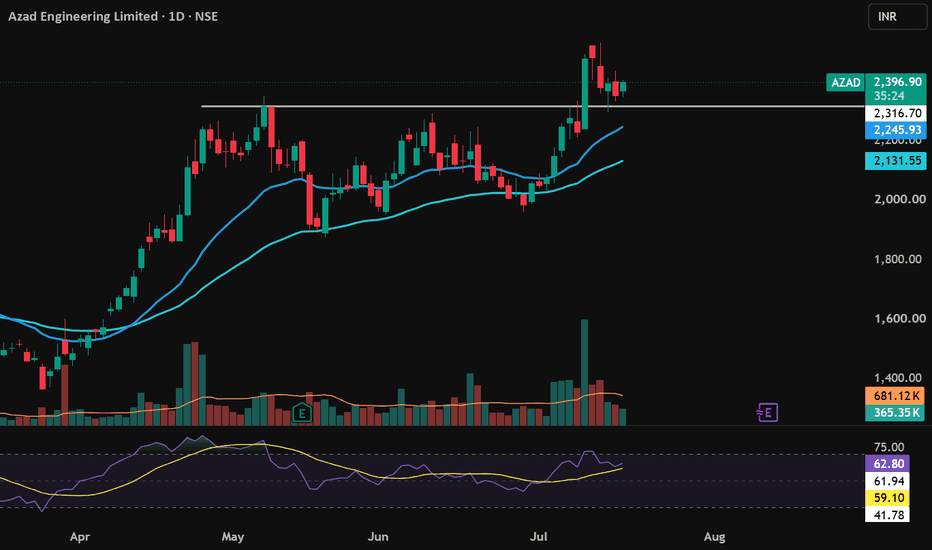
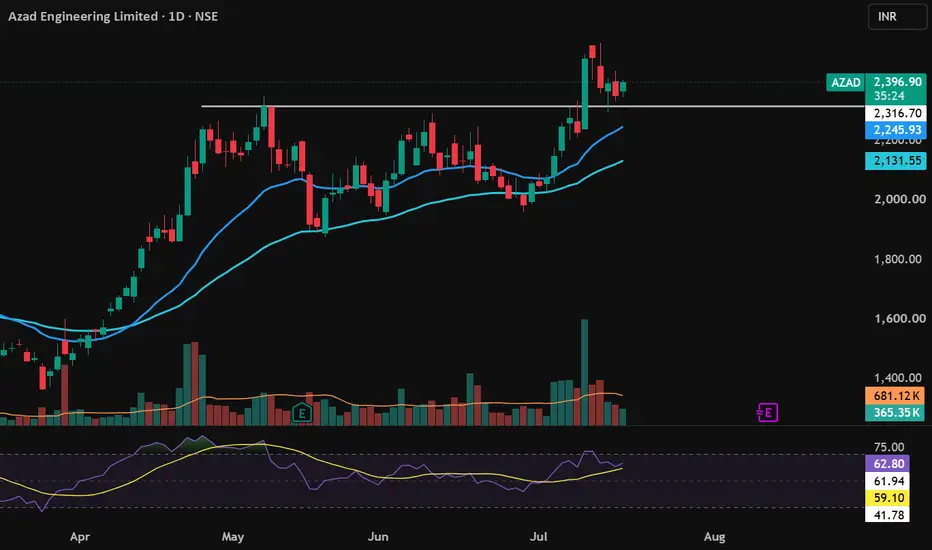
Azad Engineering Bullish BiasThe Stock on a weekly pattern has given a box breakout and the zone was retested. The same pattern is reflecting in Daily TF and the stock gave a breakout from the box zone and now inching upwards. The stock has now re tested its breakout zone and shall move upwards with SL of 2100 zones Target is 2600 zones
NSE:AZADLong
by Harshil_g
WEBELSOLAR: Descending TL Breakout Attempt + "SM" CatalysOverview: Websol Energy System Limited (NSE: WEBELSOLAR) is presenting an incredibly compelling setup on the daily (1D) timeframe. After peaking at a Higher High (HH) of ₹128.31 in late April, the stock entered a corrective phase, printing Lower Highs (LH) and sliding down a well-defined descending trendline. However, current price action at ₹101.15 suggests a potential reversal is brewing, fueled by a major fundamental catalyst. Fundamental Catalyst (The "Smart Money" Factor): A critical detail driving the narrative is the recent block acquisition. Ace investor Vijay Kishanlal Kedia increased his stake by +0.08%, bringing his total holding to 1.10%. This strong institutional/HNI accumulation adds immense conviction to this "solar play" just as the technicals are attempting to turn. Key Technical Observations: Trendline Challenge: The price has stabilized and is currently challenging the primary Descending Trendline that has suppressed the stock since its ₹128.31 high. A breakout here would signal a major structural shift from bearish correction back to bullish accumulation. Fibonacci & Structural Support: The stock found strong demand near the ₹94.78 (Fib 1.272) level and recently established a Higher Low (HL) at ₹99.23. The ability to hold these lower bounds shows that sellers are losing exhaustion. Momentum (RSI): The Daily RSI is currently sitting at 48.20, having just crossed above its RSI-based moving average (45.64). This upward cross indicates that bearish momentum is waning and bullish strength is starting to rebuild, giving the stock the energy needed to push through overhead resistance. Key Levels to Watch: Immediate Resistance: The Descending Trendline itself. A daily close above this line is the first trigger. Secondary Targets: The Golden Pocket resistance at ₹109.96, followed by the previous Lower High (LH) at ₹116.48. Critical Support: The recent Higher Low (HL) at ₹99.23. Below that, the Fibonacci extension at ₹94.78 serves as the ultimate macro defense. Directional Bias: CAUTIOUSLY BULLISH (Buy on Breakout / Accumulate on Support) The convergence of a trendline breakout attempt with high-profile "smart money" backing makes this a highly attractive risk-to-reward setup. For New Entries: Aggressive traders might accumulate near the ₹99-₹100 support zone. Conservative traders should wait for a decisive, high-volume daily close above the descending trendline before initiating a BUY position. For Existing Positions: HOLD. Trail your stop-loss below the ₹94.78 structural support to give the trade room to breathe while protecting downside risk. Disclaimer: This analysis is for educational purposes only and does not constitute financial advice. Always manage your risk and position sizing carefully.
NSE:WEBELSOLARLong
by bhanushalimonish
Kody TechnoLab Limited coming out of Darvas box breakoutIt fell heavily and went through the darvas box theory and now coming out of it with a good break out. It already touched a 52 week high and trying to go to the ATH of 2083. . The tailwind for this stock is - Kody Technolab signed a three-year global medical robot supply and IP agreement with Falcon Tech Robotics and Sccore AI company. This is purely for education purposes not a recommendation. Before investing please analyse it from your end. I am not a SEBI registered. This is my first idea please give me your feedback. Thank you.
NSE:KODYTECHLong
by sekharbiw
44
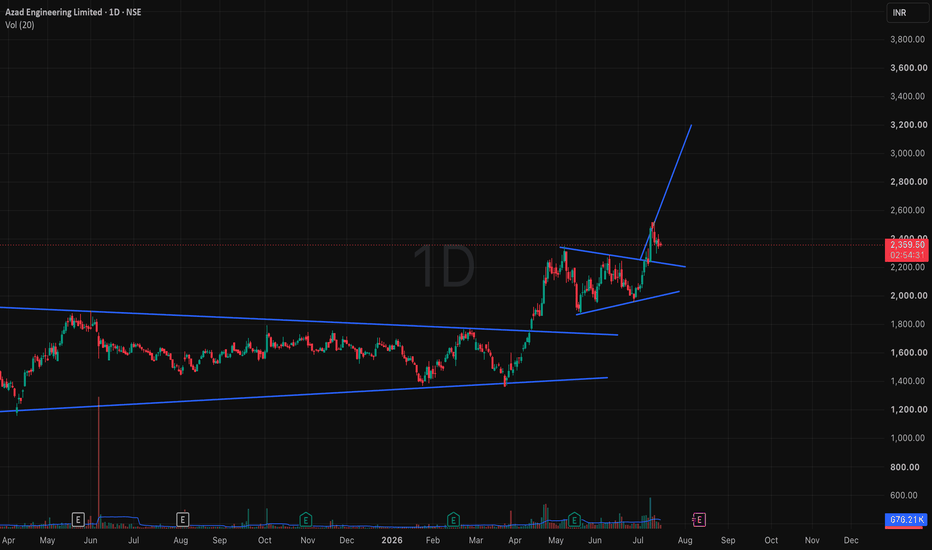
AZAD Engineering - History Repeats Itself!!Azad Engineering broke out from the triangle pattern and looks very bullish ATM. Based on the history of the chart we can expect a short term bullish move in Azad Engineering
NSE:AZADLong
01:25
by a_boy_has_no_name_
112233445566778899101011111212131314141515161617171818191920202121222223232424252526262727282829293030313132323333343435353636373738383939404041414242
…999999

Made by humans

Select market data provided by ICE Data Services. Select reference data provided by FactSet. Copyright © 2026 FactSet Research Systems Inc.Copyright © 2026, American Bankers Association. CUSIP Database provided by FactSet Research Systems Inc. All rights reserved. SEC filings and other documents provided by Quartr.© 2026 TradingView, Inc.

More than a product
  • Supercharts
Screeners
  • Stocks
  • ETFs
  • Bonds
  • Crypto coins
  • CEX pairs
  • DEX pairs
  • Pine
Heatmaps
  • Stocks
  • ETFs
  • Crypto coins
Calendars
  • Economic
  • Earnings
  • Dividends
  • IPOs
More products
  • News Flow
  • Portfolios
  • Fundamental Graphs
  • Yield Curves
  • Options
  • Macro Maps
  • Pine Script®
Apps
  • Mobile
  • Desktop
Community
  • Social network
  • Wall of Love
  • Refer a friend
  • House Rules
  • Moderators
Ideas
  • Trading
  • Education
  • Editors' picks
Pine Script
  • Indicators & strategies
  • Wizards
  • Freelancers
  • Paid Spaces
Tools & subscriptions
  • Features
  • Pricing
  • Market data
  • Gift plans
Trading
  • Overview
  • Brokers
  • Brokers comparison
  • The Leap
Special offers
  • CME Group futures
  • Eurex futures
  • US stocks bundle
About company
  • Who we are
  • Space mission
  • Blog
  • Help Center
  • Careers
  • Media kit
Merch
  • TradingView store
  • Tarot cards for traders
  • The C63 TradeTime
Policies & security
  • Terms of Use
  • Disclaimer
  • Privacy Policy
  • Cookies Policy
  • Accessibility Statement
  • Security tips
  • Bug Bounty program
  • Status page
Business solutions
  • Widgets
  • Charting libraries
  • Lightweight Charts™
  • Advanced Charts
  • Trading Platform
Growth opportunities
  • Advertising
  • Brokerage integration
  • Partner program
  • Education program
Community
  • Social network
  • Wall of Love
  • Refer a friend
  • House Rules
  • Moderators
Ideas
  • Trading
  • Education
  • Editors' picks
Pine Script
  • Indicators & strategies
  • Wizards
  • Freelancers
  • Paid Spaces
Business solutions
  • Widgets
  • Charting libraries
  • Lightweight Charts™
  • Advanced Charts
  • Trading Platform
Growth opportunities
  • Advertising
  • Brokerage integration
  • Partner program
  • Education program
Look FirstLook First