Reliance: Bears Still Have the Upper HandI'm not interested in buying Reliance at current levels. If I had to take a trade today, I'd rather be on the short side.
The stock continues to trade below its 20, 50, 100 and 200-day moving averages, which tells me the broader trend is still bearish. While Reliance is holding an upward trendline, every bounce is getting sold near the ₹1,300 zone. That's a sign of distribution, not accumulation.
The derivatives market supports this view. Heavy Call open interest at ₹1,300, ₹1,310 and ₹1,350 suggests option writers are defending higher levels. A PCR of 0.63 also indicates bearish positioning continues to dominate.
On the daily chart, Reliance is trading below the pivot level of ₹1,302, while the 15-minute chart shows fading momentum with lower highs. Buyers have had multiple opportunities to push the stock higher but haven't been able to sustain above resistance.
As long as Reliance remains below ₹1,302–1,306, I see every pullback as a potential shorting opportunity rather than a buying opportunity.
I'm watching ₹1,279 as the first downside target. If that level breaks, the stock could extend towards ₹1,250–1,260.
I'll change my view only if Reliance closes decisively above ₹1,306 and follows through above ₹1,317. Until then, the trend favours the bears.
My trade: Sell on strength. The risk-reward currently favors the downside.  Short
Short
HCLTECH Falling Wedge Breakout After Strong Q1 FY27 Results📊 HCL Technologies: Daily Technical Snapshot – Falling Wedge Breakout After Strong Q1 FY27 Results
📊 STWP Technical Analysis
________________________________________
MARKET STRUCTURE SNAPSHOT | NSE: HCLTECH | DAILY
Closing Price: 1,221.20 (+57.10 | +4.91%)
Core Trend: Recovery within Long-Term Uptrend
Market State: Confirmed Falling Wedge Breakout
Price Structure: Price has broken above a multi-month Falling Wedge, supported by a strong bullish breakout candle and significantly higher trading volume. The breakout signals weakening selling pressure and improving buyer conviction.
________________________________________
OPERATIONAL PRICE GRID & KEY REFERENCE LEVELS
Model Reference Level: 1,237.00
Hard Invalidation Level: 1,119.00
Structural Risk: 118.00 (9.54%)
Resistance Levels: R1 1,251.47 | R2 1,281.73 | R3 1,326.47
Support Levels: S1 1,176.47 | S2 1,131.73 | S3 1,101.47
Range Structure: Low 1,119.00 | High 1,326.47
Higher Timeframe Observation Zones: 1,355.00 | 1,472.95
________________________________________
MOMENTUM, PARTICIPATION & CPR DATA
Volume Profile: 9.03 Million Shares
Volume Character: Very High Relative Participation
RSI: 62.89 (Strong Momentum Zone)
ADX: 14.20 (Early Trend Development Phase)
ROC: +10.78%
MACD Status: Fresh Bullish Momentum Structure
CCI: +174.99 (Strong Bullish Momentum)
Stochastic Reading: 92.37 (Extended Momentum Zone)
Current Bias: BUY ON PULLBACKS
CPR State: Bullish Zone | CPR Moving Up (Wide)
Today's CPR: Pivot 1,169.70 | Top 1,166.90 | Base 1,172.50
Tomorrow's CPR (Projected): Pivot 1,206.75 | Top 1,213.95 | Base 1,199.50
________________________________________
📚 EDUCATIONAL OBSERVATION
HCL Technologies has confirmed a breakout from a multi-month Falling Wedge, a chart pattern widely regarded as a bullish reversal formation that often develops after an extended corrective phase. The breakout is supported by a strong bullish candle, improving momentum indicators and significantly higher trading volume, reflecting renewed buying interest and strengthening market participation.
A Falling Wedge forms as prices create progressively lower highs and lower lows within converging trendlines. As the pattern matures, selling pressure gradually weakens while buyers begin accumulating at lower levels. A decisive breakout above the upper boundary often signals that the corrective phase may be ending and that a fresh upward trend could be developing.
Momentum indicators continue to support the improving technical structure. The RSI at 62.89 reflects healthy bullish momentum without entering an extreme overbought zone. MACD has generated a fresh bullish crossover, indicating strengthening upside momentum, while the ROC of +10.78% highlights strong price acceleration. The CCI reading of +174.99 confirms robust buying pressure, and the Stochastic reading of 92.37 reflects sustained momentum, although elevated readings also suggest that short-term consolidations or pullbacks remain a normal possibility after a sharp breakout.
The projected Central Pivot Range (CPR) for the next trading session has shifted higher, with the projected Pivot at 1,206.75. A rising and widening CPR generally reflects improving market acceptance of higher prices and often supports trend continuation when accompanied by healthy participation. The current dashboard therefore maintains a constructive outlook with a preference for buying on pullbacks rather than chasing extended moves.
Immediate attention remains focused on the resistance zone between 1,251 and 1,282. A sustained move above this region could strengthen the breakout further and bring the higher-timeframe observation zones near 1,355 and 1,473 into focus. On the downside, 1,176 remains the first important support, while the structural invalidation level is positioned near 1,119.
________________________________________
🏢 BUSINESS & FUNDAMENTAL UPDATE
HCL Technologies recently announced its Q1 FY27 financial results (quarter ended June 2026), delivering a strong operational performance despite a challenging environment for the global IT services sector.
Key Highlights
Net Profit: 4,624 crore, up 20.32% year-on-year from 3,843 crore.
Revenue: 34,579 crore, representing 13.94% year-on-year growth from 30,349 crore.
Interim Dividend: The Board declared an interim dividend of 12 per equity share (face value 2) for FY27. The record date is 17 July 2026, while the dividend will be paid on 27 July 2026.
FY27 Guidance: Management reiterated its constant currency revenue growth guidance of 1–4%, maintaining its earlier outlook despite macroeconomic uncertainty.
The quarterly performance comes at a time when the broader IT sector continues to face headwinds from cautious enterprise technology spending, reduced discretionary budgets and increasing discussions around AI-driven pricing pressure across traditional IT services. Against this backdrop, HCLTech's stronger-than-expected profitability, double-digit revenue growth and stable guidance demonstrate operational resilience and disciplined execution.
Interestingly, the stock had already attracted strong buying interest ahead of the earnings announcement, rallying nearly 5% in the previous trading session. The combination of robust quarterly earnings, a healthy dividend announcement, stable management guidance and a technically confirmed Falling Wedge breakout provides both fundamental and technical support for the improving market structure.
________________________________________
📖 Educational Note
Support and resistance levels should be viewed as observation zones rather than predictive targets. Chart patterns, price action, volume analysis, momentum indicators and CPR are educational tools that help market participants understand evolving market structure within a disciplined risk-management framework. Similarly, strong quarterly results can improve investor sentiment but should always be evaluated alongside broader market conditions, valuation and risk management principles.
________________________________________
⚠️ Disclaimer
This analysis is provided strictly for educational and informational purposes.
It does not constitute financial, investment or trading advice and should not be interpreted as a recommendation to buy or sell any security.
Stock market investments are subject to market risks, including the possible loss of capital.
Past performance, historical observations, chart patterns, earnings performance and technical indicators do not guarantee future results.
Please conduct your own research and consult a SEBI-registered investment adviser before making investment decisions.
STWP assumes no responsibility or liability for any financial loss arising directly or indirectly from the use of this analysis.
 Long
Long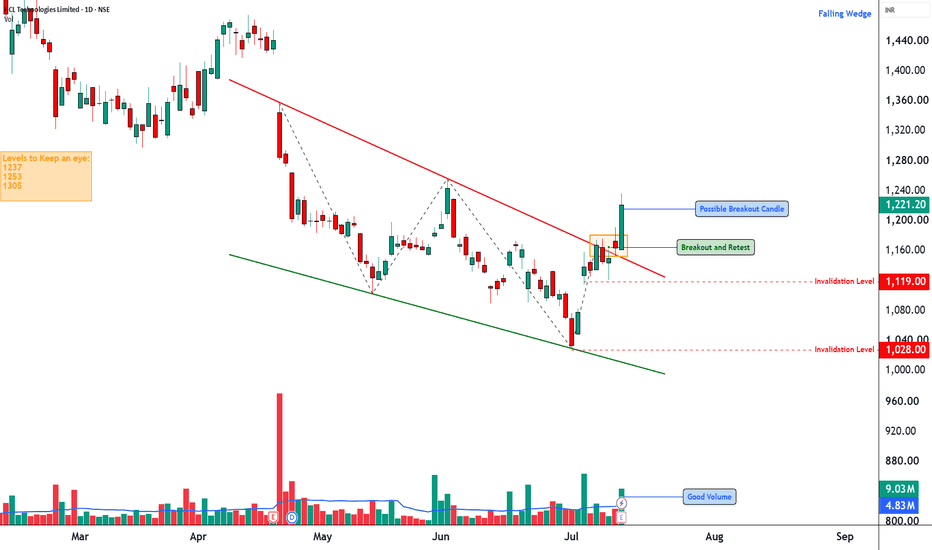
 Long
Long
 Long
Long
 Long
Long
 Long
Long
Balaji Amines @ 52W High, What next is visible on Charts ....???Balaji Amines CMP: 2043.30
Balaji Amines has staged an impressive ~96% rally over the last three months and is currently trading near its 52-week high. While the price action remains bullish, investors should expect higher volatility after such a sharp move.
The bullish view remains valid as long as the stock sustains above the key breakout zone of ₹1,950–2,000. Holding this zone could pave the way for the next leg of the uptrend over the coming months.
Elliott Wave Perspective
Weekly Chart:
The broader structure appears to be in an ABC corrective pattern, with Wave A currently under formation. This suggests that the stock may still have room to extend higher before a larger corrective phase emerges.
Daily Chart:
On the daily timeframe, the stock appears to be in a Wave 3 expansion phase, typically the strongest and most dynamic segment of an Elliott Wave cycle.
Interestingly, both the weekly and daily wave structures converge on similar upside projections, indicating potential targets around:
₹2,300
₹2,450–2,500
Key Levels to Watch
Preferred Entry: ₹1,980–2,020 on a pullback, offering a favorable risk-reward setup.
Immediate Resistance: ₹2,150–2,185. A decisive breakout above this zone could accelerate momentum toward higher targets.
Invalidation Level: ₹1,930. A close below this level would weaken the bullish structure and indicate a failed breakout.
Conclusion :
The stock remains technically strong, supported by both breakout price action and Elliott Wave analysis. While the near-term trend remains bullish, the sustainability of the move depends on holding the ₹1,950–2,000 support zone. If that support holds, the path toward ₹2,300 and eventually ₹2,450–2,500 remains open.  Long
Long
NOVARTIND (NSE) — Explosive Stage 2 BreakoutNovartis India broke out of a multi-week tightening consolidation today, rallying from an open of ₹1,509 to a high of ₹1,690 before settling at ₹1,664.80 (+11.39%). This move comes on the back of a powerful primary uptrend that began in April 2026, when the stock rocketed off a long multi-year Stage 1 base (roughly ₹500–800, spanning early 2022 through mid-2025) into a clean Stage 2 advance — more than doubling from the ~₹725 breakout point to today's high.
Structure:
After the initial vertical leg topped out near ₹1,690 in June, the stock spent the last several weeks forming a tight flag/pennant just under that level — higher lows compressing into resistance, classic contraction after a sharp advance.
Today's candle resolves that pattern with a decisive upside break to fresh highs, taking out the flag's resistance line in one move.
Volume signature: This is the standout part of the chart. Today's volume printed at 307.55K shares — by a wide margin the largest single-session volume bar on this entire multi-year chart, dwarfing even the volume spikes seen around past earnings dates (marked "E").
The relative volume oscillator at the bottom confirms this: it's spiking to its highest reading in the visible history, well above the elevated levels seen during the April–June breakout leg. A move of this magnitude, on volume this far above average, on what appears to be an earnings/news catalyst, is a textbook institutional accumulation signature — big players stepping in with size, not retail noise.
Read: Breakout from tight consolidation + expansion in price + volume climax = trend continuation signal within an established Stage 2 uptrend, though the extended nature of the move (well above rising 50/150/200-day averages) means chasing here carries more risk than buying the original base breakout did.
Not investment advice — chart study for educational purposes.
 Long
Long
 Education

 Education

Trading Masterclass #1Institutional trading means trading like hedge funds, banks, prop firms, and professional desks. They do not trade based on emotions, random tips, or gambling. They use systems, probabilities, risk control, position sizing, discipline, and psychology.
Retail traders often lose because they focus only on “entry.” Institutions focus on:
Risk Management
Capital Protection
Position Sizing
Probability
Psychology
Consistency
Repeatable Edge Education

Education

Education

 Long
Long
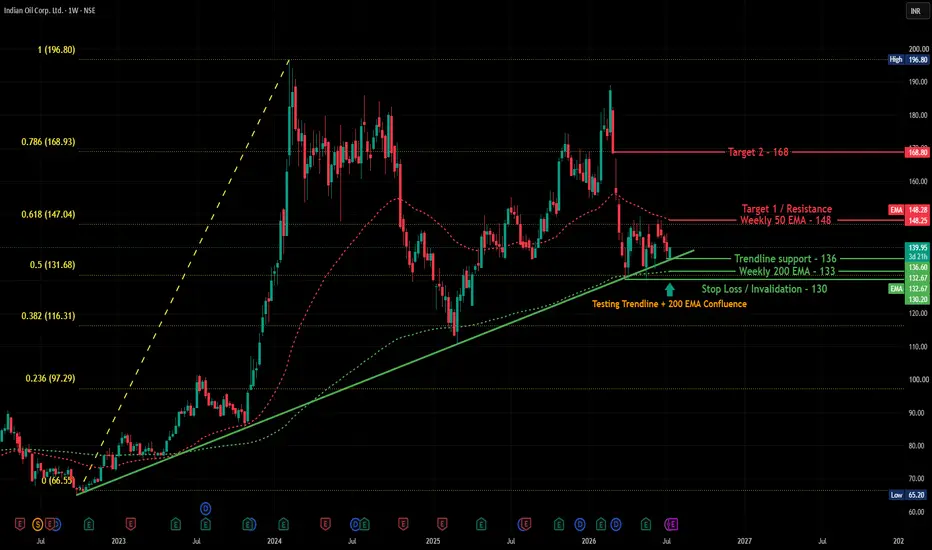
IOC Trendline Support Holds, Valuation Backs the Technical StoryOverview
Indian Oil Corporation is holding right at a confluence of technical support on the weekly chart, while also trading at valuations that stand out favorably against its refining peers. This is a good example of technical and fundamental pictures lining up — worth examining both together.
Technical Structure
On the weekly chart, IOC is trading at 139.95 (+0.71%), sitting right on a rising trendline support (~136) that has held since the 2022 lows, with the Weekly 200 EMA (132.67) just below it, adding confluence. The Weekly 50 EMA (148.25) sits just above as the immediate resistance to watch. Price also remains inside the broader retracement structure from the 2022 low (65.20) to the 2024 high (196.80), currently hovering near the 0.5 Fibonacci level (131.68).
Trade Setup
Entry: Above 140–142 on a sustained move, using the trendline/200 EMA confluence as the base
Stop Loss (Invalidation): Below 130 (just under the Weekly 200 EMA/trendline confluence zone)
Target 1: 148 (Weekly 50 EMA)
Target 2: 168.80 (0.786 Fibonacci level)
Fundamentals — Why This Matters for Long-Term Investors
Valuation: Trading at a P/E of 4.69, well below peers like Reliance (22.52) and MRPL (15.01) — among the cheapest in the sector
Dividend: Strong dividend yield of 5.00%, with a healthy long-term payout history
Profitability: ROE of 20.74% and ROCE of 18.78%, notably ahead of Reliance (ROE 8.91%) and competitive with BPCL/HPCL
Debt: Carries meaningful debt (₹131,822 Cr), typical for capital-intensive PSU refiners but worth noting relative to peers like CPCL, which run lower debt levels
Earnings trend: FY26 net profit of ₹43,677 Cr marks a sharp recovery from FY25's ₹13,789 Cr, though the multi-year picture is volatile, reflecting sensitivity to crude prices and government fuel pricing policy
Caveat: 10-year compounded sales growth is modest, and earnings volatility here is real — this isn't a smooth-growth story, more a cyclical value-and-yield profile
Beginner's Lesson
When a stock's technical support level aligns with an attractive valuation (like a low P/E relative to peers), it can add conviction to a setup — the chart shows where buyers have historically stepped in, while the fundamentals help explain why. That said, PSU oil marketing companies are heavily influenced by government fuel pricing policy and crude oil price cycles, which can override both charts and valuation in the short term — worth keeping in mind before treating this as a purely technical or purely fundamental call.
Conclusion
IOC presents a case where technical support and reasonable valuation are lining up together. As always, confirm with price action before acting on the technical setup, and consider your own investment horizon and risk tolerance if evaluating this from a fundamentals perspective.
Fundamental data sourced from Screener.in. Not investment advice. For educational purposes only. Please consult your financial advisor before making any investment or trading decisions.
 Long
Long
ATHERENERG: From Consolidation to Expansion- Setup: Buy-the-dip continuation in an established uptrend — pullback to higher demand/Balance confluence after a high-volume breakout to new highs (1214)
- Entry: 1140–1152 (scale in on retest of higher Balance 1139.90 / demand zone 1122.80–1152.00); aggressive alternative: momentum add on break/hold above 1214
- SL: 1115 (below the higher demand zone low of 1122.80 and below Low 1122.16, invalidating the confluence support)
- Targets: T1 = 1214 (prior day high retest), T2 = 1260 (measured extension of the current impulse leg), T3 = 1310 (trend-continuation projection if breakout momentum persists)
- ETA: 3–7 trading sessions
- Invalidation: A 4H close back below 1050 (loss of the broken-supply/demand shelf) would break the stair-step structure and signal the uptrend is exhausted
- Score: 7.5/10 — strong trend and volume confirmation, but entry is timing-dependent since price is currently extended well above both Value areas
- Narrative: ATHERENERG is in a strong, volume-confirmed uptrend that has repeatedly resolved consolidations to the upside. Today's breakout to 1214 on heavy volume extends that pattern, but chasing at 1203 offers weak risk/reward. The high-probability play is patience for a shallow pullback into the 1122–1152 higher demand/Balance shelf, which represents the most recent "line in the sand" for bulls, a hold there keeps the stair-step bullish structure intact and sets up a push toward new highs; a break below it, especially back under the broken-supply zone at 1016–1045, would be the first real sign of trend exhaustion.  Long
Long