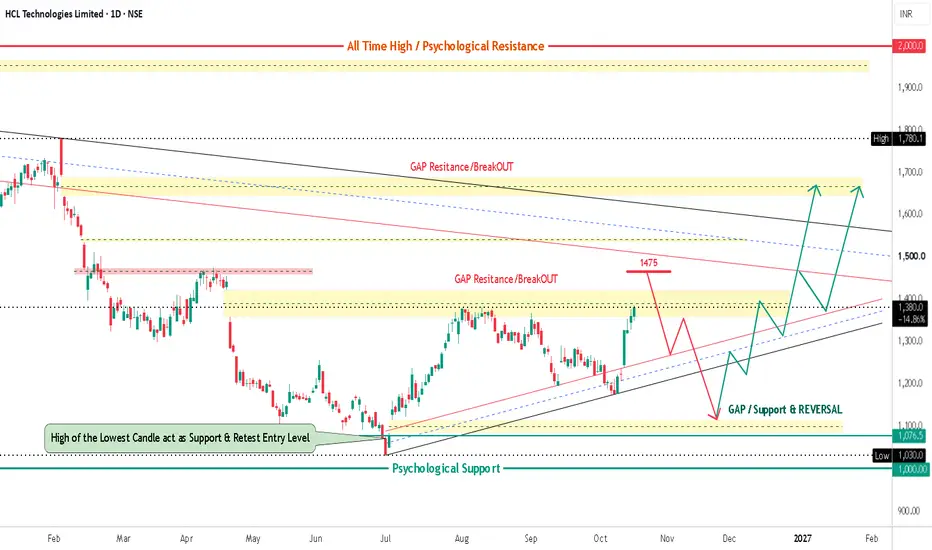
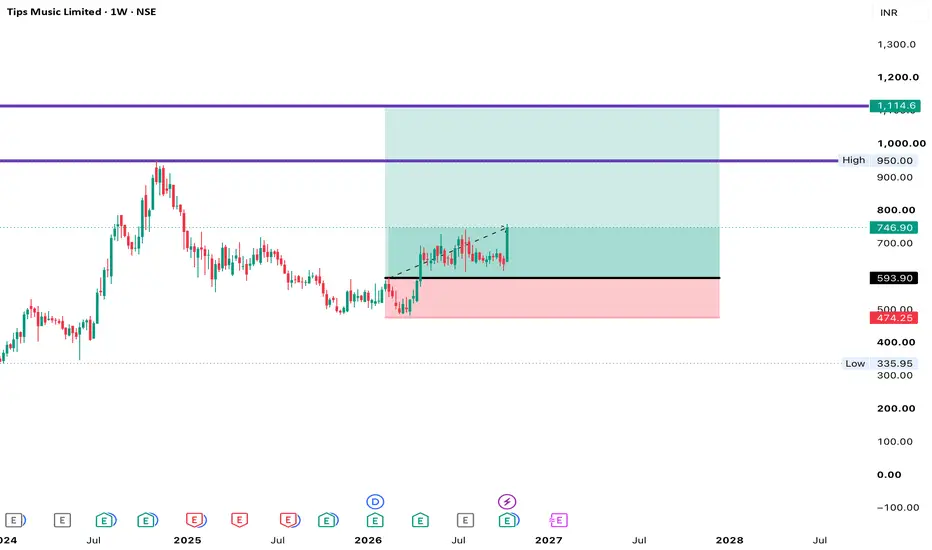
HCLTech (Daily) - Will GAP Fill Theory make the Price Fall..??NSE:HCLTECH GAP fill setup:
"Reason why think the Price might Fall from 1475-1450:-
GAPs attracts price & GAPs need to be filled, And Price already Resist & Fell from 1475-1450 zone, so Price might again resist 1475 level & will Fall to Fill the GAP, And BULL RUN will/might start from 1075-1100 level. "
HCL Technologies Limited is demonstrating a structural recovery on the daily chart within an ascending channel, recovering from its base low at ₹1,030.00 and Psychological Support
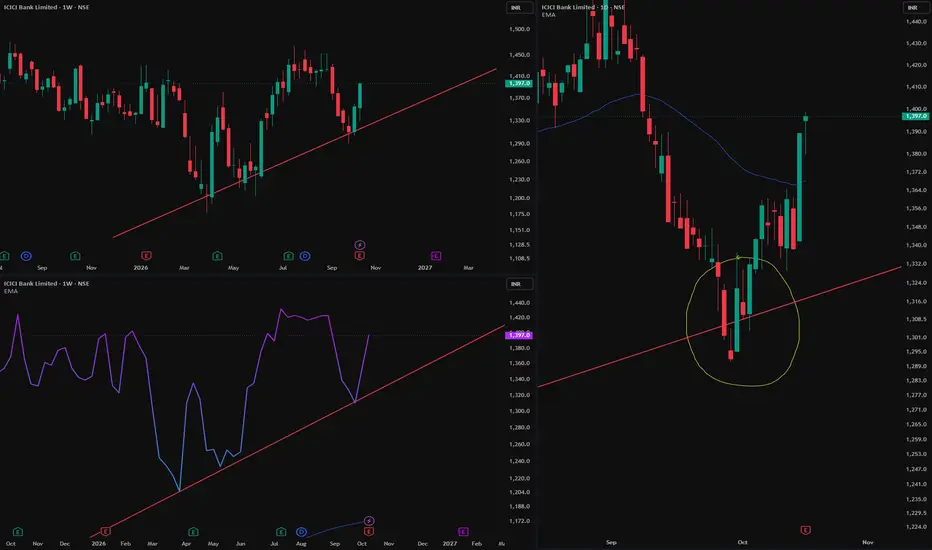
Simple Things Work ( My Small Price action Observation ) Apoorv Dubey | SEBI Registered Research Analyst
A small detail in the bigger picture
The two charts on the left show the same weekly timeframe...one using candlesticks, the other a line chart. Notice how the weekly closes respected a simple support trendline.
On the daily chart, Monday and Tuesday showed heavy selling and an apparent breakdown. Then came a strong bullish candle and a recovery through Wednesday–Friday, bringing Friday’s close just above that weekly support.
A simple observat
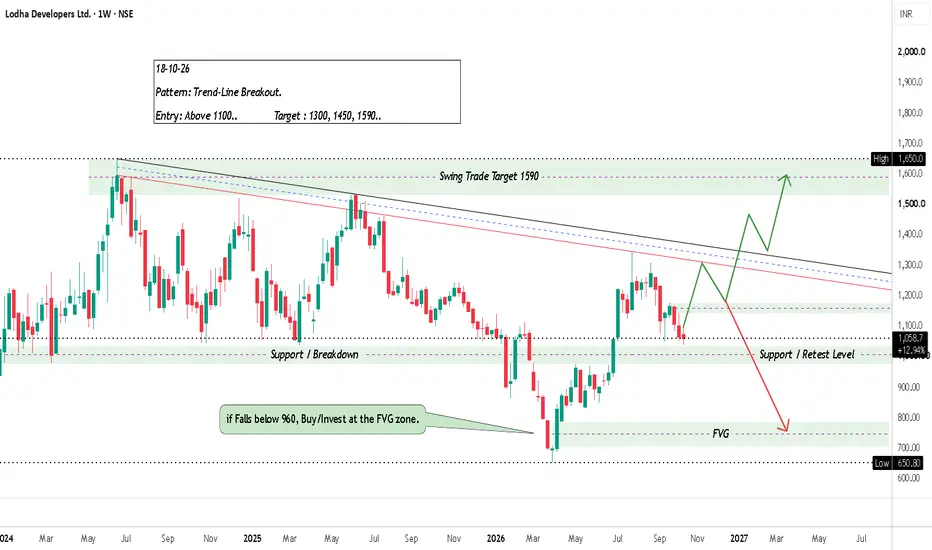
Lodha - Weekly Analysis – 20 to 45% UPSIDE PotentialNSE:LODHA
Lodha Developers Ltd. (Macrotech Developers) is establishing a major consolidation and trendline breakout setup on the weekly chart following a prolonged correction from its peak at ₹1,650.00 . The stock is forming a multi-month **Trend-Line Breakout** pattern along a descending channel band. Currently trading at ₹1,058.70 (-0.57%), price is coiling right below the Support / Retest Level shelf ( ₹1,000.00 – ₹1,050.00 ) and the primary trigger point at Entry: Above 1100.. . Th
APLApollo Tubes – Daily Analysis – 5 to 30% UPSIDE Potential..NSE:APLAPOLLO
APL Apollo Tubes Limited is forming a major bullish continuation structure on the daily chart. The stock has established a multi-month **Cup & Handle Pattern Breakout** base supported by a high-probability **Trend-line Breakout** along the handle consolidation. Currently trading at ₹2,152.70 (+0.64%), price is coiling right above the Support / Retest Level zone ( ₹2,018.70 – ₹2,085.40 ) and testing immediate trigger levels at ₹2,180.40 and ₹2,190.00 .
🔹 PATTERN: CUP &
Mother & Child Patterns in Hindustan Zinc Ltd.#Future Segment Stock
𝗠𝗼𝘁𝗵𝗲𝗿 & 𝗖𝗵𝗶𝗹𝗱 𝗣𝗮𝘁𝘁𝗲𝗿𝗻𝘀 | 𝗛𝗶𝗻𝗱𝘂𝘀𝘁𝗮𝗻 𝗭𝗶𝗻𝗰 𝗟𝘁𝗱.
📊 An interesting example of the Mother & Child Pattern on the daily linear chart of Hindustan Zinc Ltd.
Identifying smaller patterns within a larger market structure can provide better clarity when assessing potential price targets.
🔍 𝗖𝗵𝗶𝗹𝗱 𝗣𝗮𝘁𝘁𝗲𝗿𝗻
A symmetrical triangle is visible within the larger structure and appears to be approaching its final wave, based on the wave count.
🎯 𝗣𝗼𝘁𝗲𝗻𝘁𝗶𝗮𝗹 𝗣𝗿𝗶𝗰𝗲 𝗧𝗮𝗿𝗴𝗲𝘁𝘀
1. 𝗙𝗶𝗿𝘀𝘁 𝗧𝗮𝗿𝗴𝗲𝘁
The uppe
Option TradingIntraday trading involves buying and selling financial instruments within the same trading session, with all positions closed before the market ends. Traders aim to take advantage of short-term price fluctuations using fast decision-making and technical analysis. Intraday trading is highly active and often relies on chart patterns, volume analysis, momentum indicators, and market news to identify quick trading opportunities.
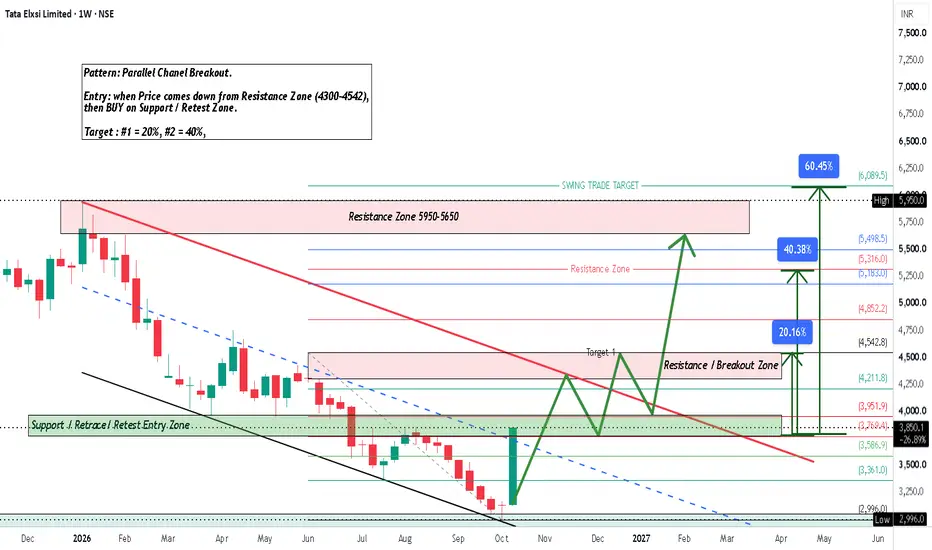
Tata Elxsi – Weekly Analysis – 20% to 60% UPSIDE Potential...NSE:TATAELXSI
Tata Elxsi Limited is forming a potential multi-month turnaround setup on the weekly chart following an extended corrective phase from its peak near ₹5,950.00 . The stock recently tested a structural base low at ₹2,996.00 along the lower boundary of a long-term **Parallel Channel Breakout** structure. Currently trading at ₹3,850.10 (+23.01%), price is rebounding sharply inside the Support / Retrace / Retest Entry Zone ( ₹3,586.90 – ₹3,951.90 ). According to the chart pla
Hindustan Organic Chemicals cmp 56.34 Weekly Chart since listedHindustan Organic Chemicals cmp 56.34 Weekly Chart since listed
- Support Zone 36 to 52 price band
- Resistance Zone 60 to 75 price band
- Stronger Resistance Zone 60 to 65 price band
- Price rejection done multiple times at Resistance Zone
- Heavy Volumes required to Break Strong Resistance Zone
- Will the Stock make a Breakout or repeat the Breakdown again ???
TCS – Daily Analysis – 10% to 37.15% UPSIDE PotentialNSE:TCS
Tata Consultancy Services Limited (TCS) is establishing a major double-bottom reversal on the daily chart following an extended corrective move from its peak at ₹3,350.00 . The stock built a clean **W Pattern Breakout** structure supported by the **Bottom Entry Zone** around ₹1,976.80 – ₹2,060.00 , with the High of Lowest Candle acting as structural support and early entry validation. Currently trading at ₹2,465.00 (+4.89%), price has executed a sharp breakout above its local t
Indian Hotels: Short term trade➡️Mark Minervini trend template candidate.
➡️Has broken through the supply zone convincingly.
➡️International disruptions may have benefitted the scrip during this quarter.
➡️Rating upgraded to AAA.
➡️Decent financials.
Cons:
➡️Results during the week may increase volatility.
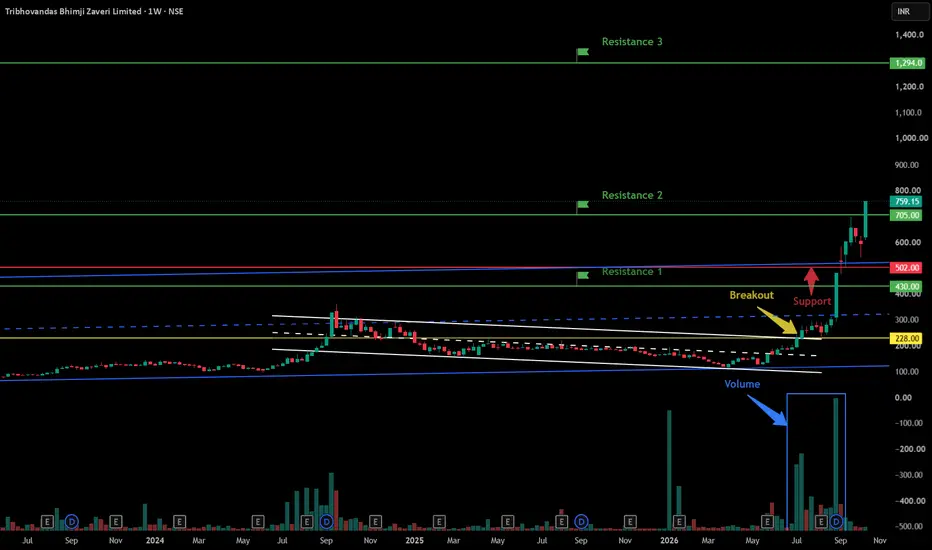
Tribhovandas Bhimji Zaveri Ltd - Breakout Setup, Move is ON...#TBZ trading above Resistance of 705
Next Resistance is at 1294
Support is at 502
Here are previous charts:
This weekly chart for Tribhovandas Bhimji Zaveri Limited displays a strong bullish breakout from a consolidation pattern, supported by significant volume and long-term trendline context.
Chart Overview
Timeframe & Asset: Tribhovandas Bhimji Zaveri Ltd. (1-Week Chart, NSE).
Current Price: 759.15 INR (+27.60% change shown on the chart header).
Key Technical Observations
Horizo
West Coast Paper Mills Weekly Close Above the 2024 High 📈
**Timeframe:** Weekly | **CMP:** ₹840.00 (+15.44% on the week)
## The setup
After a long downtrend from the 2024 highs, West Coast Paper Mills found a floor at **₹376.85** in early 2025 and retested it in early 2026 without breaking it. That double bottom began a steady, orderly uptrend, with higher highs and higher lows through 2026.
This week's candle ran **₹730 → ₹978.05** and closed at **₹840.00**, a gain of over 15%. The stock has now closed above the
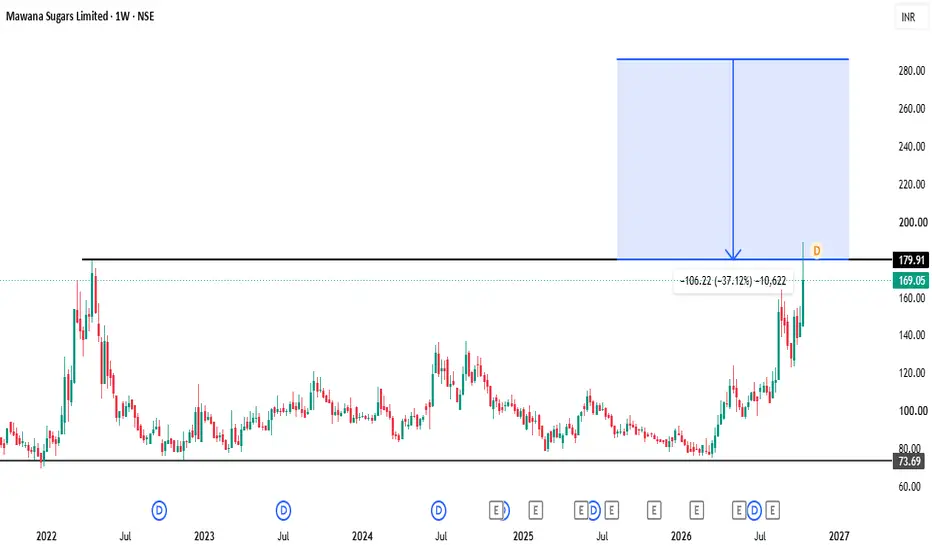
Mawana Sugars (NSE: MAWANASUG)# Mawana Sugars (NSE: MAWANASUG): Knocking on the Door of a 4-Year Resistance 🚀
**Timeframe:** Weekly | **CMP:** ₹169.05 (+15.44% on the week)
## The setup
Mawana Sugars has spent most of the last four years stuck in a wide range. Support sits at **₹73.69**, which held in early 2026, and the ceiling is at **₹179.91**, the high from 2022 that has capped every rally since.
After basing near ₹75-80 for months, the stock broke out of that structure in mid-2026 with a strong run of weekly candles
Kotak Mahindra Bank – Daily Chart Analysis | Breakout Watch**Kotak Mahindra Bank – Daily Chart Analysis | Breakout Watch📈**
Kotak Mahindra Bank is showing strong bullish momentum after breaking above a descending trendline and the resistance zone around ₹440–₹444.
🔍 **Key observations:**
- **Trendline breakout:** Price has moved above the descending resistance trendline.
- **Resistance breakout:** The stock is trading above the ₹444 level.
- **Volume:** Recent price action shows increased trading volume, supporting the breakout.
- **Next levels to wa
BUY TODAY SELL TOMORROW for 5%DON’T HAVE TIME TO MANAGE YOUR TRADES?
- Take BTST trades at 3:25 pm every day
- Try to exit by taking 4-7% profit of each trade
- SL can also be maintained as closing below the low of the breakout candle
Now, why do I prefer BTST over swing trades? The primary reason is that I have observed that 90% of the stocks give most of the movement in just 1-2 days and the rest of the time they either consolidate or fall
Trendline breakout in VAKRANGEE
BUY TODAY SELL TOMORROW for 5%
Is this the Right TIme to Invest in IT Stocks + World Markets Apoorv Dubey, SEBI Registered Research Analyst
Disclaimer:
This video is for educational and informational purposes only and is not a recommendation to buy, sell or hold any security. Investments in securities markets are subject to market risks. Read all related documents carefully before investing. Registration granted by SEBI and certification from NISM in no way guarantee the performance of the intermediary or provide any assurance of returns to investors.
Topics
-Discussed about IT pack
KWALITY WALLS: ELLIOTT WAVE COUNT & BREAKOUT SETUPSymbol: KWALITY WALLS (NSE)
Timeframe: 1D
CMP: ₹38.70
Technical Analysis
Kwality Walls is at a crucial technical juncture following a strong impulsive advance from the ₹22.24 base to the ₹50.68 high. The current price structure appears to be developing a corrective Wave 4, with price testing an important support and potential accumulation zone around ₹34.70–₹38.00.
Elliott Wave Structure
The preferred Elliott Wave interpretation suggests that Wave 1 and Wave 2 have completed, followed by
Reliance – Daily Analysis – 5 to 20% UPSIDE PotentialNSE:RELIANCE
Reliance Industries Limited is setting up a technical trendline breakout and accumulation base structure on the daily chart following an extended corrective move from its 52-week peak at ₹1,611.80 . Price recently swept into a deep demand floor to form a major base low at ₹1,152.20 inside the primary SUPPORT ZONE ( ₹1,120.00 – ₹1,160.00 ). Currently trading at ₹1,211.20 (-0.31%), price is consolidating inside the Buying / Investing Zone , coiling directly beneath its lon
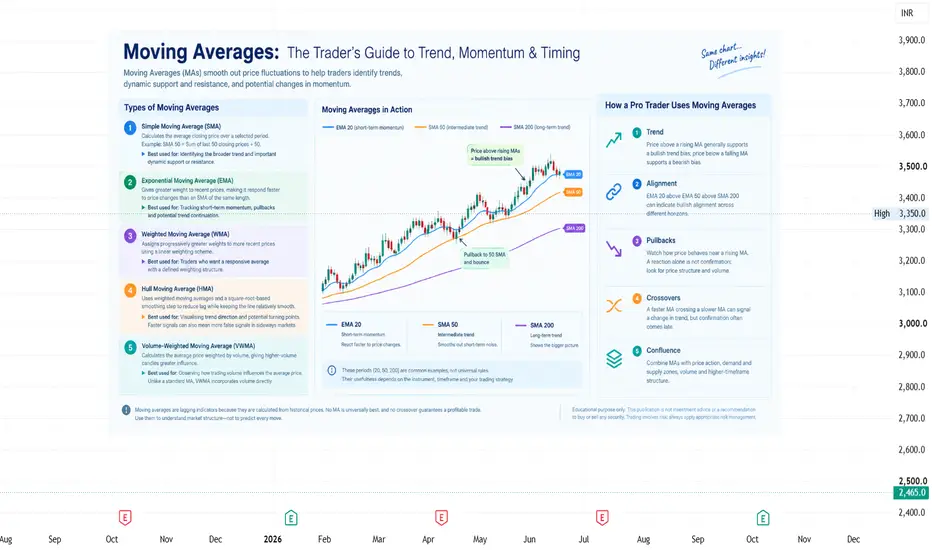
Moving Averages: The Trader’s Guide to Trend, Momentum & TimingMoving Averages: The Trader’s Guide to Trend, Momentum & Timing
Moving Averages (MAs) smooth price fluctuations to help traders identify trends, dynamic support and resistance, and potential changes in momentum.
But not all moving averages work the same way. Understanding their differences helps you use them with purpose rather than adding more lines to your chart.
1. Simple Moving Average (SMA)
Calculates the average closing price over a selected period.
Example: SMA 50 = Sum of the l