• Products
  • Community
  • Markets
  • Brokers
  • More
Get started
  • Markets
  • /World stocks
  • /Ideas
BUY TODAY SELL TOMORROW for 5% - Take BTST trades at 3:25 pm every day - Try to exit by taking 4-7% profit of each trade - SL can also be maintained as closing below the low of the breakout candle Now, why do I prefer BTST over swing trades? The primary reason is that I have observed that 90% of the stocks give most of the movement in just 1-2 days and the rest of the time they either consolidate or fall Resistance breakout in ARIES BUY TODAY SELL TOMORROW for 5%
NSE:ARIES
by Kapil-Mittal
Updated
4
BUY TODAY SELL TOMORROW for 5% DON’T HAVE TIME TO MANAGE YOUR TRADES? - Take BTST trades at 3:25 pm every day - Try to exit by taking 4-7% profit of each trade - SL can also be maintained as closing below the low of the breakout candle Now, why do I prefer BTST over swing trades? The primary reason is that I have observed that 90% of the stocks give most of the movement in just 1-2 days and the rest of the time they either consolidate or fall Round bottom breakout in SINGERIND BUY TODAY SELL TOMORROW for 5%
NSE:SINGERIND
by Kapil-Mittal
Updated
3
BUY TODAY SELL TOMORROW for 5% DON’T HAVE TIME TO MANAGE YOUR TRADES? - Take BTST trades at 3:25 pm every day - Try to exit by taking 4-7% profit of each trade - SL can also be maintained as closing below the low of the breakout candle Now, why do I prefer BTST over swing trades? The primary reason is that I have observed that 90% of the stocks give most of the movement in just 1-2 days and the rest of the time they either consolidate or fall Trendline breakout in GANDHITUBE BUY TODAY SELL TOMORROW for 5%
NSE:GANDHITUBE
by Kapil-Mittal
Updated
2
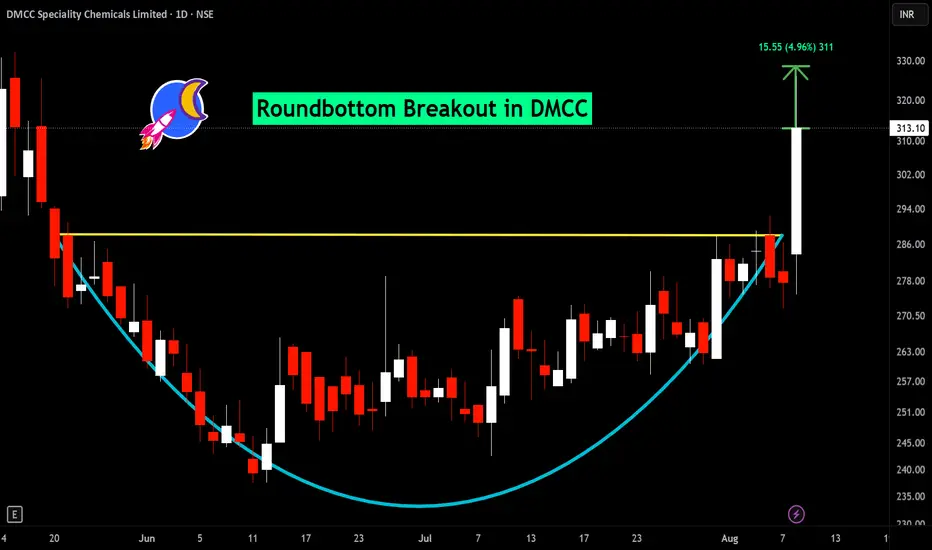
BUY TODAY SELL TOMORROW for 5% DON’T HAVE TIME TO MANAGE YOUR TRADES? - Take BTST trades at 3:25 pm every day - Try to exit by taking 4-7% profit of each trade - SL can also be maintained as closing below the low of the breakout candle Now, why do I prefer BTST over swing trades? The primary reason is that I have observed that 90% of the stocks give most of the movement in just 1-2 days and the rest of the time they either consolidate or fall Round bottom breakout in DMCC BUY TODAY SELL TOMORROW for 5%
NSE:DMCC
by Kapil-Mittal
Updated
2
BUY TODAY SELL TOMORROW for 5%DON’T HAVE TIME TO MANAGE YOUR TRADES? - Take BTST trades at 3:25 pm every day - Try to exit by taking 4-7% profit of each trade - SL can also be maintained as closing below the low of the breakout candle Now, why do I prefer BTST over swing trades? The primary reason is that I have observed that 90% of the stocks give most of the movement in just 1-2 days and the rest of the time they either consolidate or fall Trendline breakout in SYNCOMF BUY TODAY SELL TOMORROW for 5%
NSE:SYNCOMF
by Kapil-Mittal
Updated
2
BUY TODAY SELL TOMORROW for 5% DON’T HAVE TIME TO MANAGE YOUR TRADES? - Take BTST trades at 3:25 pm every day - Try to exit by taking 4-7% profit of each trade - SL can also be maintained as closing below the low of the breakout candle Now, why do I prefer BTST over swing trades? The primary reason is that I have observed that 90% of the stocks give most of the movement in just 1-2 days and the rest of the time they either consolidate or fall Cup and handle breakout in MATRIMONY BUY TODAY SELL TOMORROW for 5%
NSE:MATRIMONY
by Kapil-Mittal
Updated
2
BUY TODAY SELL TOMORROW for 5%DON’T HAVE TIME TO MANAGE YOUR TRADES? - Take BTST trades at 3:25 pm every day - Try to exit by taking 4-7% profit of each trade - SL can also be maintained as closing below the low of the breakout candle Now, why do I prefer BTST over swing trades? The primary reason is that I have observed that 90% of the stocks give most of the movement in just 1-2 days and the rest of the time they either consolidate or fall Trendline breakout in SHILPAMED BUY TODAY SELL TOMORROW for 5%
NSE:SHILPAMED
by Kapil-Mittal
Updated
6
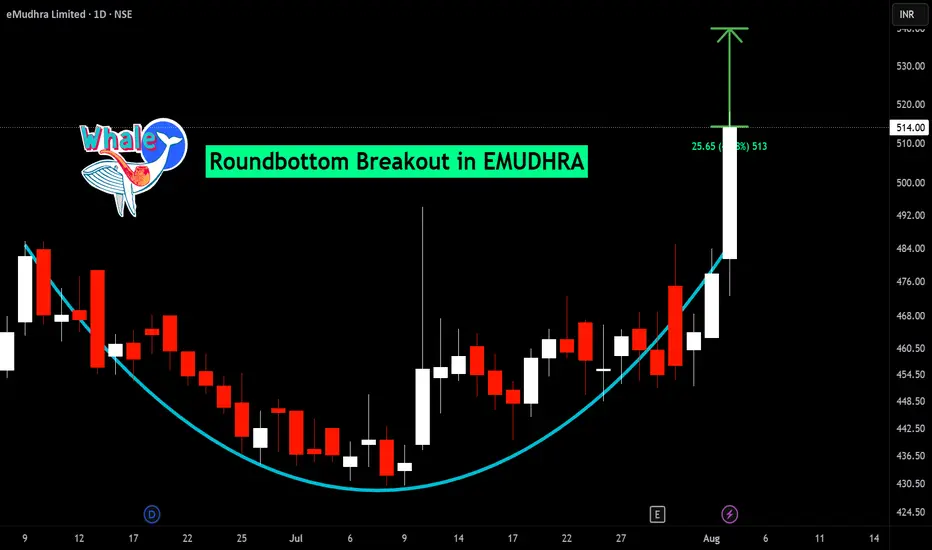
BUY TODAY SELL TOMORROW for 5%DON’T HAVE TIME TO MANAGE YOUR TRADES? - Take BTST trades at 3:25 pm every day - Try to exit by taking 4-7% profit of each trade - SL can also be maintained as closing below the low of the breakout candle Now, why do I prefer BTST over swing trades? The primary reason is that I have observed that 90% of the stocks give most of the movement in just 1-2 days and the rest of the time they either consolidate or fall Roundbottom breakout in EMUDHRA BUY TODAY SELL TOMORROW for 5%
NSE:EMUDHRA
by Kapil-Mittal
Updated
3
BUY TODAY SELL TOMORROW for 5%DON’T HAVE TIME TO MANAGE YOUR TRADES? - Take BTST trades at 3:25 pm every day - Try to exit by taking 4-7% profit of each trade - SL can also be maintained as closing below the low of the breakout candle Now, why do I prefer BTST over swing trades? The primary reason is that I have observed that 90% of the stocks give most of the movement in just 1-2 days and the rest of the time they either consolidate or fall Triple bottom breakout in DCI BUY TODAY SELL TOMORROW for 5%
NSE:DCI
by Kapil-Mittal
Updated
2
VENUSPIPES Technical Analysis & Setup Symbol: VENUSPIPES (Venus Pipes & Tubes Ltd.) — Daily Timeframe (NSE) Current Price: ₹1,805.40 Market Structure: Following a pullback into a solid local support base around ₹1,600, the stock formed a sharp bullish momentum expansion candle, signaling a strong reversal back toward its major high structure. Key Technical Levels Entry Level: ~₹1,800.00 – ₹1,805.00 (Breakout entry level) Stop Loss (SL): Below ₹1,610.00 (Marked near local swing low support) Immediate
NSE:VENUSPIPESLong
by QuantumX-Pro
Updated
Gujarat Pipavav Is Getting Ready for a Major Trend ReversalThe stock is developing a very interesting multiyear symmetrical triangle pattern on the weekly chart and the stock is now approaching one of its most important breakout zones. After making a major high near 245 in 2024 the stock entered a prolonged correction where every recovery faced selling pressure near the descending trendline. But the interesting part is that despite this selling pressure buyers have continued defending the rising support trendline which has been respected since 2022. Eve
NSE:GPPLLong
by Marketik
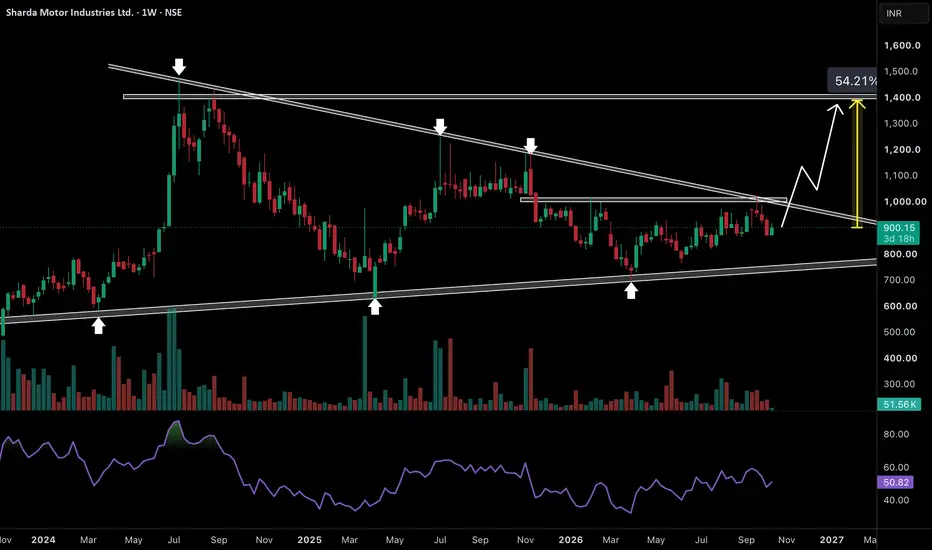
A 54% Rally Could Be Building Inside This TriangleSharda Motor is developing a very interesting multiyear symmetrical triangle pattern on the weekly chart and the stock is now approaching a crucial breakout stage. Since July 2024 every major recovery has faced rejection near the descending resistance trendline while buyers have continued defending the rising support trendline. This has gradually created a compression structure where selling pressure from the top is meeting accumulation from the bottom. What makes this setup interesting is that
NSE:SHARDAMOTRLong
by Marketik
A 9-Year Resistance Is About to Face Its Biggest TestThe stock is approaching one of the most important breakout zones on its weekly chart. The 1200 level has been acting as major resistance since April 2018 and even the strong rally in September 2024 failed to sustain above this zone. But the current structure looks much more promising because buyers have been building a series of higher lows since May 2022 while respecting a long-term ascending trendline. Even during the correction in March 2026 the stock found strong buying interest near this t
NSE:PNBHOUSINGLong
by Marketik
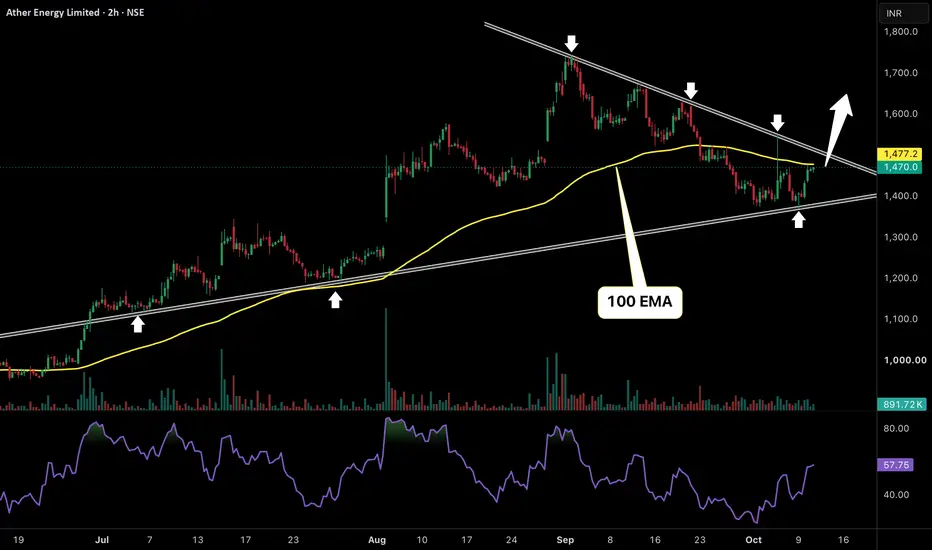
Ather Energy Is Building Pressure For a Strong Bullish ReversalAther Energy is developing a very interesting symmetrical triangle pattern on the 2-hour chart and the stock is now approaching a crucial breakout zone. After making a high near 1750 in September the stock started forming lower highs as sellers repeatedly rejected every recovery near the descending resistance trendline. But what makes this structure interesting is that buyers have continued defending the rising support trendline which has been respected multiple times since July. This means sell
NSE:ATHERENERGLong
by Marketik
BUY TODAY SELL TOMORROW for 5%DON’T HAVE TIME TO MANAGE YOUR TRADES? - Take BTST trades at 3:25 pm every day - Try to exit by taking 4-7% profit of each trade - SL can also be maintained as closing below the low of the breakout candle Now, why do I prefer BTST over swing trades? The primary reason is that I have observed that 90% of the stocks give most of the movement in just 1-2 days and the rest of the time they either consolidate or fall Triple bottom breakout in PRIMESECU BUY TODAY SELL TOMORROW for 5%
NSE:PRIMESECU
by Kapil-Mittal
2
CarTrade Is One Breakout Away From a Powerful RallyStock is showing a very strong bullish structure on the daily chart and now the stock is again testing its major resistance around 3200–3250. This is the same zone where buyers faced rejection twice in the past. But this time the structure looks much stronger. After recovering from its major bottom near 1600 the stock reclaimed the 2600 resistance zone and successfully converted it into support. Since then buyers have been maintaining higher levels while the 100 EMA continues to provide dynamic
NSE:CARTRADELong
by Marketik
1
Goodluck India Is Preparing For A Powerful ExpansionThe stock is showing a very interesting structure on the weekly chart. For almost 3 years the stock has been moving inside a broad ascending channel where every major correction has attracted buyers near the lower trendline while the upper trendline has repeatedly acted as resistance. What makes the current setup interesting is that price has gradually started forming higher highs and higher lows with strong buying momentum. Earlier attempts to cross the upper boundary faced rejection but this t
NSE:GOODLUCKLong
by Marketik
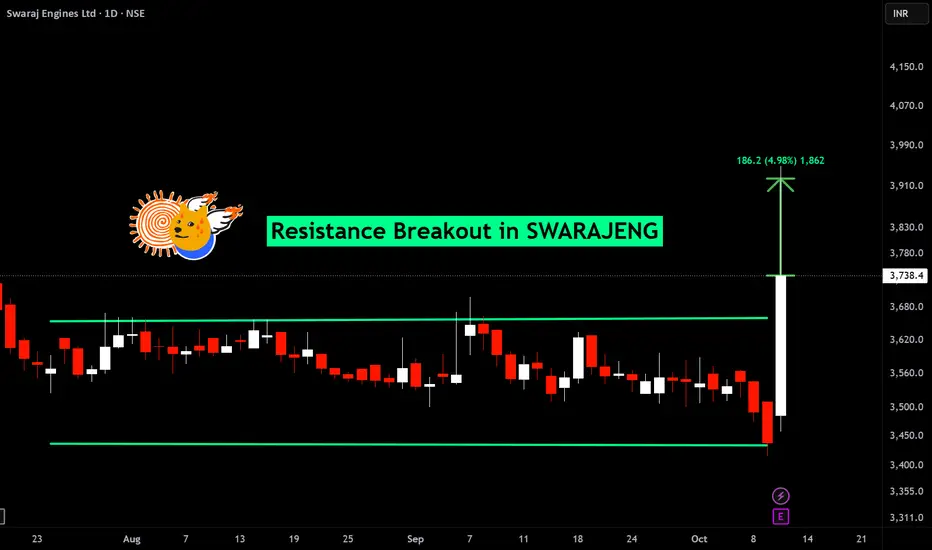
BUY TODAY SELL TOMORROW for 5%DON’T HAVE TIME TO MANAGE YOUR TRADES? - Take BTST trades at 3:25 pm every day - Try to exit by taking 4-7% profit of each trade - SL can also be maintained as closing below the low of the breakout candle Now, why do I prefer BTST over swing trades? The primary reason is that I have observed that 90% of the stocks give most of the movement in just 1-2 days and the rest of the time they either consolidate or fall Resistance breakout in SWARAJENG BUY TODAY SELL TOMORROW for 5%
NSE:SWARAJENG
by Kapil-Mittal
2
XtraNet Technologies Ltd. ...........enjoy but be cautious;;)))NSE:XTRANET Indian IT services and consulting company. Company has a good return on equity track record 3 years ROE 37.6%. Thoughts......we are in correction phase. Indian market has to be decline more but IT sector looks good. Xtranet completed it's 3rd wave we are in 4rth or advance 5th wave. 5th wave can lead xtranet to 370 to 450. after that prepare yourself we can see 250 again NOTE::::Not a buy sell recommendation
XLong
by ladesar88
How to Analyse Sugar Sector Stocks ? ( Part 1) In Part 1, I analyse five sugar-sector stocks using price action, market structure, and key support and resistance levels, explaining how you can apply the same approach yourself. For educational purposes only. This video does not provide a buy, sell, or hold recommendation. Investments in securities are subject to market risk. Nothing is Guaranteed in Markets .
NSE:UTTAMSUGARLong
20:01
by Apoorv-Dubey_SEBI-RA
4
Shringar House of Mangalsutra (D): MASSIVE 20% BREAKOUTTimeframe: Daily | Chart Scale: Linear Explosive +20.00% surge today backed by a massive 12.95M volume spike! 🔥 Technical Highlights: ✅ Breakout: Cleared & closed above short-term angular resistance (active since May '26). ✅ Volume: Surging volume trend over the past few days confirms heavy buyer interest! ⚠️ Caution: Given the extreme 20% move, watch out for near-term profit booking. ✅ Momentum: Short-term EMAs in positive crossover (Daily/Weekly). MACD & RSI rising. 🚀 Ke
NSE:SHRINGARMS
by Learn_with_Pth0mas
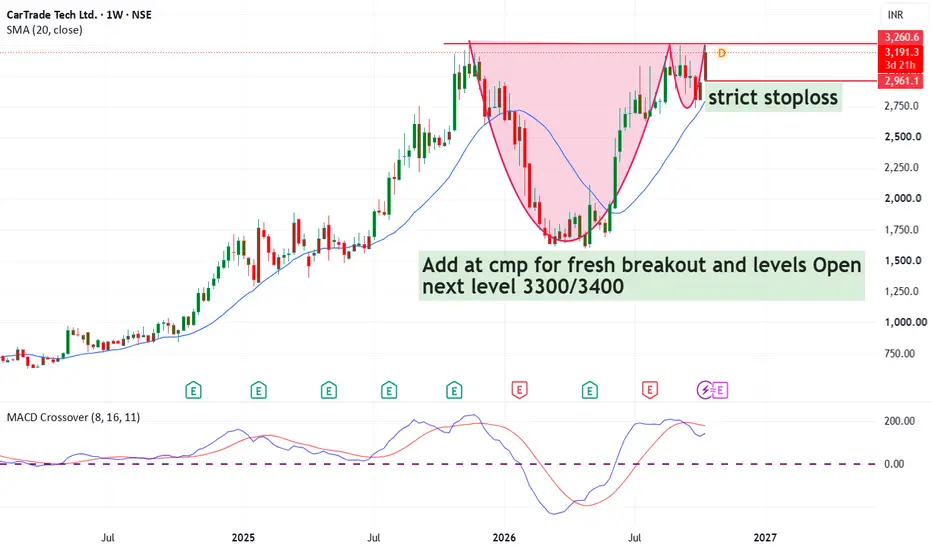
#Cartrade Ready for fresh breakout Add at cmp for fresh breakout and levels Open next level 3300/3400 strcit stoploss on chart...follow
NSE:CARTRADE
by AsheshBajpaiEsm
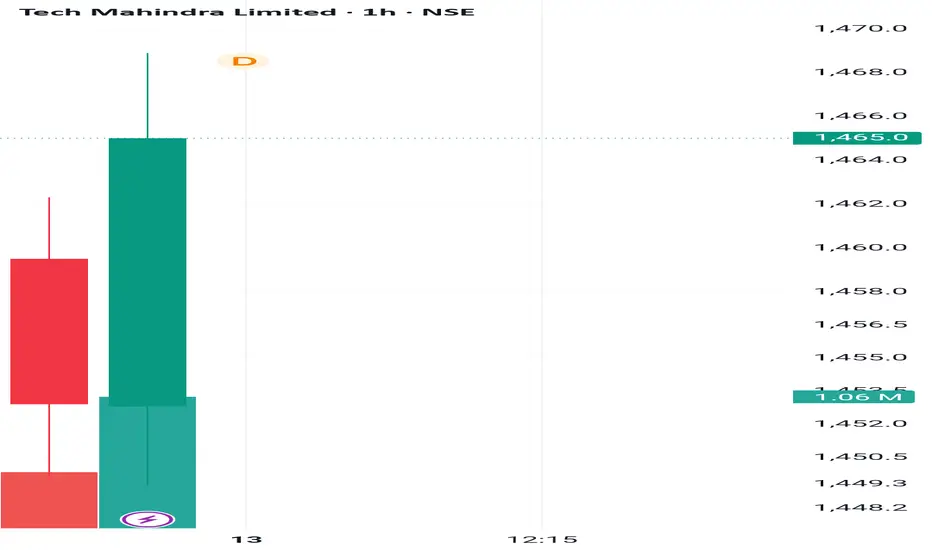
Tech Mahindra elliot wave analysisStrategic Elliott Wave Investment Proposal: Tech Mahindra Ltd. (Monthly Outlook) Executive Summary This proposal outlines a rigorous Elliott Wave and time-cycle analysis for Tech Mahindra Ltd. Based on multi-year structural dynamics, the asset has completed a major multi-decade impulse cycle and is currently navigating a prolonged, complex corrective phase. Understanding this structural trajectory allows investors to optimize capital deployment, anticipate downside boundaries, and position strat
NSE:TECHMShort
by Mr_digeshpatel
4
TECH MAHINDRA FUTURE PRICE PROJECTION ACCORDING TO ELLIOT WAVE.Strategic Elliott Wave Investment Proposal: Tech Mahindra Ltd. (Monthly Outlook) Executive Summary This proposal outlines a rigorous Elliott Wave and time-cycle analysis for Tech Mahindra Ltd. Based on multi-year structural dynamics, the asset has completed a major multi-decade impulse cycle and is currently navigating a prolonged, complex corrective phase. Understanding this structural trajectory allows investors to optimize capital deployment, anticipate downside boundaries, and position strat
NSE:TECHM
by Mr_digeshpatel
3
123456789101112131415161718192021222324252627282930313233343536373839404142
…999

Made by humans

Select market data provided by ICE Data Services. Select reference data provided by FactSet. Copyright © 2026 FactSet Research Systems Inc.Copyright © 2026, American Bankers Association. CUSIP Database provided by FactSet Research Systems Inc. All rights reserved. SEC filings and other documents provided by Quartr.© 2026 TradingView, Inc.

SOC 2 CompliantGDPR Compliant
More than a product
  • Supercharts
Screeners
  • Stocks
  • ETFs
  • Bonds
  • Crypto coins
  • CEX pairs
  • DEX pairs
  • Pine
Heatmaps
  • Stocks
  • ETFs
  • Crypto coins
Calendars
  • Economic
  • Earnings
  • Dividends
  • IPOs
More products
  • News Flow
  • Portfolios
  • Fundamental Graphs
  • Yield Curves
  • Options
  • Macro Maps
  • Pine Script®
  • MCP Server
Apps
  • Mobile
  • Desktop
Community
  • Social network
  • Wall of Love
  • Refer a friend
  • Creator program
  • House Rules
  • Moderators
Ideas
  • Trading
  • Education
  • Editors' picks
Pine Script
  • Indicators & strategies
  • Wizards
  • Freelancers
  • Marketplace
Tools & subscriptions
  • Features
  • Pricing
  • Market data
  • Gift plans
Trading
  • Overview
  • Brokers
  • Brokers comparison
  • The Leap
Special offers
  • CME Group futures
  • Eurex futures
  • US stocks bundle
About company
  • Who we are
  • Space mission
  • Blog
  • Help Center
  • Careers
  • Media kit
Merch
  • Tarot cards for traders
  • The C63 TradeTime
Policies & security
  • Terms of Use
  • Disclaimer
  • Privacy Policy
  • Cookies Policy
  • Accessibility Statement
  • Trust Center
  • Security tips
  • Bug Bounty program
  • Status page
Business solutions
  • Widgets
  • Charting libraries
  • Lightweight Charts™
  • Advanced Charts
  • Trading Platform
Growth opportunities
  • Advertising
  • Brokerage integration
  • Partner program
  • Education program
Community
  • Social network
  • Wall of Love
  • Refer a friend
  • Creator program
  • House Rules
  • Moderators
Ideas
  • Trading
  • Education
  • Editors' picks
Pine Script
  • Indicators & strategies
  • Wizards
  • Freelancers
  • Marketplace
Business solutions
  • Widgets
  • Charting libraries
  • Lightweight Charts™
  • Advanced Charts
  • Trading Platform
Growth opportunities
  • Advertising
  • Brokerage integration
  • Partner program
  • Education program
Look FirstLook First