Echoes of the Past!Pattern Structure: The chart illustrates a distinct cyclic behavior for V-Mart Retail Ltd. Descending structures marked by compressing volatility repeatedly resolve into decisive breakouts, showcasing a repeating pattern in market sentiment.
Volume Analysis: A notable surge in buying volume accompanies the breakout, adding strong conviction to the move and validating the bullish reversal.
Supply and Demand: Observe the key flip zone on the chart, where previous resistance levels now function a
Can Shah Rukh Khan save this stock?Idea CMP 13
Elliott- we have two back to back ones and twos and that's not good news. This means that we will have a huge 3rd wave.
Bar analysis - unable to move above the previous bar high is failure.
Expansion or contraction - the 50% fib marked in red is the mid point of the move. If the stock is expanding then the 2 lines marked in blue should fall above the red line. In this case they are below. This is telling me the stock is contracting.
Conclusion - I will suggest to exit
Nifty & Midcap Outlook + 4 Stocks to Watch | October 2nd weekNifty and Midcap index view with key support and resistance levels, plus a technical breakdown of 4 stocks and how I analyse them. Watch to see how the market structure looks for the coming sessions.
For educational purposes only, not a buy/sell recommendation . Stocks showcased were to show how I track stocks and analyse them so that you can also do the same or approach it that ways.
SUZLON ENERGY.....IS CORRECTION OVER NOW?NSE:SUZLON
Retailer favorite energy stock.be like ye dukh kahe nahi khatam ho raha.
Order Book: Strong cumulative order book exceeding 6.1 GW, featuring major marquee clients like Waaree, Torrent, and Tata Power.
CMP 37.60
My thoughts.......》》in my analysis suzlon is at there support.if this zone 36 to 34 hold then we can see a good bounce which may be later adjusted by index decline. Energy sector can go for further correction so there should e mild pressure on suzlon,over all good price t
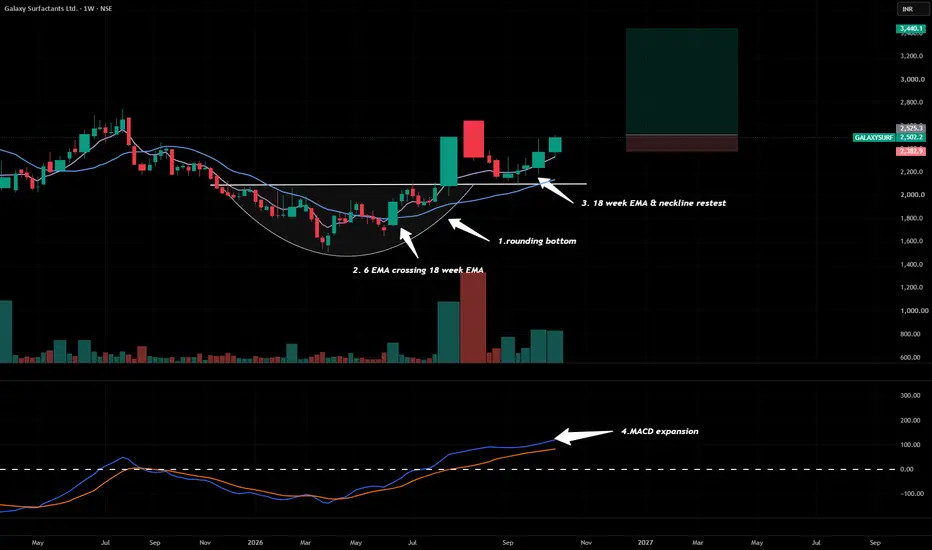
GalaxySurfactants-Long for 40 %**GALAXY SURFACTANTS – BULLISH WEEKLY SETUP 📈**
1. **Rounding Bottom Formation:** A well-defined rounding bottom suggests a potential long-term trend reversal from bearish to bullish.
2. **Bullish EMA Crossover:** The 6-week EMA has crossed above the 18-week EMA, indicating improving medium-term momentum.
3. **Successful Neckline Retest:** Price has reclaimed the ₹2,100 zone and successfully retested it as support, strengthening the bullish structure.
4. **Higher Highs & Higher Lows:** The r
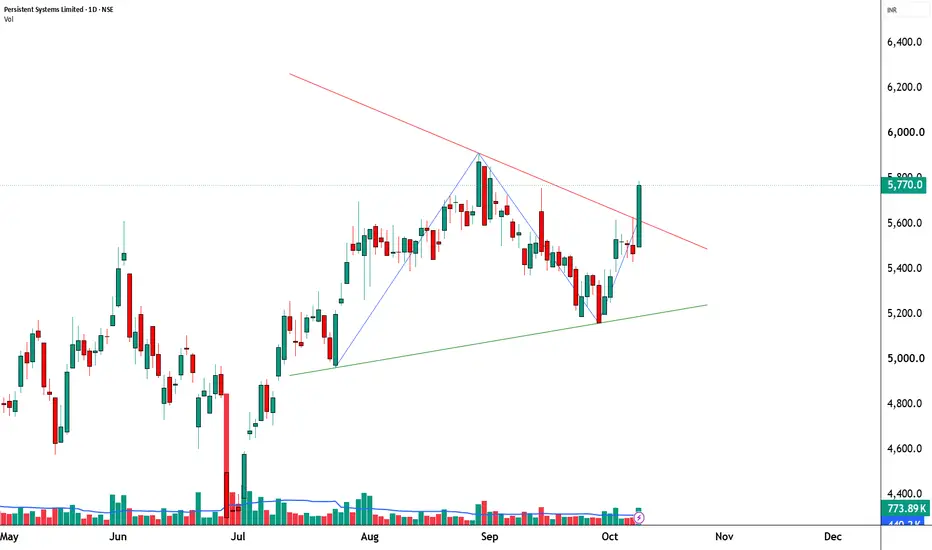
PERSISTENT Symmetrical Triangle Breakout with Strong Volume🔥 Persistent Systems: Symmetrical Triangle Breakout with Strong Volume
📊 MARKET STRUCTURE SNAPSHOT | NSE: PERSISTENT | DAILY
Closing Price: 5,770.00 (+5.52%)
Core Trend: Bullish
Market State: Range Expansion / Breakout Attempt
Chart Pattern: Symmetrical Triangle — Bullish Breakout Attempt
Candlestick Pattern: Strong Bullish Candle
Price Structure: Price has moved sharply above the descending upper boundary of a multi-week symmetrical triangle, following a recovery from the rising lower boundary.
BLUESTARCO – Weekly Analysis – 10% to 20% UPSIDE Potential.NSE:BLUESTARCO
Blue Star Limited is demonstrating strong upside momentum on the weekly chart after completing a multi-week consolidation phase. The chart highlights an active **Inside Candle Breakout Pattern** following a test of structural support near ₹1,432.30 , accompanied by a continuation push currently trading at ₹1,574.00 (+7.84%). Price has successfully crossed above the diagonal downtrend resistance line and is testing the primary Inside Candle Breakout Entry level at ₹1,561.
SEPC Ltd (W): MAJOR BOTTOM REVERSALTimeframe: Weekly | Chart Scale: Logarithmic
Constructive +3.94% weekly surge backed by a massive 97.38M volume spike! 🔥
Technical Highlights:
✅ Reversal Pattern: Formed a classic double-bottom at multi-year support (active since Aug 2020!).
✅ Price Action: Bullish hamme r candlestick confirmed right at the support floor.
✅ Volume: Massive volume spike reversing a recent "dry volume" trend.
⚠️ Caution: Short-term EMAs still negative, but MACD & RSI are curling up! 🚀
Key Level
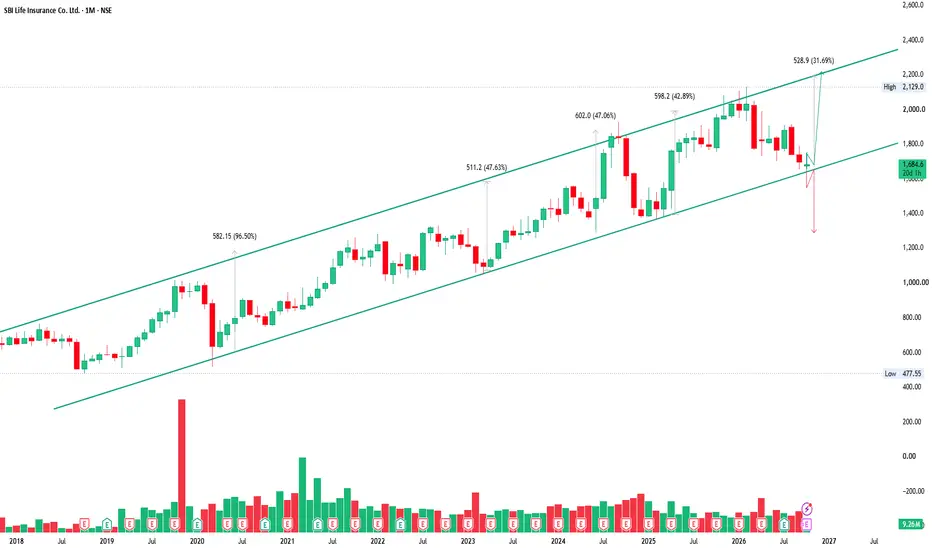
SBI LIFE: 8-YEAR CHANNEL SUPPORT — REVERSAL OR BREAKDOWN?SBI Life is approaching a critical zone on the weekly chart: the lower boundary of its multi-year ascending channel.
The stock has broadly respected this rising channel since 2018, with several major rallies and corrections unfolding within its boundaries.
After reaching a high near ₹2,129, the stock has corrected sharply and is now trading around ₹1,685.
The key zone I'm watching is ₹1,650–₹1,700.
📊 Why this zone matters
This is not just an ordinary support level. It represents the lower b
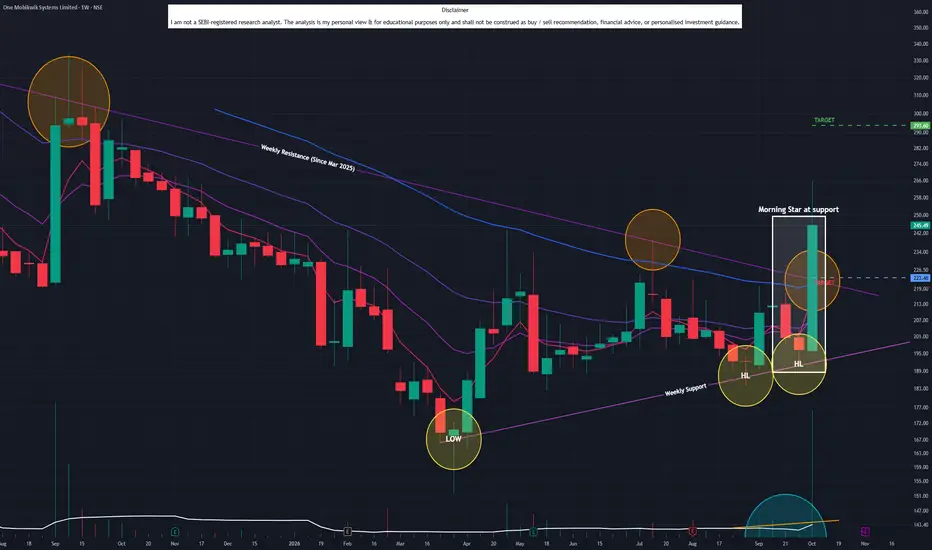
One Mobikwik Systems (W): MASSIVE REVERSAL & BREAKOUTTimeframe: Weekly | Chart Scale: Logarithmic
Explosive +25.10% weekly surge backed by a huge 181.86M volume spike! 🔥
Technical Highlights:
✅ Reversal: Formed a bullish Morning Star pattern at support!
✅ Breakout: Cleared & closed above long-term angular resistance (active since Mar '25).
✅ Volume: Surging volume confirms heavy buyer accumulation.
✅ Momentum: Daily EMA positive crossover . MACD & RSI rising. 🚀
Key Levels to Watch:
🎯 Target: 292
🛡️ Support / Pullback: 223
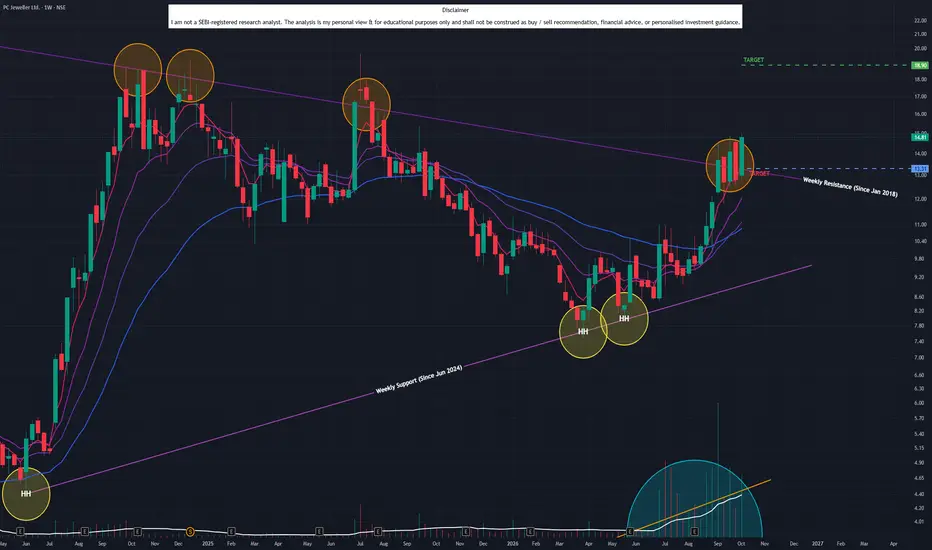
PC Jeweller (W): MULTI-YEAR BREAKOUTTimeframe: Weekly | Chart Scale: Logarithmic
Explosive +15.52% weekly surge backed by an ASTONISHING 2.3 Billion volume! 🔥
Technical Highlights:
✅ Breakout: Cleared & closed above a massive long-term angular resistance (active since Jan 2018!).
✅ Volume: Historic volume surge confirming heavy buyer accumulation.
✅ Momentum: Short-term EMAs in positive crossover (Daily/Weekly/Monthly). MACD & RSI rising. 🚀
Key Levels to Watch:
🎯 Target: 19
🛡️ Support / Pullback: 13.31 (P
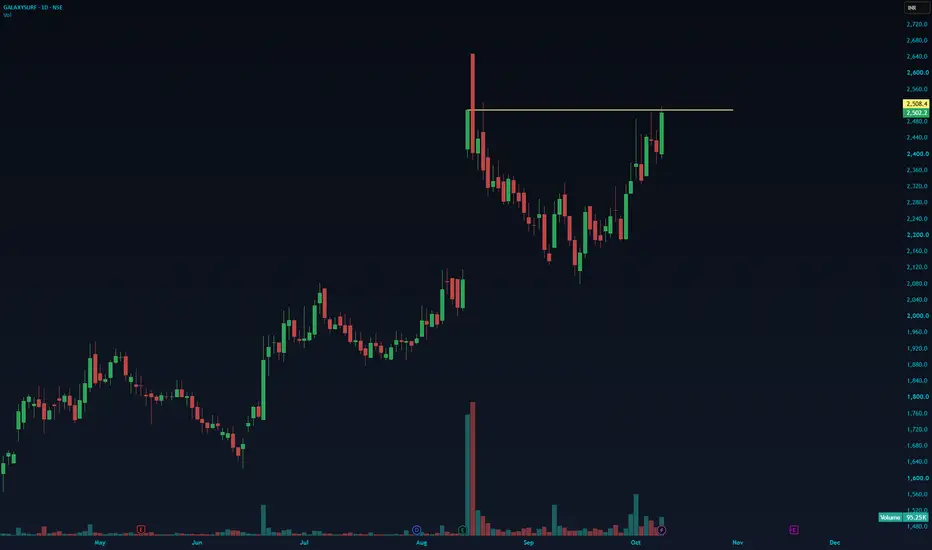
GALAXYSURF | Bullish Breakout Watch**GALAXYSURF | Bullish Breakout Watch 📈**
GALAXYSURF is showing a strong recovery and is now testing a crucial resistance zone near ₹2,508.
A decisive breakout above this level with sustained volume could signal further upside.
**Key resistance:** ₹2,508
**Bullish trigger:** Breakout and daily close above resistance.
**Risk:** Rejection could lead to short-term consolidation.
Watch for confirmation before taking a long position.
#GALAXYSURF #NSE #SwingTrading #PriceAction
BLUSPRING | Bullish Breakout Watch **BLUSPRING | Bullish Breakout Watch 📈**
BLUSPRING is maintaining a strong daily uptrend and consolidating near resistance at ₹152.50.
A decisive breakout above ₹152.50 with strong volume could open the door for further upside.
**Key resistance:** ₹152.50
**Bullish trigger:** Breakout with volume confirmation.
**Risk:** Rejection could lead to further consolidation.
Watch for confirmation before taking a long position.
#BLUSPRING #NSE #SwingTrading #PriceAction
GANDHAR | Bullish Breakout Watch**GANDHAR | Bullish Breakout Watch 📈**
GANDHAR is testing a crucial resistance zone near ₹300 on the daily chart after a strong uptrend.
A sustained breakout above ₹300, supported by strong volume, could open the door for further upside.
**Key level:** ₹300
**Bullish trigger:** Breakout and sustained closing above resistance.
**Risk:** Rejection could lead to short-term consolidation.
Watch for confirmation before entering.
#GANDHAR #NSE #SwingTrading #PriceAction
BUY TODAY SELL TOMORROW for 5%DON’T HAVE TIME TO MANAGE YOUR TRADES?
- Take BTST trades at 3:25 pm every day
- Try to exit by taking 4-7% profit of each trade
- SL can also be maintained as closing below the low of the breakout candle
Now, why do I prefer BTST over swing trades? The primary reason is that I have observed that 90% of the stocks give most of the movement in just 1-2 days and the rest of the time they either consolidate or fall
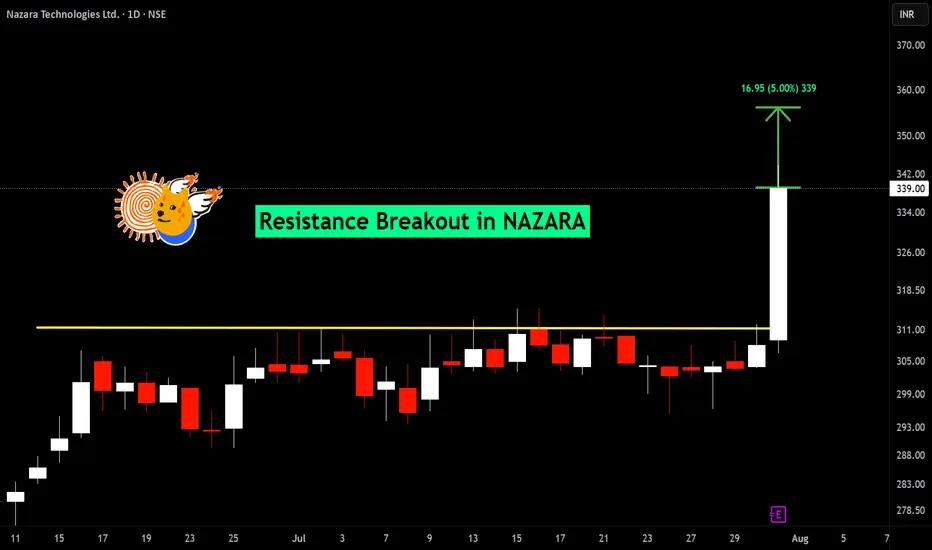
Resistance breakout in NAZARA
BUY TODAY SELL TOMORROW for 5%
BUY TODAY SELL TOMORROW for 5% DON’T HAVE TIME TO MANAGE YOUR TRADES?
- Take BTST trades at 3:25 pm every day
- Try to exit by taking 4-7% profit of each trade
- SL can also be maintained as closing below the low of the breakout candle
Now, why do I prefer BTST over swing trades? The primary reason is that I have observed that 90% of the stocks give most of the movement in just 1-2 days and the rest of the time they either consolidate or fall
Trendline breakout in MANINFRA
BUY TODAY SELL TOMORROW for 5%
BUY TODAY SELL TOMORROW for 5%DON’T HAVE TIME TO MANAGE YOUR TRADES?
- Take BTST trades at 3:25 pm every day
- Try to exit by taking 4-7% profit of each trade
- SL can also be maintained as closing below the low of the breakout candle
Now, why do I prefer BTST over swing trades? The primary reason is that I have observed that 90% of the stocks give most of the movement in just 1-2 days and the rest of the time they either consolidate or fall
Double bottom breakout in TATATECH
BUY TODAY SELL TOMORROW for 5%
BUY TODAY SELL TOMORROW for 5%DON’T HAVE TIME TO MANAGE YOUR TRADES?
- Take BTST trades at 3:25 pm every day
- Try to exit by taking 4-7% profit of each trade
- SL can also be maintained as closing below the low of the breakout candle
Now, why do I prefer BTST over swing trades? The primary reason is that I have observed that 90% of the stocks give most of the movement in just 1-2 days and the rest of the time they either consolidate or fall
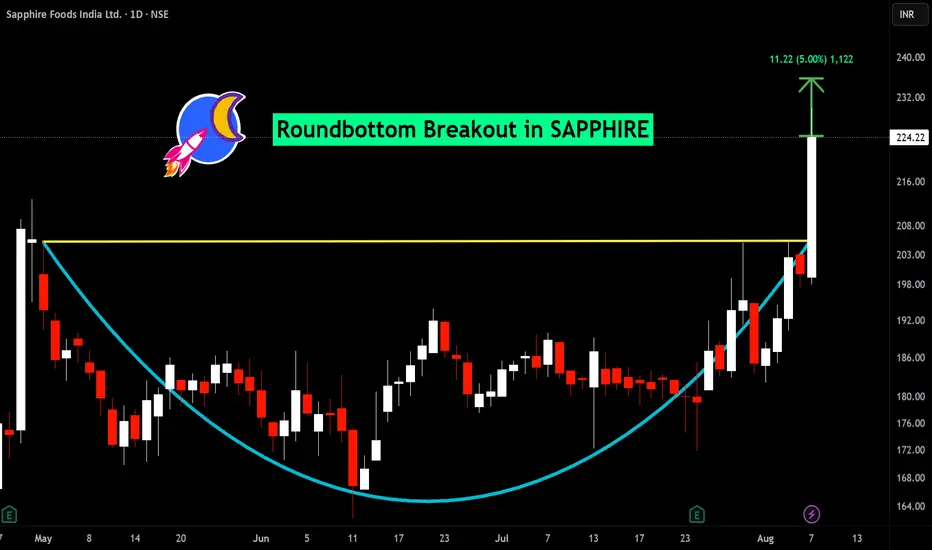
Roundbottom breakout in SAPPHIRE
BUY TODAY SELL TOMORROW for 5%
BUY TODAY SELL TOMORROW for 5% DON’T HAVE TIME TO MANAGE YOUR TRADES?
- Take BTST trades at 3:25 pm every day
- Try to exit by taking 4-7% profit of each trade
- SL can also be maintained as closing below the low of the breakout candle
Now, why do I prefer BTST over swing trades? The primary reason is that I have observed that 90% of the stocks give most of the movement in just 1-2 days and the rest of the time they either consolidate or fall
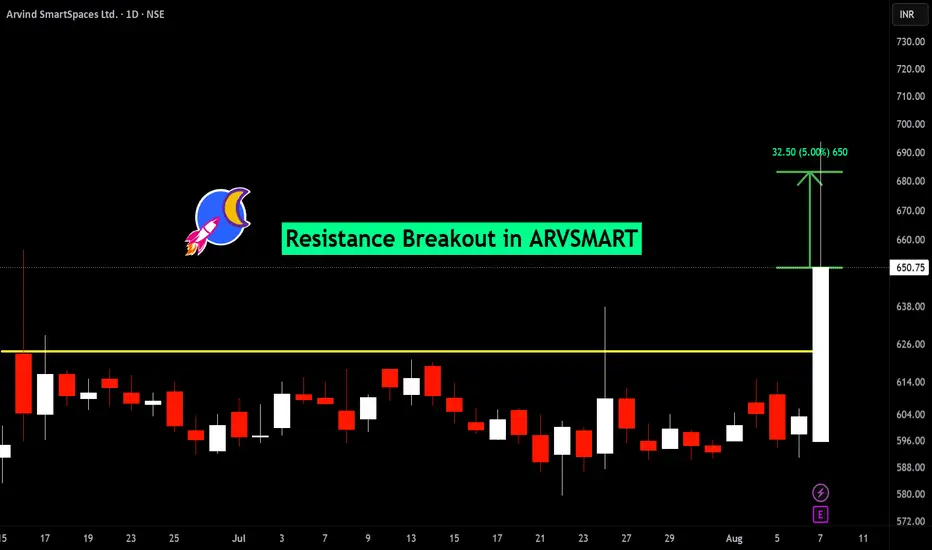
Resistance breakout in ARVSMART
BUY TODAY SELL TOMORROW for 5%
BUY TODAY SELL TOMORROW for 5% ON’T HAVE TIME TO MANAGE YOUR TRADES?
- Take BTST trades at 3:25 pm every day
- Try to exit by taking 4-7% profit of each trade
- SL can also be maintained as closing below the low of the breakout candle
Now, why do I prefer BTST over swing trades? The primary reason is that I have observed that 90% of the stocks give most of the movement in just 1-2 days and the rest of the time they either consolidate or fall
Round bottom breakout in LGEINDIA
BUY TODAY SELL TOMORROW for 5%
BUY TODAY SELL TOMORROW for 5% DON’T HAVE TIME TO MANAGE YOUR TRADES?
- Take BTST trades at 3:25 pm every day
- Try to exit by taking 4-7% profit of each trade
- SL can also be maintained as closing below the low of the breakout candle
Now, why do I prefer BTST over swing trades? The primary reason is that I have observed that 90% of the stocks give most of the movement in just 1-2 days and the rest of the time they either consolidate or fall
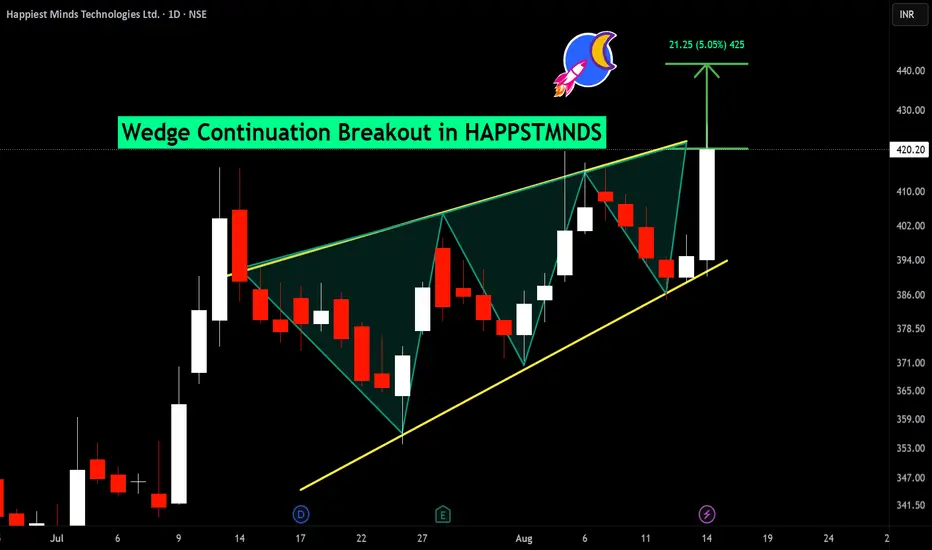
Wedge continuation breakout in HAPPSTMNDS
BUY TODAY SELL TOMORROW for 5%
BUY TODAY SELL TOMORROW for 5% DON’T HAVE TIME TO MANAGE YOUR TRADES?
- Take BTST trades at 3:25 pm every day
- Try to exit by taking 4-7% profit of each trade
- SL can also be maintained as closing below the low of the breakout candle
Now, why do I prefer BTST over swing trades? The primary reason is that I have observed that 90% of the stocks give most of the movement in just 1-2 days and the rest of the time they either consolidate or fall
Resistance breakout in MANORAMA
BUY TODAY SELL TOMORROW for 5%
BUY TODAY SELL TOMORROW for 5% DON’T HAVE TIME TO MANAGE YOUR TRADES?
- Take BTST trades at 3:25 pm every day
- Try to exit by taking 4-7% profit of each trade
- SL can also be maintained as closing below the low of the breakout candle
Now, why do I prefer BTST over swing trades? The primary reason is that I have observed that 90% of the stocks give most of the movement in just 1-2 days and the rest of the time they either consolidate or fall
Roundbottom breakout in UGARSUGAR
BUY TODAY SELL TOMORROW for 5%