Long
Long
 Long
Long
 Long
Long
TATAELXSI: Descending Channel Meets 200-Month EMAOverview
Tata Elxsi — one of India's premium technology and design services companies — has been in a significant correction since its all-time high of ₹10,760 in 2021. On the Monthly timeframe, a clear Descending Channel has formed, and price is now approaching a critical confluence zone where the Channel Lower Band meets the 200 Monthly EMA at ₹3,283.
This analysis covers multiple timeframes to present a complete picture of where TATAELXSI stands structurally.
The Descending Channel — Monthly View
Since the ATH of ₹10,760 in July 2021, TATAELXSI has been declining within a well-defined Descending Channel — two parallel downward-sloping red lines containing every major swing high and low over the past 4+ years.
The upper boundary has capped every rally attempt. The lower boundary has provided support at each major low. Price is currently sitting near the lower boundary of this channel at ₹3,678 — the most critical support zone within the channel structure.
The Fibonacci Structure
The Fibonacci retracement is drawn from the ATH of ₹10,760 (0) to the pre-rally base of ₹499 (1) — measuring the entire bull run.
Key levels:
0.236 — ₹8,338 (broken)
0.382 — ₹6,840 (broken)
0.5 — ₹5,630 (broken)
0.618 — ₹4,419 (broken)
Current price ₹3,678 — between 0.618 and 0.786
0.786 — ₹2,695 (next major Fibonacci support below)
Price has already broken through the 0.618 Fibonacci level — a deep retracement that signals significant long-term correction.
The Critical Confluence — Channel Lower Band + 200 Monthly EMA
The most important observation on this chart is the approaching confluence of two independent structures:
🔴 Descending Channel Lower Band — the structural support within the channel, currently near ₹3,500–3,600 and declining
🟢 200 Monthly EMA at ₹3,283 — rising from below, approaching current price
These two levels are converging toward each other in the ₹3,283–3,500 zone — creating a powerful confluence support area that price is approaching rapidly.
(See Weekly chart below for a closer view of the channel structure)
The EMA Context
📉 50 Monthly EMA at ₹5,534 — price is far below, acting as major resistance
📉 200 Monthly EMA at ₹3,283 — rising from below, approximately ₹395 below current price
Price trading below the 50 Monthly EMA confirms the long-term bearish structure. The approaching 200 Monthly EMA represents the last major dynamic support on the monthly timeframe.
The Weekly & Daily View — Zooming In
The same Descending Channel is clearly visible on both the Weekly and Daily timeframes — confirming this is not just a monthly artifact but a genuine multi-timeframe structural pattern.
Weekly View:
Channel boundaries are sharper and more precise on the weekly
50 Weekly EMA at ₹4,877 — price well below, confirming medium-term bearish trend
200 Weekly EMA at ₹5,711 — acting as major overhead resistance
This week's candle showing -8.67% — significant selling pressure accelerating the move toward the channel lower boundary
Daily View:
50 Daily EMA at ₹4,784 — price trading well below
200 Daily EMA at ₹4,146 — also above current price
All three timeframes (Daily, Weekly, Monthly) show price below all major EMAs — a rare triple EMA breakdown signaling strong bearish momentum
The confluence is significant — when the same pattern appears on Daily, Weekly, and Monthly simultaneously, the structural significance multiplies. It tells you this is not random noise — it is a genuine long-term trend that demands respect.
Key Levels
🔴 ATH / Pattern Origin — 10,760
🔴 50 Monthly EMA Resistance — 5,534
🔴 0.618 Fibonacci (broken) — 4,419
🟡 Current Price — 3,678
🟢 Channel Lower Band — ~3,500 (dynamic, declining)
🟢 200 Monthly EMA — 3,283 (critical confluence)
🟢 0.786 Fibonacci Support — 2,695
Two Scenarios
🟢 Scenario A — Confluence Holds
Price reaches the Channel Lower Band + 200 Monthly EMA confluence zone (₹3,283–3,500) and finds strong long-term buyers. This would represent a historically significant support test — a potential major reversal zone for TATAELXSI. First recovery target would be the 0.618 Fibonacci at ₹4,419, then progressively higher levels.
🔴 Scenario B — Confluence Breaks
Price breaks below the 200 Monthly EMA at ₹3,283 on a monthly closing basis. This would be a major structural breakdown — signaling a shift toward the 0.786 Fibonacci support at ₹2,695 as the next reference level. A monthly close below ₹3,283 would be historically significant for TATAELXSI.
Beginner's Lesson — Why the 200 Monthly EMA Matters
The 200 EMA on the Monthly timeframe is one of the most watched indicators by long-term investors and institutional traders. It represents the average price over approximately 16–17 years of monthly data — making it a genuine long-term trend indicator.
When a quality stock trades below its 200 Monthly EMA, it typically signals one of two things:
A deep value opportunity — if the stock recovers and reclaims the EMA
A fundamental trend shift — if the stock continues declining below it
This is why the approaching 200 Monthly EMA + Channel Lower Band confluence deserves close attention — the reaction from this zone will tell us which scenario is unfolding.
Important: Monthly timeframe setups play out over months to years — this is not a short-term trade setup. Always combine technical analysis with fundamental research before making long-term investment decisions.
Conclusion
TATAELXSI is approaching one of the most significant technical confluences in its listed history — the Descending Channel Lower Band meeting the 200 Monthly EMA near ₹3,283. Whether this zone holds or breaks will define the stock's trajectory for years to come.
Watch the monthly close carefully over the coming months — it will tell the next chapter.
For educational purposes only. Not financial advice. Always manage your risk.
 Long
Long
Price Lied, RSI WhisperedThe Lower Low in Market Structure
Marked in yellow is a lower low. In basic market structure, when price makes a lower high followed by a lower low, it signals that the prevailing trend is pointing downward. Sellers are in control, and the structure confirms it visually
The RSI and How I Use It
At the bottom of the chart sits the RSI, the Relative Strength Index. It is a momentum oscillator that measures the speed and magnitude of price movements on a scale of 0 to 100.
The conventional way of using RSI is well known. Above 70 is considered overbought, a potential sell signal. Below 30 is considered oversold, a potential buy signal. Many traders use it this way and build entire strategies around those two numbers.
I don't.
In my trading journey, indicators have taken a back seat. Volume and EMA on higher timeframes do most of the heavy lifting. RSI only enters the picture for me in one specific scenario, and that is divergences. Not levels. Not overbought or oversold readings. Divergences only.
The Bullish Divergence Hidden Here
This is where the chart gets interesting. Price has made a strong, clear lower low. Market structure confirms it. Sellers look completely in control. But look at the RSI at the same time.
While price printed a lower low, RSI printed a higher low.
Price and momentum are telling two completely different stories. That disconnect is called a bullish divergence. The price action looks weak. But the momentum underneath it is quietly strengthening. This mismatch between what price is doing on the surface and what RSI is reflecting beneath it is one of the more thought provoking observations you can make on a chart.
It doesn't mean price will reverse. It doesn't mean anything is confirmed. It simply means the selling momentum, despite what the candles look like, was not as strong as the previous leg down.
Disclaimer: This post is purely educational and observational in nature. RSI divergence observations shared here are based on personal experience and chart reading habits and do not constitute financial advice, a forecast, or a recommendation to buy, sell, or hold any security.
 Long
Long
 Long
Long
 Long
Long
 Long
Long
 Long
Long
DR REDDY'S | Ascending Triangle — Watch ₹1,415 BreakoutOverview
Dr. Reddy's Laboratories — one of India's leading pharmaceutical companies — is forming a well-defined Ascending Triangle on the Daily chart. Today's strong +2.11% session pushed price to ₹1,390, approaching the key resistance at ₹1,415, before closing at ₹1,374. The triangle structure remains intact and the breakout zone is approaching.
The Ascending Triangle
An Ascending Triangle forms when price makes higher lows (rising trendline below) while repeatedly testing a flat horizontal resistance above. This pattern signals accumulation — buyers are consistently stepping in at higher levels, pushing price toward the resistance ceiling.
Upper Boundary: Flat resistance at ₹1,415 — tested multiple times since 2024. Sellers have defended this level consistently. This is the key breakout trigger.
Lower Boundary: Rising trendline support connecting the lows from April 2025 through February 2026 — confirming buyers are making higher lows over time.
Today's Price Action — Why This Setup is Timely
Today's +2.11% session saw Dr. Reddy's rally to ₹1,390 — approaching but not yet breaking the ₹1,415 resistance. Price closed at ₹1,374, consolidating within the triangle structure. The ascending triangle remains fully intact.
The stock is in the compression zone — the narrowing space between rising support and flat resistance — where the next directional move is building energy.
The EMA Context
📈 50 EMA at ₹1,300 — price trading well above, confirming medium-term bullish momentum.
📈 200 EMA at ₹1,273 — price above the 200 EMA, confirming the long-term trend remains bullish.
Both EMAs are positioned as support layers below — adding depth to the bullish structure.
Key Levels
🔴 Triangle Upper Resistance — 1,415 (breakout trigger)
🟡 Current Price — 1,374 (inside triangle)
🟢 50 EMA Support — 1,300
🟢 200 EMA Support — 1,273
🟢 Rising Trendline Support — dynamic, rising from April 2025 lows
🎯 Measured Move Target — 1,820 (triangle height ₹400 projected from breakout at 1,415)
🔴 Invalidation — close below rising trendline
Two Scenarios
🟢 Scenario A — Breakout Confirms
Price breaks above ₹1,415 on a daily close with good volume. This confirms the Ascending Triangle breakout. First interim target is ₹1,600+, with a measured move target of ₹1,820 (triangle height of ~₹400 projected upward from the breakout level).
🔴 Scenario B — Resistance Holds, Pullback
Price fails to break above ₹1,415 and pulls back toward the rising trendline support. The triangle structure remains valid as long as price holds above the rising trendline. A close below the trendline would invalidate the pattern — watch the 50 EMA at ₹1,300 as the next support.
Beginner's Lesson — What is an Ascending Triangle?
An Ascending Triangle tells a story of shifting power from sellers to buyers:
The flat resistance shows sellers defending the same price level repeatedly
The rising trendline shows buyers becoming more aggressive — unwilling to wait for lower prices
As the two lines converge, pressure builds inside the pattern
Eventually buyers overwhelm sellers — and the breakout happens
The key insight: the pattern is bullish not because of the breakout, but because of the higher lows forming before it. Each higher low is a sign buyers are getting stronger.
Always wait for a confirmed daily close above ₹1,415 before acting — not just an intraday breach.
Conclusion
Dr. Reddy's is forming a clean Ascending Triangle on the Daily chart. The upper resistance at ₹1,415 is the key level — multiple tests, multiple rejections. But the rising trendline below shows buyers getting stronger with each pullback.
Watch for a daily close above ₹1,415 with volume — that is the confirmation signal.
For educational purposes only. Not financial advice. Always manage your risk.  Long
Long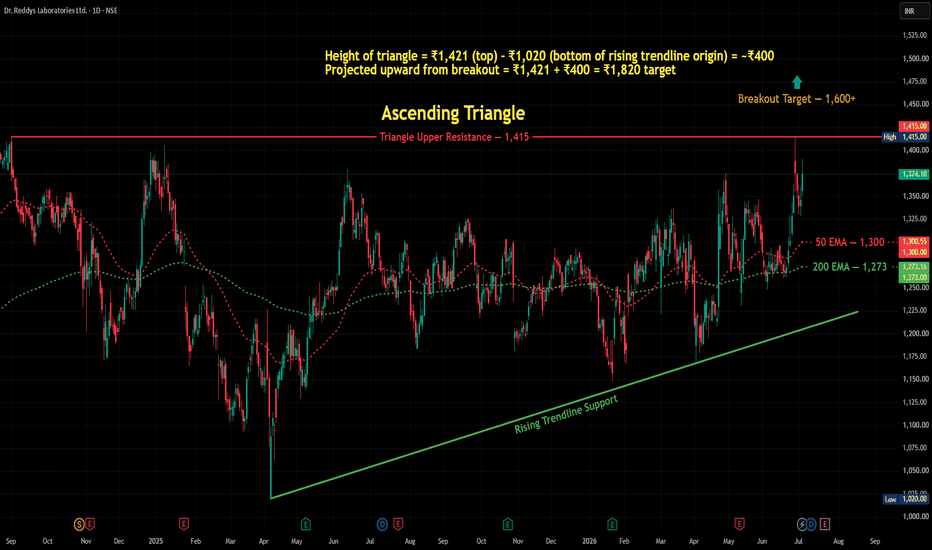
SHREEJISPG: Textbook Break & Retest and Cup & Handle Completion1. The Macro Perspective: The Deep Washout and Recovery
I am taking a LONG bias on Shreeji Shipping Global Limited (SHREEJISPG) on the daily (1D) timeframe.
When analyzing pure market structure, we have to respect major historical pivot points. Look at the solid black horizontal line at 416.55. After a massive prior run, the stock established a heavy resistance ceiling near this level. What followed was a deep, volatile markdown phase that dragged the price all the way down toward the 310 zone, successfully washing out weak hands. However, instead of collapsing into a sustained bear trend, the stock continuously absorbed selling pressure, slowly carving out a massive rounding bottom—the "Cup"—and aggressively grinding its way right back up to the 416.55 crime scene.
2. The Educational Setup: Flipping the Script
In technical analysis, breaking a resistance line is only half the battle. The most reliable, high-probability setups occur when a stock proves it can defend its newly claimed territory.
The Breakout: Recently, the pressure cooker finally exploded. After forming a shallow right-side consolidation (the "Handle"), the stock decisively shattered the 416.55 ceiling with a massive momentum candle.
The Retest: To amateur traders, the subsequent red pullback candles look like a failed rally or a trap. To structural traders, this is the exact trigger we wait for. The price is pulling back to perfectly test that 416.55 line from above. The old, heavy resistance ceiling is officially being tested as a brand-new, rock-solid support floor. Institutional buyers are stepping in exactly where they are supposed to.
3. Current Price Action: The New Launchpad
Look at the most recent daily candles on the far right, currently trading near 421.25. The price has compressed perfectly into the top of the breakout line. By refusing to let the price collapse back into the middle of the cup, the market is officially accepting these higher valuations and storing immense kinetic energy for the next markup phase.
4. The Trade Plan: Entries, Targets, and Risk Management
Entry Strategy: We are currently sitting right in the "golden entry" zone. The highest-probability, lowest-risk entry involves stepping in right here at the structural retest of the 416.55 line (between 416.00 and 422.00). Letting that newly broken ceiling prove itself as an indestructible support floor offers a phenomenal risk-to-reward ratio.
Take Profit (Targets): We can find a measured technical target by taking the depth of the massive macro cup (roughly 106 points from the ~310 floor to the 416.55 ceiling) and projecting it upward from the breakout level. This gives us a primary structural target in the 520.00 to 525.00 zone. Immediate psychological milestones sit at 475.00 and 500.00.
Invalidation (Stop Loss): A trade thesis is only valid if the market structure holds. A hard stop loss should be placed safely below the breakout line and the recent handle's pivot, around the 395.00 to 400.00 level. A definitive daily close completely back inside the cup and below 416.55 would invalidate the immediate "break and go" thesis and signal a potential bull trap.
5. Time Horizon:
Because this technical setup is built on a 1-Day chart capturing a major structural break and retest, this is a short-to-medium-term swing trade designed to capture the next explosive continuation phase. Let the structure dictate the trend!  Long
Long
 Long
Long
 Long
Long
INDUSINDBK Ascending Triangle Breakout & 52-Week High📊 IndusInd Bank: Daily Technical Snapshot – Ascending Triangle Breakout & 52-Week High
📊 STWP Technical Analysis
________________________________________
MARKET STRUCTURE SNAPSHOT | NSE: INDUSINDBK | DAILY
Closing Price: 974.35 (+30.85 | +3.27%)
Core Trend: Strong Uptrend
Market State: Confirmed Breakout in Progress
Price Structure: Price has broken above an Ascending Triangle and is trading near a fresh 52-week high, indicating continued bullish strength.
________________________________________
OPERATIONAL PRICE GRID & KEY REFERENCE LEVELS
Model Reference Level: 978.40
Hard Invalidation Level: 879.45
Structural Risk: 98.95 (10.11%)
Resistance Levels: R1 987.80 | R2 1,001.25 | R3 1,024.10
Support Levels: S1 951.50 | S2 928.65 | S3 915.20
Range Structure: Immediate Trading Range 879.45 – 1,024.10
Higher Timeframe Observation: Sustained acceptance above 988–1,001 may strengthen the trend towards the 1,024 region.
________________________________________
MOMENTUM, PARTICIPATION & CPR DATA
Volume Profile: 3.82 Million Shares
Volume Character: High Relative Participation
RSI: 64.59 (Strong Momentum Zone)
ADX: 21.61 (Trend Development Phase)
ROC: +3.79%
MACD: Strong Positive Momentum Structure
CCI: +128.27 (Strong Bullish Momentum)
Stochastic: 94.82 (Extended Momentum Zone)
Current Bias: BUY ON PULLBACKS
CPR State: Bullish Zone | Wide Projected CPR
Today's CPR: Pivot 940.00 | Top 941.75 | Base 938.25
Tomorrow's Projected CPR: Pivot 964.95 | Top 969.65 | Base 960.25
________________________________________
📚 EDUCATIONAL OBSERVATION
IndusInd Bank has delivered a strong bullish breakout by moving above an Ascending Triangle, a continuation pattern that typically reflects sustained buying interest after a period of consolidation. The breakout is further reinforced by a move towards a fresh 52-week high, indicating improving market sentiment and strengthening price structure.
The pattern is characterised by a series of higher lows, reflecting increasing buyer aggression, while repeated tests of the horizontal resistance eventually resulted in a decisive breakout. Such formations often indicate that demand has gradually absorbed available supply before prices expand higher.
Several technical factors are currently aligned in support of the prevailing trend:
Ascending Triangle Breakout
52-Week Breakout
Strong Bullish Candle
RSI Breakout
Bollinger Band Expansion
Strong Price-Volume Confirmation
Buyers' Dominance
Relative Strength Outperforming NIFTY
Momentum indicators continue to paint a constructive picture. The RSI at 64.59 reflects healthy bullish momentum without entering an extreme overbought condition. MACD remains firmly positive, while ADX at 21.61 suggests that the emerging trend is gaining strength. CCI at +128.27 highlights strong upside momentum, and the Stochastic reading of 94.82 confirms sustained buying pressure, although it also indicates that short-term pullbacks remain possible following a sharp advance.
The projected Central Pivot Range (CPR) for the next trading session has shifted higher, with the Pivot projected at 964.95. A rising and wide CPR generally indicates improving market acceptance of higher prices and often supports trend continuation when accompanied by healthy participation.
Immediate attention remains focused on the resistance zone between 988 and 1,001. A sustained move above this region could strengthen the existing bullish structure and bring the 1,024 area into focus for future market structure analysis. On the downside, 951.50 serves as the first important support, while the structural invalidation level remains at 879.45.
From a business perspective, IndusInd Bank is one of India's leading private sector banks, offering retail banking, corporate banking, vehicle finance, microfinance, treasury operations and digital banking services. Continued improvement in asset quality, steady credit growth and increasing digital adoption remain supportive factors for the bank's long-term business outlook.
Support and resistance levels should be viewed as observation zones rather than predictive targets. Chart patterns, price action, volume analysis, momentum indicators and CPR are educational tools intended to help market participants understand evolving market structure within a disciplined risk-management framework.
________________________________________
⚠️ Disclaimer
This analysis is provided strictly for educational and informational purposes.
It does not constitute financial, investment or trading advice and should not be interpreted as a recommendation to buy or sell any security.
Investments in the stock market are subject to market risks, including the possible loss of capital.
Historical performance, chart patterns and technical indicators do not guarantee future results.
Please conduct your own research and consult a SEBI-registered investment adviser before making investment decisions.
STWP assumes no responsibility or liability for any financial loss arising directly or indirectly from the use of this analysis.
 Long
Long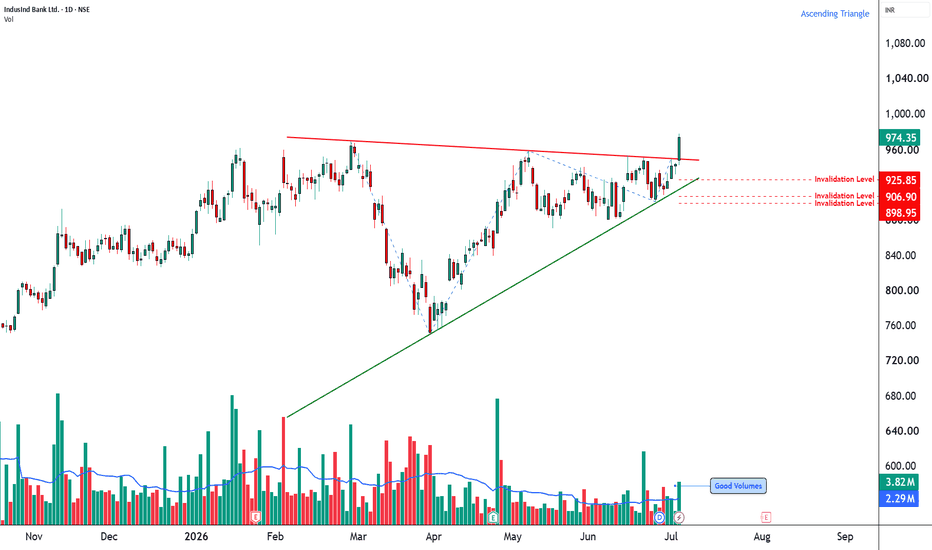
Long