Aequs Ltd (W): ALL-TIME HIGH BREAKOUTTimeframe: Weekly | Chart Scale: Logarithmic
Explosive +11.79% weekly surge hitting a new ATH of 285.95! ๐ฅ
Technical Highlights:
โ
Breakout: Cleared & closed above short-term horizontal resistance (active since Jul '26), breaking out of a sideways trend.
โ
Volume: Massive 62.06M volume backing the move. Overall volume trend is steadily rising!
โ
Momentum: Short-term EMAs in positive crossover (Daily/Weekly). MACD & RSI rising. ๐
Key Levels to Watch:
๐ฏ Target: 340
๐ก๏ธ Su
Axiscades Technologies (W): ATH BREAKOUT & HISTORICAL TESTTimeframe: Weekly | Chart Scale: Logarithmic
Explosive +21.94% weekly surge on 3M volume , hitting a new ATH of 2,349.6! ๐ฅ
Technical Highlights:
โ
Breakout: Cleared & closed above short-term horizontal resistance (active since May '26).
โ ๏ธ Multi-Decade Test: Pushing directly into a massive long-term angular resistance (active since Apr '02).
โ
Volume: Strong rising volume confirms heavy buyer accumulation.
โ
Momentum: Short-term EMAs in positive crossover (Daily/Weekly/Monthl
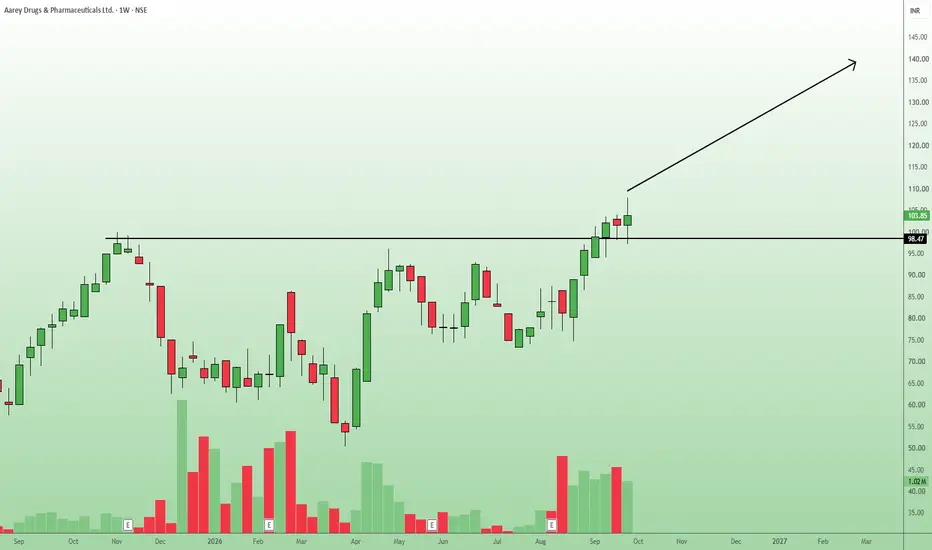
AAREYDRUGS Analyzing the Move Above Key ResistanceLooking at the weekly timeframe for Aarey Drugs & Pharmaceuticals Ltd., the stock has clearly broken out above a major horizontal resistance level at 98.47.
As seen in the chart, 98.47 level previously acted as a strong supply zone, rejecting the price and forcing a prolonged period of consolidation.
The recent price action demonstrates a decisive weekly close above this resistance, indicating strong bullish momentum.
Furthermore, the breakout is accompanied by supportive buying volume, which
Trading Road Mapoptions trading and institutional trading are important parts of modern financial markets. Options trading offers flexibility and opportunities for profit, while institutional trading provides liquidity and stability to the market. However, beginners should learn market concepts carefully before entering options trading because losses can occur quickly without proper knowledge and risk management. Education, practice, and disciplined investing are essential for long-term success in trading.
Escaping the Bear's Grip to Catch the Future.Pattern Structure: The price is resolving from a descending trendline, compressing volatility and shifting the market structure from bearish to potentially bullish.
Supply and Demand: A key horizontal support zone is holding, acting as a crucial demand area to absorb selling pressure and fuel the reversal.
Volume Analysis: High volume spikes during the breakout confirm strong institutional conviction, validating the trendline breach and helping to protect against false breakdowns.
Risk Manage
A LONG TERM BUY OPPORTUNITY in FIX (Comfort Systems USA)NYSE:FIX Comfort Systems USA
THE FUNDAMENTALS - THE STORY
the 2025 fundamentals are exceptionally strong from an operating perspective. Revenue grew 29.5% to $9.10B , while net income almost doubled to $1.02B , meaning earnings grew substantially faster than sales.
The improvement in margins is particularly important: gross margin increased from 21.0% to 24.1%, operating margin from 10.7% to 14.4% , and net margin from 7.4% to 11.2%. At the same time, backlog nearly doubled from $5.99B t
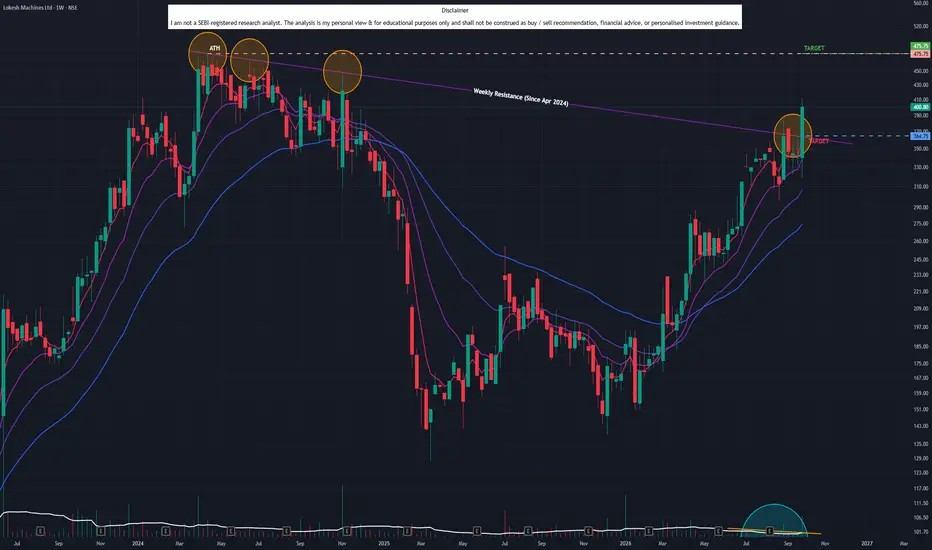
Lokesh Machines (W): STRUCTURAL BREAKOUTTimeframe: Weekly | Chart Scale: Logarithmic
Explosive +17.81% weekly surge on 1.13M volume! ๐ฅ
Technical Highlights:
โ
Breakout: Cleared & closed above long-term angular resistance (active since Apr '24).
โ
Volume Reversal: Volume steadily rising past couple of weeks after a recent dip.
โ
Momentum: Short-term EMAs in positive crossover (Daily/Weekly/Monthly). MACD & RSI rising. ๐
Key Levels to Watch:
๐ฏ Target: 475
๐ก๏ธ Support / Pullback: 364 (Previous resistance turned s
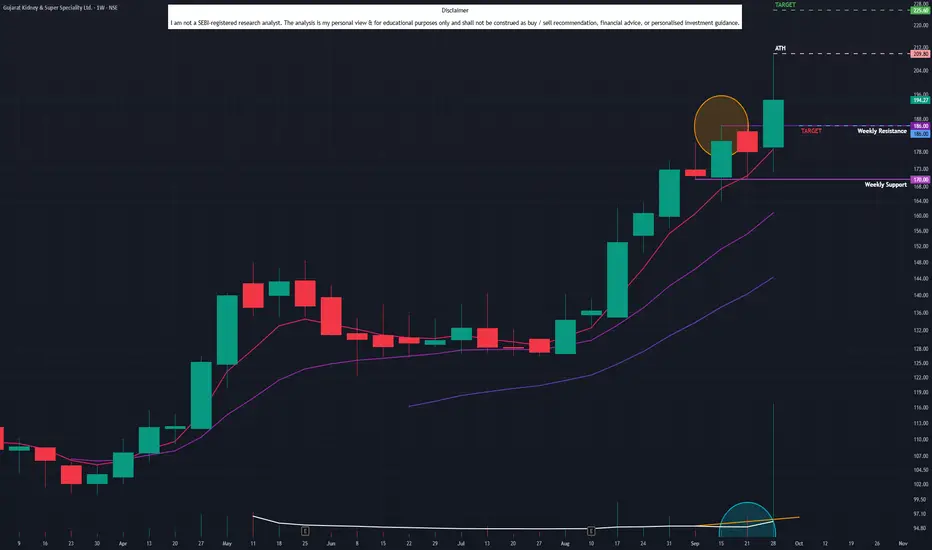
Gujarat Kidney & Super Speciality (W): ALL-TIME HIGH BREAKOUTTimeframe: Weekly | Chart Scale: Logarithmic
Explosive +9.13% weekly surge hitting a new ATH of 209.80! ๐ฅ
Technical Highlights:
โ
Breakout: Cleared & closed above short-term horizontal resistance (active since mid-Sept '26).
โ
Volume: Massive 36.41M volume backing the move. Overall volume trend is steadily rising!
โ
Momentum: Short-term EMAs in positive crossover (Daily/Weekly). MACD & RSI rising. ๐
Key Levels to Watch:
๐ฏ Target: 225
๐ก๏ธ Support / Pullback: 186
Keep
D.P. Abhushan (W): ATH RESISTANCE TESTTimeframe: Weekly | Chart Scale: Logarithmic
Explosive +32.19% weekly surge on a massive 2.64M volume! ๐ฅ
Technical Highlights:
โ
Breakout: Cleared & closed above long-term angular resistance (active since Oct '24).
โ ๏ธ ATH Test: Pushing directly into the 1,927 All-Time High!
โ
Volume: Strong rising volume confirms heavy buyer accumulation.
โ
Momentum: Short-term EMAs in positive crossover (Daily/Weekly/Monthly). MACD & RSI rising. ๐
Key Levels to Watch:
๐ฏ Target: 2,210
OCCL Ltd - Breakout Setup, Move is ON...#OCCLLTD trading above Resistance of 171
Next Resistance is at 326
Support is at 142
Here is previous chart:
This weekly chart for OCCL Limited displays a strong bullish breakout from a consolidation pattern, supported by significant volume and long-term trendline context.
Chart Overview
Timeframe & Asset: OCCL Ltd. (1-Week Chart, NSE).
Current Price: 193.49 INR (+15.40% change shown on the chart header).
Key Technical Observations
Horizontal & Channel Breakout: The stock consolidated
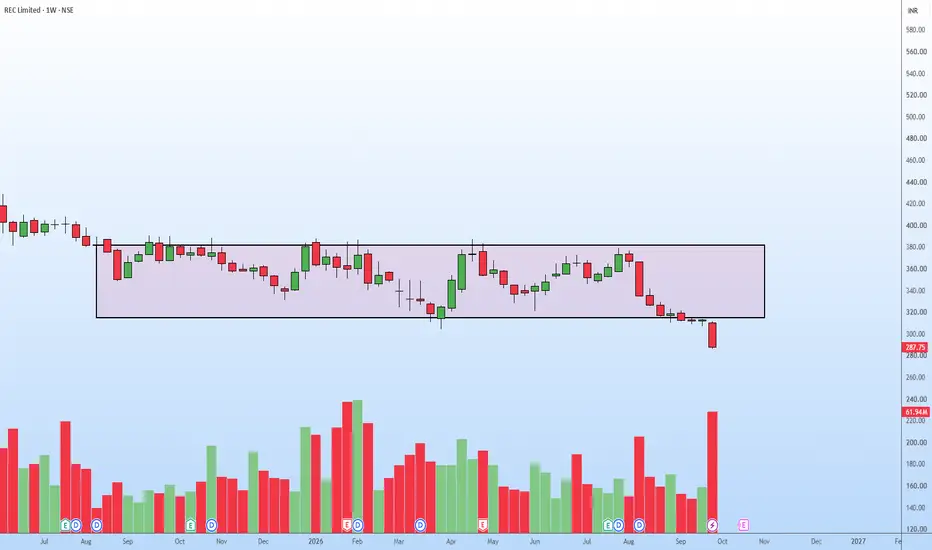
RECLTD Bearish Momentum Accelerates Weekly BreakdownThe weekly chart of REC Limited demonstrates a clear breakdown from a prolonged consolidation phase.
The price action was previously contained within a rectangular box, with a solid support zone established near the 320 level and resistance capping the upside around 380.
Recently, the price decisively breached the 320 support floor with a large bearish candle, accompanied by a noticeable spike in trading volume.
This confirms the breakdown and signals a strong shift in momentum toward the dow
SNDK Long Term Doubling opportunity - A LONG TERM GAMEThere are multiple catalogues for Scandisk to Double its price.
THE FUNDAMENTALS AND SEASONALS
the one and only is its underperforming S&P500
Its also best of the best amongst its peers.
Fundamentals are increasing.
I will stay hold on it till any two of the above present.
THE TECHNICALS
The price is on the move of ABCD patter on Weekly timeframe.
Currently trading in the daily channel.
A breakout of this daily channel will pave more good ways to its target price at 3280.
VOLTAS Exits Long-Term Consolidation on Weekly Bearish BreakdownTechnical Analysis & Context:
Looking at the weekly timeframe, Voltas has been trading within a well-defined rectangular consolidation zone for over a year, roughly bounded by resistance near 1550 and support near 1200.
Recently, the price action decisively broke down below the lower boundary of this structural box.
This breakdown is a significant technical development, indicating that the long-term equilibrium has shifted in favor of the bears.
The stock is currently trading around 1053, show
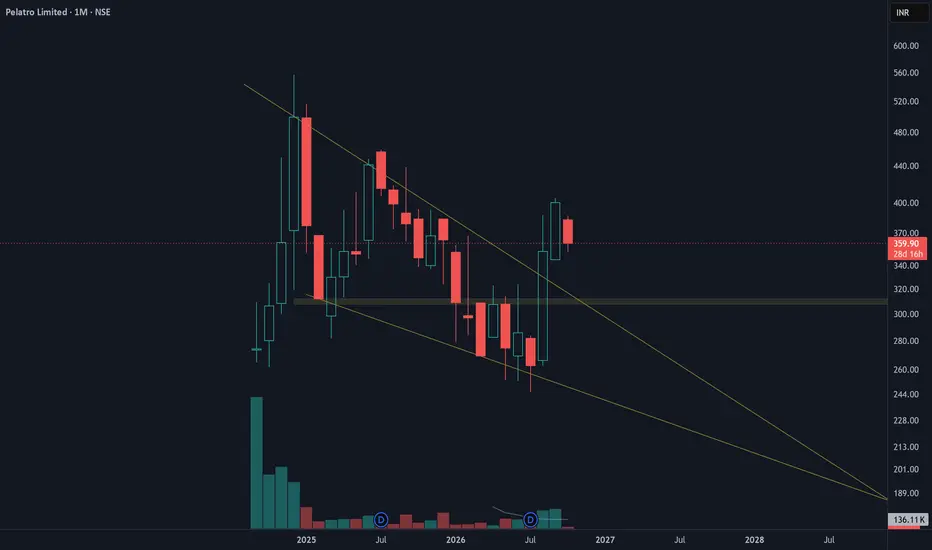
Escaping the Shadows, Charting a New Ascent.Pelatro's price action reveals a maturing descending wedge, compressing volatility toward a decisive resolution.
The breakout above the descending trendline indicates waning bearish momentum and a shift in market structure.
Implement a strict stop-loss just below the breakout candle low to mitigate downside risk.
Watch immediate resistance as the initial target, with further upside potential toward prior swing highs.
Disclaimer:
The content provided is for educational purposes only and sho
going up in corrective waves If u see wave i is within a parallel channel , it means there is no ompulse wave , so is wave 3 and wave 5 , all between a parallel channel . This means, since it is going up , t will correct alleat in the territory of wave 2 . Who knows if it a wave 5 ending in a diagonal or just an other wave 1 ending in a diagonal . But I bet on the wave 1 scenario . Get ready to buy around 800-750 . But at this level we need to see three white soldiers . Regards
Morepen Laboratories (D): CONTINUATION BREAKOUTTimeframe: Daily | Chart Scale: Linear
Explosive +6.14% surge today backed by a massive 37.97M volume spike! ๐ฅ
Technical Highlights:
โ
Chart Pattern: Textbook "Flag & Pole" breakout confirming the broader uptrend!
โ
Volume Reversal: Sudden, massive volume spike violently breaking a recent "dry volume" phase.
โ
Momentum: Short-term EMAs in positive crossover (Daily/Weekly/Monthly). MACD & RSI rising. ๐
Key Levels to Watch:
๐ฏ Target: 145
๐ก๏ธ Support / Pullback: 125 (Prev
Buy Today, Sell Tomorrow for 3โ5% โ Daily Breakout SetupSCHNEIDER โ BTST BREAKOUT SETUP
Entry, Stop Loss & Targets Are Clearly Defined โ Helping You Plan Your Trade With Confidence.
๐ Stock Strength: 69/100
(Note: Higher score indicates stronger stock conditions, not guaranteed returns.)
A bullish breakout has appeared with positive price action and strong volume expansion.
๐ Trade Type: BTST
โโโโโโโโโโโโโโโโโโโโ
๐ฏ TRADE LEVELS
ENTRY: โน1,274
๐ STOP LOSS
ATR SL: โน1,203
๐ฏ TARGETS
BTST Target: 3โ5%
โโโโโโโโโโโโโโโโโโโโ
๐ VOLUME
20D Volume: 4
Buy Today, Sell Tomorrow for 3โ5% โ Daily Breakout SetupRAMRAT โ BTST BREAKOUT SETUP
Entry, Stop Loss & Targets Are Clearly Defined โ Helping You Plan Your Trade With Confidence.
๐ Stock Strength: 75/100
(Note: Higher score indicates stronger stock conditions, not guaranteed returns.)
A bullish breakout has appeared with positive price action and strong volume expansion.
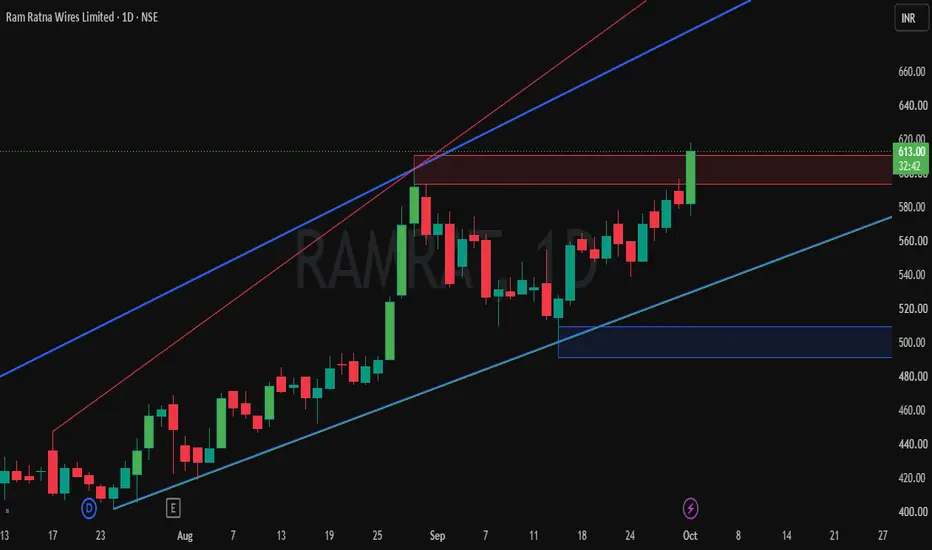
๐ Trade Type: BTST
โโโโโโโโโโโโโโโโโโโโ
๐ฏ TRADE LEVELS
ENTRY: โน613
๐ STOP LOSS
ATR SL: โน573
๐ฏ TARGETS
BTST Target: 3โ5%
โโโโโโโโโโโโโโโโโโโโ
๐ VOLUME
20D Volume: 284%
1D
This Support Can Become The Launch PointHFCL is still moving inside a clean rising channel and price has again reacted strongly from the lower trendline support. What makes this zone more important is the 100 EMA sitting almost at the same area near 196-200. Buyers are defending this confluence and the latest bounce shows selling pressure is getting absorbed. As long as price keeps holding above this support structure the broader trend remains strong and this pullback can simply be another reset before the next expansion.
The upper t
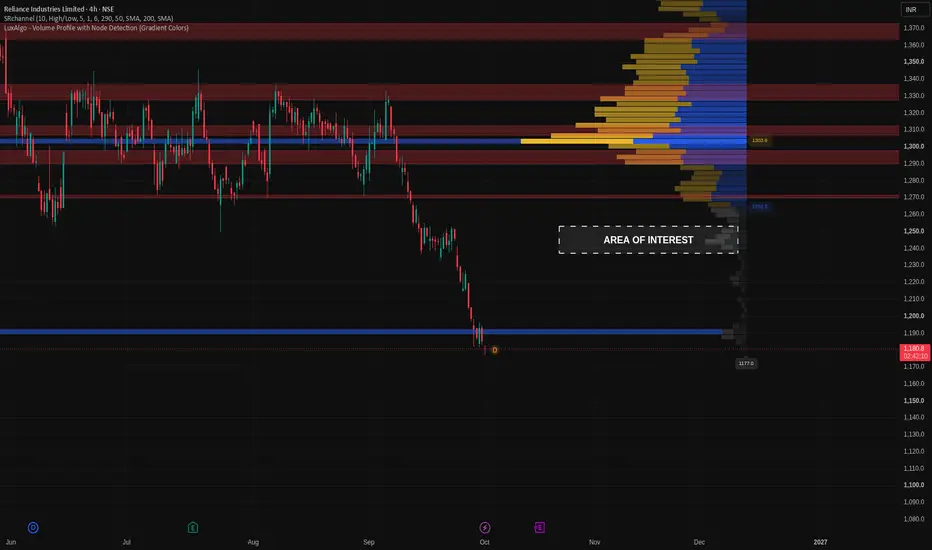
RELIANCE 4H: Bearish Setup Needs Rebound and RejectionNSE:RELIANCE retains a bearish continuation thesis on the 4-hour chart, conditional on a rebound into 1237-1253 and rejection from that zone. The supplied reference price is 1182, so the setup depends on a pullback to the zone before any trade is considered.
The chart shows successive lower highs and lower lows, followed by a sharp decline through prior support. A brief consolidation around 1237-1253 also broke down, making that area a potential resistance zone on a revisit. The supplied bar ca
KRYSTAL INTEGRATED SERVICES - BREAKOUT SETUP IN THE MAKING?Entry Zone: Current levels around โน620โ625
The weekly chart is showing an interesting structure after a prolonged decline. Price is now testing the descending trendline, making the current zone important for the next directional move.
๐ Upside Scenarios
Target 1: โน720โ730
This is the first major resistance zone. A sustained move above the trendline can bring price toward this area.
Target 2: โน820โ860
The next major resistance/supply zone. This also coincides with previous swing highs and the
TSLA Is Losing Momentum Below Trendline ResistanceTSLA is starting to look heavy again.
The recent rebound carried price back toward the long-term descending trendline, but instead of breaking through, buyers were rejected around the 380 area. That reaction keeps the broader bearish structure intact.
What matters now is the way price is behaving around 350โ360. The bounce has lost momentum, price is back below the Ichimoku cloud, and buyers are struggling to build any real follow-through.
For me, this still looks more like a failed recovery tha