AIA Engineering: Where Technicals and Fundamentals AlignAIA Engineering Ltd. (NSE: AIAENG)
Technical View
AIA Engineering has completed a healthy correction after its multi-year rally and has now broken out to a fresh lifetime high, indicating a potential continuation of the primary uptrend.
From 2022 to 2024, the stock traded within a well-defined rising channel before witnessing a profit-booking phase. Instead of a sharp reversal, the correction evolved into a rounded accumulation pattern, suggesting that long-term investors continued to accumulate the stock while weak hands exited.
The recent breakout above the previous lifetime high, accompanied by strong weekly price action and a noticeable rise in volume, confirms renewed buying interest.
The breakout level now becomes the first important support. As long as the stock sustains above this zone, the overall trend remains positive, and higher levels cannot be ruled out.
Trade Setup
LTP: 5081
Buy on Dip: 4,750
Stop Loss (Weekly Closing Basis): 4,600
Expected Target: 7,000
Fundamental View
AIA Engineering is one of the world's leading manufacturers of high chrome grinding media, liners and wear-resistant parts, supplying products to the mining, cement and thermal power industries across more than 120 countries.
Key Strengths
✔ Market leader with a strong global presence.
✔ Export-focused business with a diversified customer base.
✔ Consistent cash-generating business supported by healthy operating margins.
✔ Debt-free balance sheet with strong cash reserves.
✔ High return ratios, reflecting efficient capital allocation.
✔ Regular dividend payouts and disciplined capital management.
The long-term demand outlook also remains favourable as global mining activity, mineral processing and infrastructure spending continue to support replacement demand for grinding media.
Investment Thesis
The combination of:
Strong long-term fundamentals,
Leadership in a niche engineering segment,
Healthy balance sheet,
Consistent earnings,
Fresh technical breakout above lifetime highs,
creates a favourable risk-reward setup for positional investors.
While short-term volatility is always possible after a breakout, any healthy retracement towards the breakout zone may provide an opportunity to accumulate, provided the stock continues to hold above the defined risk level.
Risk Factors
Slowdown in global mining and cement activity.
Sharp correction in commodity prices impacting capital expenditure.
Rising raw material costs affecting margins.
Appreciation of the Indian Rupee impacting export realizations.
Failure to sustain above the breakout zone may lead to short-term consolidation.  Long
Long
 Long
Long
Aptus Value Housing Finance - Head and ShouldersAptus is currently forming an Inverse Head and Shoulder pattern, a classical bullish reversal setup that often signals the end of a downtrend. The stock has completed the Left Shoulder, Head, and Right Shoulder and is now approaching the neckline resistance zone near ₹290–300
The neckline coincides with a strong historical supply zone around psychological level 300, making it a critical level for the next directional move. A breakout above this level could improve the medium-term outlook.
However, traders should exercise caution.
Technical Observations:
1. Inverse Head and Shoulder pattern under formation
2. Price approaching neckline resistance
3. Neckline acting as a strong supply zone
4. 200 EMA has started sloping upward, indicating improving trend
5. RSI has touched the 70 zone, reflecting strong bullish momentum
6. Long-term downtrend line still remains overhead
Trading Perspective: Although the pattern is constructive, the primary trend is still bearish on the higher timeframe. Stocks attempting to reverse from a prolonged downtrend often witness a retracement or pullback after the initial breakout as early buyers book profits and late buyers enter.
Therefore, chasing the breakout is not advisable. A better approach would be to wait for:
* A successful breakout above the neckline.
* A healthy retest of the breakout zone.
* Confirmation that the neckline has turned into support.
This approach generally offers lower risk, better risk-reward, and higher probability compared to buying the initial breakout.
Outlook: The technical structure is gradually improving with a rising 200 EMA and strong RSI momentum. However, the neckline remains a decisive resistance level. A confirmed breakout followed by a successful retest would provide stronger evidence that the long-term trend is transitioning from bearish to bullish.
Patience is key—focus on confirmation rather than chasing the breakout.
Disclaimer: This research is only for educational purposes and not investment advice. Please consult your registered financial advisor before investing. I am only a SEBI Certified Research Analyst.
 Long
Long
 Long
Long
 Long
Long
 Long
Long
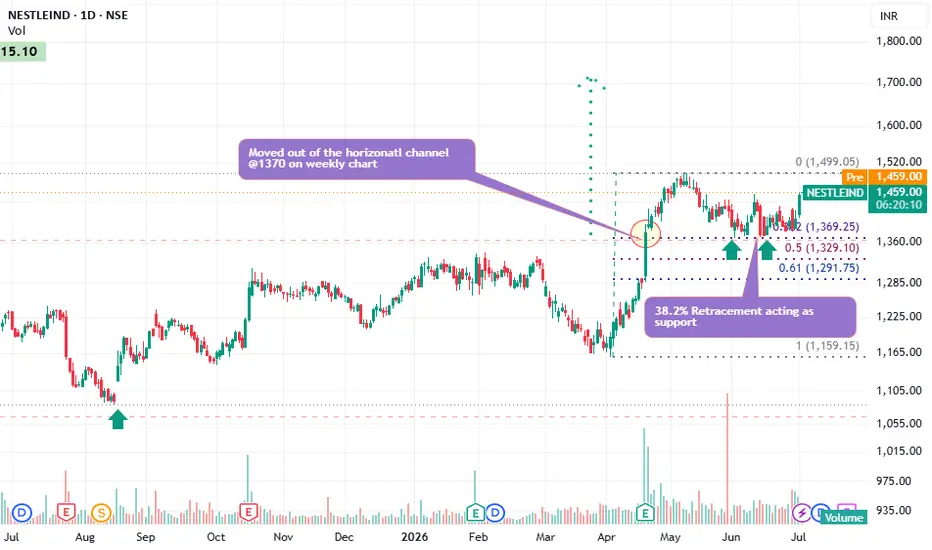
Daily chart of Nestlé IndiaCurrent price: ₹1,454
This is a daily chart of Nestlé India with a Fibonacci retracement drawn after a strong breakout. Here's the technical interpretation:
1. Weekly Breakout (Most Bullish Signal) ✅
The stock broke above the long-term horizontal resistance near ₹1,370 on the weekly chart.
Such breakouts after a prolonged consolidation often signal the start of a fresh uptrend.
The sharp rise from around ₹1,180 to ₹1,500 confirms strong buying interest.
Inference: Long-term trend has turned bullish.
2. Fibonacci Retracement
The Fibonacci tool is drawn from the swing low (~₹1,159) to the swing high (~₹1,499).
Key levels:
Fibonacci Level Price Significance
38.2% ₹1,369 Strong support
50% ₹1,329 Medium support
61.8% ₹1,292 Last major support
The stock has repeatedly bounced near ₹1,369, showing that buyers are defending this level.
3. Current Price Action
Current price: ₹1,454
Observations:
Trading above all important Fibonacci levels.
Making higher lows after the breakout.
Consolidating below ₹1,500 instead of falling sharply.
This is generally a sign of strength.
4. Volume Analysis
The breakout was accompanied by high volumes, indicating institutional participation.
During consolidation, volumes have reduced, which is healthy.
Ideally, the next breakout above ₹1,500 should again come with higher volume.
Overall Technical View
Trend: 🟢 Bullish
Momentum: Positive
Structure: Breakout followed by healthy consolidation
Support Strength: Strong at ₹1,370
Probability: As long as the stock holds above ₹1,370, the probability of a move above ₹1,500 remains favorable.
HINDUNILVR | 2-Year Symmetrical Triangle — Breakout Zone WatchOverview
Hindustan Unilever — one of India's most widely held FMCG stocks — has been forming a Symmetrical Triangle on the Daily chart spanning nearly 2 years. Price is currently sitting inside the triangle's breakout zone, with yesterday's strong +3% bullish candle adding momentum to the setup.
The next few sessions will be critical in determining whether this triangle resolves bullishly or bearishly.
The Symmetrical Triangle
A Symmetrical Triangle forms when price makes lower highs and higher lows simultaneously — compressing into a tighter range as neither buyers nor sellers gain control. The upper boundary connects a series of declining highs from the October 2024 peak, while the lower boundary connects a series of rising lows from early 2025.
Both lines are converging toward an apex — and price is currently sitting right inside this breakout zone.
Yesterday's Bullish Candle — +3%
On July 1, HINDUNILVR closed with a strong +3% bullish candle from the Support 1 area near ₹2,070. This candle:
Bounced strongly from the triangle's lower support boundary
Closed near the middle of the triangle range
Signals buyers stepping in aggressively at the lower boundary
This is the catalyst that makes today's price action particularly important.
Key Levels
🔴 Resistance 1 — 2,367 (Triangle Upper Resistance area)
🔴 Resistance 2 — 2,406
🔴 Resistance 3 — 2,477
🟡 Current Price — 2,182 (inside triangle)
🟢 Support 1 — 2,070
🟢 Support 2 — 2,006 (Swing Low)
Two Scenarios
🟢 Scenario A — Bullish Breakout
Price closes decisively above the Triangle Upper Resistance line (currently near ₹2,367) on a daily basis. This would confirm a bullish breakout from the 2-year triangle. Targets would be Resistance 2 at ₹2,406, then Resistance 3 at ₹2,477 progressively.
A breakout here would also signal potential sector rotation into FMCG — significant for the broader market.
🔴 Scenario B — Bearish Breakdown
Price fails to hold above Support 1 (₹2,070) and breaks below the Triangle Lower Support line. This would confirm a bearish breakdown from the triangle. Watch Support 2 at ₹2,006 (Swing Low) as the next key level.
⚪ Scenario C — Range Compression Continues
Price continues to compress inside the triangle between ₹2,070 and ₹2,367 for more sessions. In this case wait for a confirmed breakout in either direction with volume before acting.
Why Symmetrical Triangles Matter
A Symmetrical Triangle is one of the most reliable continuation or reversal patterns in technical analysis. It represents a period of indecision — energy building up before a decisive move. The longer the triangle forms, the more significant the eventual breakout tends to be.
With this triangle spanning nearly 2 years, the breakout — when it comes — is likely to be substantial in magnitude. Patience is required, but the setup is worth watching closely.
Conclusion
HINDUNILVR is at a technically significant junction. A 2-year Symmetrical Triangle is reaching its breakout zone, with yesterday's +3% candle suggesting buyers are defending the lower boundary. Watch the upper resistance at ₹2,367 closely — a daily close above this level would be a major breakout signal.
Do not predict — observe the close and react with confirmation.
For educational purposes only. Not financial advice. Always manage your risk.  Long
Long
MAXHEALTH | Multi-Pattern Breakout Points to Higher Highs📊 The Setup
Max Healthcare has broken out of both a Triple Bottom and a year-long descending trendline, creating a high-conviction bullish reversal.
The Triple Bottom formed over seven months near ₹935–₹945, where the stock found support. The breakout above the ₹1,100 neckline, which also marked the long-term trendline resistance, strengthening the validity of the move.
Two bullish patterns confirming in the same zone often signal a meaningful trend reversal.
📍 Fundamental Trigger
The breakout is backed by another year of strong execution.
FY26 Highlights
• Revenue: ₹8,373 Cr (+19.1% YoY)
• Net Profit: ₹1,442 Cr (+34.1% YoY)
• Free Cash Flow: ₹1,633 Cr (+13.6%)
• Q4 Revenue: ₹2,541 Cr (+9% YoY)
• EBITDA: ₹682 Cr (+8%), Margin 26.8%
• International Revenue: +12% YoY
• 22nd consecutive quarter of YoY growth
• Bed Occupancy: 75%
• Operational Beds: 4,966
🏥 Expansion Pipeline
• Brownfield expansions across Mohali, Mumbai, and Delhi to add nearly 20% bed capacity.
• Gurgaon greenfield hospital expected by the end of 2026.
• Lucknow: 712-bed hospital with ₹1,400 Cr investment, targeted for FY30.
• Kalinga Hospital, Bhubaneswar: 58.28% stake acquired, expanding presence in eastern India.
⚠️ Risk
The stock trades at around 75x trailing earnings, leaving limited room for execution misses.
EBITDA margin declined 40 bps YoY as the company invested ahead of capacity expansion. New hospitals typically weigh on near-term returns before reaching optimal occupancy. Regulatory price controls also remain a long-term sector risk.
Technical invalidation: A sustained close below ₹1,060.
🧠 Bottom Line
One of India's highest-quality private hospital operators is breaking out of a Triple Bottom and long-term trendline resistance at the same time.
The technical breakout is supported by 22 consecutive quarters of growth, record FY26 earnings, healthy cash generation, and a multi-year expansion pipeline extending through FY30.
A retest of ₹1,090–₹1,100 would offer a more favorable entry than chasing the breakout.
👇 Premium healthcare compounder or priced for perfection? Share your view.
🚀 Boost if helpful.
Not financial advice. Always do your own research.
 Long
Long
Long 
 Long
Long
IndusInd Bank: The Ultimate Squeeze Ready for Wave (V)?Looking at the multi-decade chart of IndusInd Bank, we are witnessing a massive financial story unfold. The stock has respected the same geometric boundaries for nearly 30 years, and it is now approaching a major decision point.
Here is a simple breakdown of the macro picture:
1. The 28-Year Parallel Channel
Since its inception in the late 1990s, the stock has traded inside a giant ascending parallel channel .
The bottom line has always acted as a rock-solid floor.
The top line acts as the ultimate ceiling.
2. The 6-Year Rest Phase (Wave IV)
After hitting an all-time high of ₹2,038 in 2018, the stock entered a long, exhausting correction. On an Elliott Wave basis, this looks like a classic abcde contracting triangle :
Point a: The March 2020 COVID crash floor at ₹235.55. Interestingly, Point a bottomed out exactly at the 0.5 log retracement of the entire Wave (III) rise, showing how perfectly the market respected this geometry.
Point e (The Final Floor): The recent correction held the structural support line around ₹750.50 .
By holding this level, the stock proved that buyers are still defending the long-term trend.
The Current Setup: The Squeeze
Right now, the stock is trading at ₹941.60 , sitting right at the apex of this 6-year triangle.
The Trigger: It is currently testing the white descending resistance line connecting points b and d.
The Breakout: A strong, decisive close above this trendline will signal that the 6-year correction is officially over.
The Trade Plan
The Bullish Target (Wave V): If the breakout is confirmed, it opens the door for a brand-new, multi-year bull market. The ultimate goal for Wave (V) would be to reclaim the old highs of ₹2,038 and trend toward the upper half of the multi-decade channel.
The Risk (Invalidation): The entire bullish setup relies on the recent floor holding. If the price breaks below ₹750 , the triangle pattern fails, and the view must be revised.
Disclaimer: This post is for educational purposes only and is not financial advice. I am not a SEBI-registered analyst. Please do your own research and manage your risk carefully.  Long
Long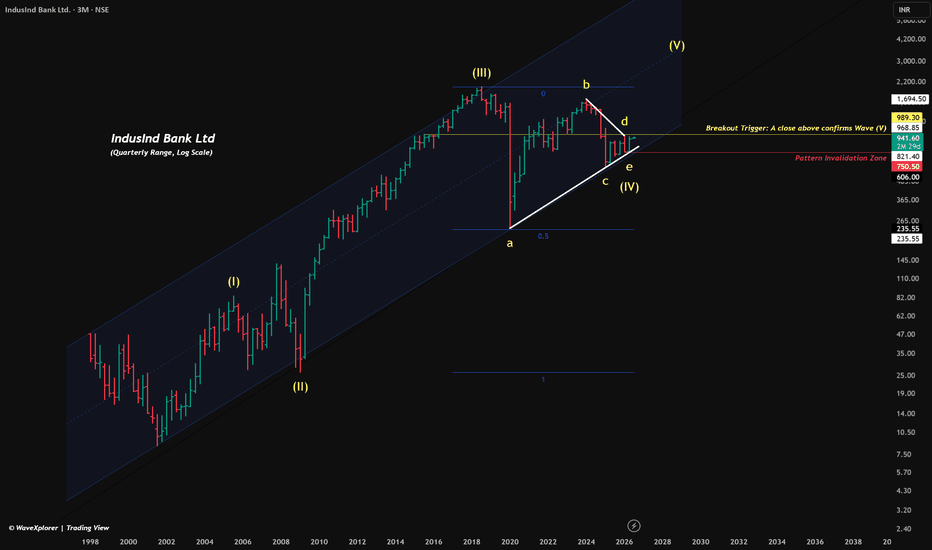
 Long
Long
 Long
Long
 Long
Long
Muthoot Microfin: Bullish Breakout Retest | Multi-Timeframe SwinAfter several months of consolidation, Muthoot Microfin is showing signs of renewed strength across multiple timeframes.
Weekly Outlook
Price is trading above the 20 EMA, 50 EMA, and Supertrend.
Weekly MACD has turned positive, indicating improving momentum.
RSI remains above 60, supporting the bullish trend.
The long-term structure is transitioning into a higher-high, higher-low pattern.
75-Minute Chart
The stock has built a strong base and is now testing a key resistance zone near ₹221, which previously acted as a supply area.
Key observations:
Price above 20, 50, and 100 EMA.
Both Supertrend indicators remain bullish.
Fresh MACD bullish crossover.
RSI is holding above 60.
Higher highs and higher lows indicate improving market structure.
Trade Plan
Entry: Above ₹221.50 after a confirmed breakout, or on a successful retest of the breakout zone.
Stop Loss: ₹214.
Target 1: ₹230.
Target 2: ₹240.
Target 3: ₹252.
Key Level to Watch
The ₹217–221 zone is the most important resistance. A decisive close above this level with increased volume could pave the way for the next leg of the uptrend.
Disclaimer: This analysis is for educational purposes only and reflects my interpretation of price action. Always conduct your own research and manage risk appropriately. MCX: Multi-Timeframe Bullish Setup | Consolidation Breakout + St📈 Technical Overview
MCX has been in a strong long-term uptrend, and after a healthy correction, the stock has entered a period of consolidation on the 75-minute timeframe. Price is now attempting to break out of this range with improving momentum.
Weekly Timeframe
✅ Price trading above the 20, 50 & 100 EMA
✅ Bullish EMA alignment (20 > 50 > 100)
✅ Weekly Supertrend remains positive
✅ Long-term uptrend intact
The higher timeframe continues to favor buyers, indicating that the primary trend remains bullish.
75-Minute Timeframe
📦 Well-defined consolidation after the recent decline
🚀 Price attempting a breakout above the consolidation range
📊 Breakout supported by above-average volume
📈 RSI above 60, indicating strengthening momentum
📉 MACD has generated a fresh bullish crossover
✅ Price trading above both Supertrend indicators
This setup suggests the possibility of a fresh impulse move if the breakout sustains.
🎯 Key Levels
Entry Zone
Breakout above the consolidation range or on a successful retest.
Support
₹2,930–2,950 (Breakout Zone)
₹2,900 (20 EMA)
Resistance
₹3,000 (Psychological Resistance)
₹3,100
₹3,250–3,350
📌 Fundamental Catalysts
Recent developments further strengthen the technical setup:
💼 Jefferies initiated coverage with a 'Buy' rating, citing strong earnings growth potential and long-term upside.
🏦 UTI Mutual Fund accumulated approximately ₹425 crore worth of MCX shares through a bulk deal, reflecting institutional confidence in the company's long-term prospects.
When positive technical structure aligns with institutional buying and favorable analyst coverage, it often creates a supportive environment for trend continuation.
⚠️ Risk Management
A breakout is only considered valid if the price sustains above the breakout zone with healthy volume.
If price falls back below the consolidation range, the breakout thesis becomes weaker and traders should reassess the setup.
💡 Trading Plan
Wait for breakout confirmation or a pullback to the breakout zone.
Avoid chasing large gap-up openings.
Trail profits using the Supertrend or the 20 EMA as long as the trend remains intact.
Disclaimer
This analysis is shared for educational purposes only and reflects my personal interpretation of price action and publicly available information. Please conduct your own research and manage your risk before making any investment decisions.
If you found this analysis useful, don't forget to 👍 Boost, ❤️ Like, and share your thoughts in the comments!  Long
Long
When the Golden Level Becomes a TrapSometimes the most powerful moves aren't born from clean breakouts — they're born from breakdowns that fail
The Two Flip Zones
Marked on the chart are two horizontal zones — both former resistance areas that, after being broken, converted into support. These are flip zones. Markets have memory, and when a level that once rejected price begins to hold it instead
The Fibonacci Retracement & The Golden Level
Fibonacci retracement maps mathematically significant levels between a major high and low — 38.2%, 50%, and most importantly, 61.8%, widely known as the golden ratio. A common read in technical analysis is that if price breaks below 61.8%, the structure turns bearish in nature.
Now Here's the Thought
Most traders know that rule. And because most traders know it, the 61.8% breakdown triggers a wave of selling, stop losses, and bearish conviction. But what happens when a stock breaks below that golden level, shakes everyone out — and then climbs back above it strongly? That's not a breakdown anymore. That's a trap. And a trap at the most watched Fibonacci level in the market, aligning with a flip zone, tells a very different story
The Parallel Channel
Marked in white lines, the ascending parallel channel frames the broader price structure — two rising trendlines containing price between a rising support and resistance.
Disclaimer: This post is for educational and informational purposes only. It does not constitute financial advice, a forecast, or a recommendation to buy, sell, or hold any security.Past price structures and technical levels do not guarantee future outcomes.  Long
Long
 Long
Long