ATGL: Weekly Rounding Bottom Breakout1. The Macro Perspective: The Deep Washout and Reversal
I am taking a LONG bias on Adani Total Gas Ltd. (ATGL) on the macro weekly (1W) timeframe.
When analyzing pure market structure on a high-growth utility stock, prolonged, deep structural corrections are required to flush out weak retail hands and build a fresh accumulation base. Look at the comprehensive structural development displayed across this chart. Following a steep and painful markdown phase throughout 2024 and early 2025, the stock cascaded down into a deep washout zone. Instead of consolidating at the absolute lows, heavy institutional capital systematically stepped in, carving out a massive, extended rounding bottom reversal pattern over the past year. Fundamentally, this fierce technical momentum aligns with the company's Q4 FY26 results, where standalone profit after tax (PAT) rose 4% year-on-year to ₹156 crore, and revenue from operations grew 16% YoY to ₹1,696 crore, driven by a 13% overall volume growth. Additionally, recent CNG price hikes have acted as a major catalyst; the stock has surged significantly in the past month as investors anticipate improved realizations and profitability in upcoming quarters.
2. The Educational Setup: The 701.00 Resistance Clearance
To understand the technical validity behind this macro launch, look closely at how the price structure interacted with its core boundaries during the accumulation phase:
The 701.00 Pivot Ceiling: The definitive line in the sand for a bullish structural shift was the solid black horizontal resistance line drawn at 701.00. This level marked the absolute ceiling of the rounding bottom formation. Clearing this level on a closing basis was essential to officially break out of the accumulation box and confirm a macro trend reversal.
The Dynamic Base: Notice the beautiful price action forming the right side of the rounding bottom throughout early 2026. The stock printed a sequence of higher lows, systematically grinding up against the 701.00 resistance and building immense kinetic energy just beneath the breakout zone.
3. Current Price Action: Momentum Expansion
Look at the most recent weekly candles on the far right of the chart. The structural reversal has been thoroughly validated. Institutional buyers have seized total control of the tape, printing a powerful, full-bodied green expansion candle on a towering, massive volume bar. The stock has decisively obliterated the 701.00 ceiling and is currently trading strong near the 773.30 level. This explosive thrust confirms that the asset has officially transitioned out of the long, low-volatility accumulation phase and into a highly explosive, high-volatility secular markup trend.
4. The Trade Plan: Entries, Targets, and Risk Management
Entry Strategy: Momentum is exceptionally strong with the stock trading firmly out in the open above the pivotal breakout line. Chasing an extended vertical weekly move carries a minor risk of a short-term, lower-timeframe mean-reversion pullback. The highest-probability, lowest-risk entry strategy involves stepping down to the daily timeframe and looking to scale into long positions on any minor structural cooling-off period that perfectly retests the broken 700.00 to 720.00 zone. Letting old historical resistance prove itself as a concrete new support floor provides an unmatched risk-to-reward ratio.
Take Profit (Targets): Because the stock has confirmed a major structural reversal out of a massive depression, the primary objective is to target the origin of the previous markdown phase. Our primary structural macro target is a full retracement back to the heavy red historical resistance line sitting comfortably at the 1,187.30 level over the coming quarters.
Invalidation (Stop Loss): A structural reversal thesis is completely invalidated if the price fails to hold its newly claimed structural floor and collapses back into the core of the rounding bottom structure. A hard stop loss should be placed safely below the recent right-side swing lows, specifically around the 620.00 to 640.00 level. A definitive weekly close completely back below 600.00 would act as a severe warning sign of a failed macro reversal and a major bull trap.
5. Time Horizon:
Because this technical setup is built on a 1-Week chart capturing a massive structural phase transition and a major pivot breakout, this is a longer-term position trade designed to capture a secular markup phase over the coming months and quarters. Let the macro trend run!  Long
Long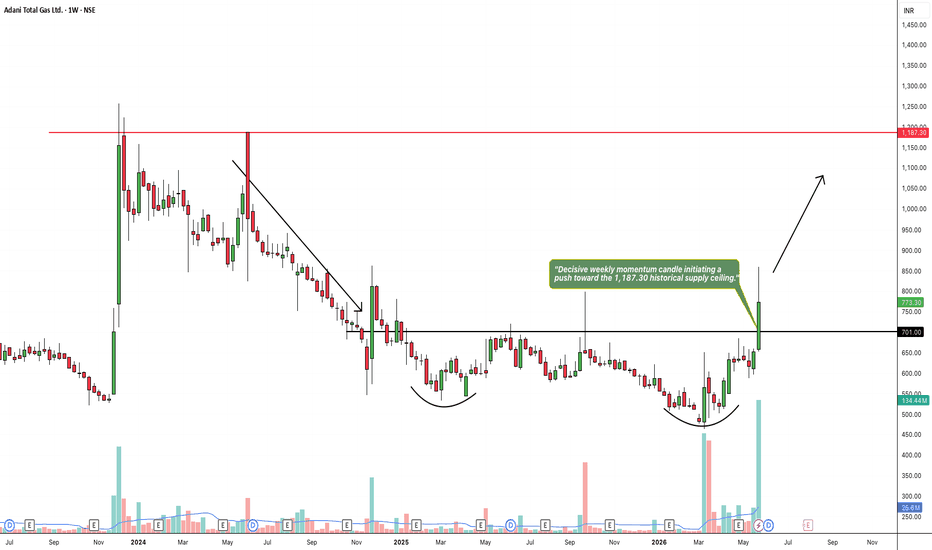
TCS Monthly | Below 200 EMA — 15-Year Trendline Meets 0.786 FibOverview
Tata Consultancy Services — India's largest IT company by market cap — is at one of the most significant technical junctions in its entire listed history. On the Monthly timeframe, TCS has broken below its 200 Monthly EMA and is now in a deep Fibonacci retracement, approaching a confluence of two major long-term support structures.
This is a long-term view. The analysis covers price action spanning over 15 years.
The Fibonacci Structure
The Fibonacci retracement is drawn from the all-time high of ₹4,592 (0) to the major base of ₹1,072 (1) — a complete measurement of TCS's entire bull run.
Key levels:
0.236 — ₹3,761 (broken)
0.382 — ₹3,247 (broken)
0.5 — ₹2,832 (broken)
0.618 — ₹2,417 (broken)
0.786 — ₹1,826 (next major support)
Current price at ₹1,982 has already broken through the 0.618 level — a deep retracement level that typically signals either strong long-term buying opportunity or a fundamental structural shift.
The 200 Monthly EMA — A Rare Signal
TCS is currently trading below its 200 Monthly EMA at ₹2,087. This is an extremely rare occurrence for a quality large-cap stock of TCS's caliber. Historically, price trading below the 200 monthly EMA signals a major long-term trend shift and typically attracts significant institutional attention — either for accumulation or further distribution.
The Critical Confluence — 15-Year Trendline + 0.786 Fibonacci
The most important element on this chart is the convergence of two independent structures:
🟢 15-Year Rising Trendline — connecting the lows from 2011 all the way to present. This trendline has held through multiple market cycles — COVID crash, global selloffs, and sector rotations.
🟡 0.786 Fibonacci level at ₹1,826 — the deepest standard Fibonacci retracement level before a full 100% retracement.
Both of these meet at approximately the ₹1,826–1,900 zone — making this the most critical support area on TCS's entire chart history.
Key Levels
🔴 Resistance 1 — 3,342
🔴 Resistance 2 — 3,477
🔴 Resistance 3 — 3,647
🔴 Resistance 4 — 4,310
🟡 200 Monthly EMA — 2,087 (now resistance)
🟢 Current Price — 1,982
🟢 Major Confluence Support — 1,826 (0.786 Fib + 15-Year Trendline)
🔴 Full Retracement Base — 1,072
Two Scenarios
🟢 Scenario A — Confluence Holds
Price reaches the ₹1,826–1,900 confluence zone and finds strong long-term buyers. This would represent one of the best risk-reward buying opportunities in TCS's history — with the 15-year trendline and 0.786 Fib acting as dual support. First recovery target would be reclaiming the 200 Monthly EMA at ₹2,087, then progressively higher resistance levels.
🔴 Scenario B — Confluence Breaks
If price breaks below ₹1,826 on a monthly closing basis, both the 15-year trendline and the 0.786 Fibonacci support fail simultaneously. This would be a historically significant breakdown — signaling a fundamental long-term structural change for TCS. Next reference level would be the full retracement base near ₹1,072.
Important Context
This analysis is on the Monthly timeframe — each candle represents one full month of price action. Setups on this timeframe play out over months to years, not days. This is not a short-term trade setup — it is a long-term structural view for investors and positional traders.
TCS results are due soon — fundamental developments will interact with these technical levels. Always combine technical analysis with fundamental context before making decisions.
Conclusion
TCS is approaching a historic confluence — a 15-year rising trendline meeting the 0.786 Fibonacci retracement at ₹1,826. Whether this level holds or breaks will define TCS's long-term trajectory for years to come.
This is a level worth watching very carefully over the coming months.
For educational purposes only. Not financial advice. Always manage your risk. AJANTPHARM: Massive Cup and Handle & Step-Up Base Breakout1. The Macro Perspective: The Staircase and the Floor
I am taking a LONG bias on Ajanta Pharma Limited (AJANTPHARM) on the daily (1D) timeframe.
When analyzing pure market structure, the healthiest and most sustainable trends climb stairs. Look at the structural development on the left side of this chart. The stock initiated a massive run from the 2,363.10 floor, successfully breaking through the mid-level resistance at 2,816.70, and charging all the way up to establish a historical macro ceiling at the solid black 3,145.40 line. After such a massive run, exhaustion is natural. However, look at how the pullback was handled. The stock sold off but found an absolute concrete floor exactly at the 2,816.70 line. It perfectly retested its previous structural stepping stone, confirming that old resistance had officially become indestructible support.
2. The Educational Setup: The Pressure Cooker Handle
To understand the sheer strength of this current breakout, look at how the price systematically transitioned from accumulation back into a markup phase:
The Massive Cup: By using the 2,816.70 line as a foundation, the stock carved out a massive "Cup" or rounding bottom, systematically absorbing overhead supply and marching back to challenge the historical ceiling.
The High-Level Squeeze: As the price reached the resistance zone (marked by the dashed 3,125.95 and solid 3,145.40 lines), it didn't suffer a brutal double-top rejection. Instead, institutional buyers aggressively defended the structure, forming a tight consolidation flag right beneath the resistance. This high-level absorption forms the "Handle." It acts like a pressure cooker, transferring shares from impatient retail traders to strong-handed institutional buyers and storing immense kinetic energy.
3. Current Price Action: Blue Sky Territory
Look at the most recent daily candles on the far right, accompanied by a surge in buying volume. The high-level pressure cooker has absolutely exploded. Buyers have effortlessly shattered the 3,145.40 macro ceiling with a violent momentum thrust, pushing the price well into the 3,250 zone. Furthermore, look at the RSI indicator on the bottom panel. It is currently sitting near 75 and pointing sharply upward. It successfully cooled off during the handle formation and is now confirming massive institutional strength. By decisively clearing this massive accumulation zone, AJANTPHARM has officially entered "Blue Sky Territory" (pure price discovery).
4. The Trade Plan: Entries, Targets, and Risk Management
Entry Strategy: Momentum is exceptionally strong right now near 3,259.20. Chasing a massive daily expansion candle with an RSI pushing 75 always carries a higher risk of an immediate intraday drawdown as the stock naturally breathes. The highest-probability, lowest-risk entry involves stepping down to an hourly timeframe and placing limit orders to catch a potential minor structural pullback to perfectly retest the 3,125.00 to 3,150.00 breakout zone. Letting that heavy historical resistance prove itself as a new support floor offers a phenomenal risk-to-reward ratio.
Take Profit (Targets): We use measured structural targets based on the depth of the macro base. By taking the depth of the massive Cup (roughly 330 points from the 2,816.70 floor to the 3,145.40 ceiling) and projecting it upward from the breakout line, our primary structural swing target sits comfortably in the 3,470.00 to 3,480.00 zone. The massive 3,500.00 mark acts as the ultimate psychological magnet.
Invalidation (Stop Loss): A trade thesis is only valid if the new market structure holds. A hard stop loss should be placed safely below the handle consolidation, around the 2,980.00 to 3,000.00 level. A definitive daily close completely back below the 3,100 mark would act as a massive warning sign of a failed structural breakout and a severe bull trap.
5. Time Horizon:
Because this technical setup is built on a 1-Day chart capturing an explosive Cup and Handle completion into fresh price discovery, this is a short-to-medium-term swing trade designed to capture the violent momentum thrust. Let the new trend run!  Long
Long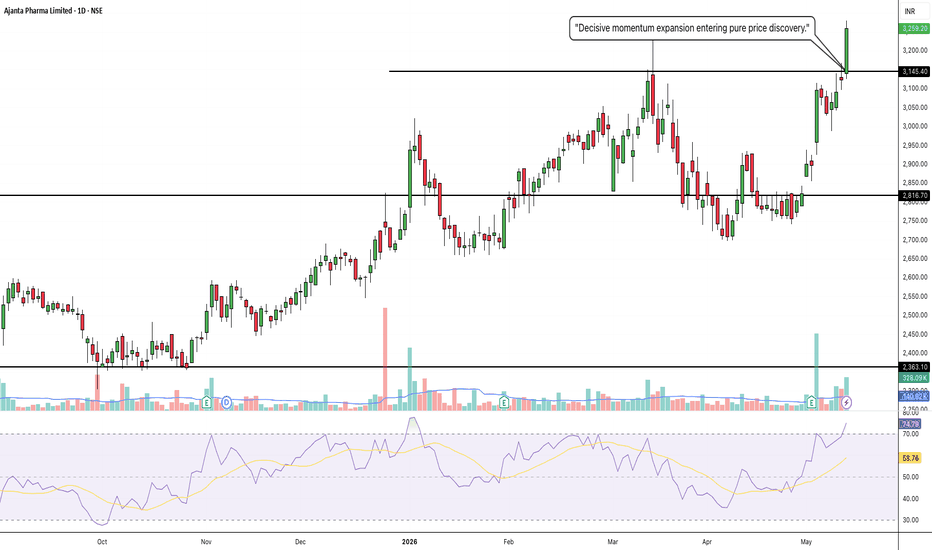
AEGISLOG: Weekly Macro Box Breakout1. The Macro Perspective: The Structural Consolidation Box
I am taking a LONG bias on Aegis Logistics Limited (AEGISLOG) on the macro weekly (1W) timeframe. Following a massive initial run-up, the stock entered a protracted digestion phase, carving out a wide, high-precision horizontal consolidation box. This extended basing period allowed the market to absorb overhead supply and let institutional capital quietly accumulate shares before initiating the next leg of a secular markup phase.
2. The Educational Setup: Horizontal Boundaries
To understand the technical validity behind this move, look closely at how the price structure interacted with its core boundaries:
The 920.00 Upper Resistance: The definitive ceiling was the horizontal resistance line drawn near 920.00. This level established a significant supply zone that repeatedly capped upward price momentum over the past period.
The 600.00 Lower Support: Complementing the resistance was a firm horizontal floor near 600.00. Buyers consistently stepped in to defend this zone, essentially coiling the spring for the next primary trend move.
3. Current Price Action: Breakout and Volatility Expansion
The structural pressure cooker has officially exploded. Look at the most recent weekly candle on the far right of the chart. Institutional buyers have stepped in with undeniable conviction, backed by a massive surge in trading volume. The stock printed a towering green expansion candle that decisively obliterated the 920.00 macro ceiling, currently trading incredibly strong near 1,006.90. The stock has officially transitioned out of macro accumulation and into a highly explosive markup trend into fresh territory.
Note: Always wait for the final weekly close to confirm the strength of the breakout and ensure no false breakout wicks appear.
4. The Trade Plan: Entries, Targets, and Risk Management
Entry Strategy: Macro momentum is exceptionally strong. Chasing an extended weekly breakout candle carries a minor risk of a short-term mean-reversion pullback. Look to scale into long positions on a potential structural pullback to retest the broken 900.00 to 920.00 prior resistance zone. Letting old historical resistance prove itself as a concrete new support floor provides an unmatched risk-to-reward ratio.
Targets: We use a classical measured move strategy for rectangular box breakouts. By taking the full height of the consolidation range (the approximately 320-point distance from the 600.00 floor to the 920.00 ceiling) and projecting it upward from the breakout point, our primary structural macro target sits comfortably in the 1,200.00 to 1,240.00 zone over the coming quarters.
Risk Management: An explosive macro breakout thesis is invalidated if the price fails to hold its newly claimed structural floor and collapses back inside the core of the base. A hard stop loss should be placed safely below the recent breakout structure, specifically around the 840.00 to 860.00 level. A definitive weekly close back inside the old range would act as a warning sign.
5. Time Horizon:
Because this technical setup captures a clear structural phase transition and a major horizontal box breakout on the 1-Week chart, this is a long-term position trade designed to capture a sustained secular markup phase. Let the trend run!  Long
Long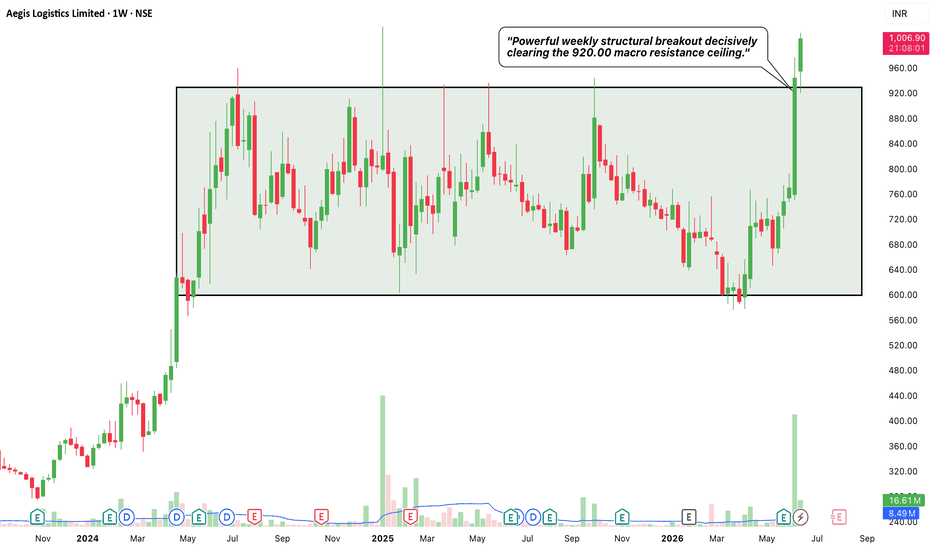
 Long
Long
 Long
Long
 Long
Long
 Long
Long
 Long
Long
 Long
Long
 Long
Long
 Long
Long
 Long
Long


