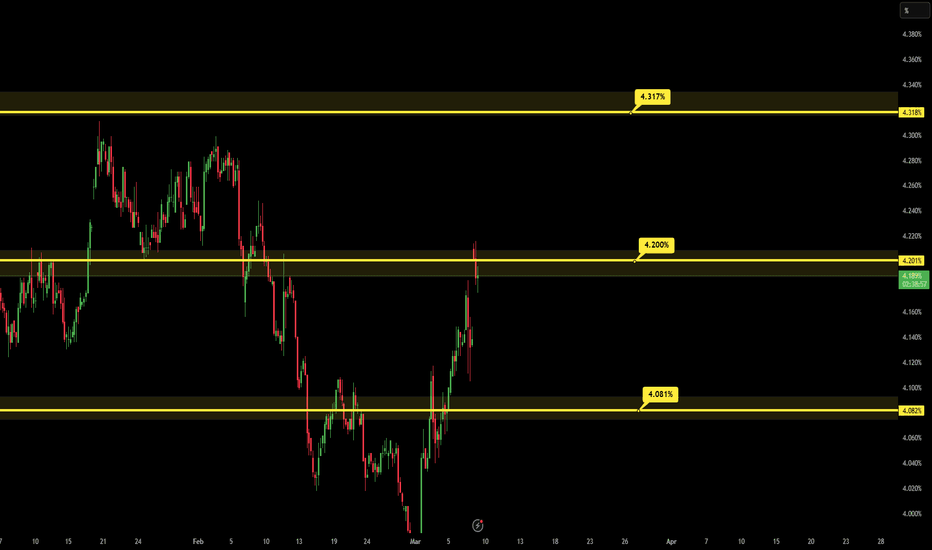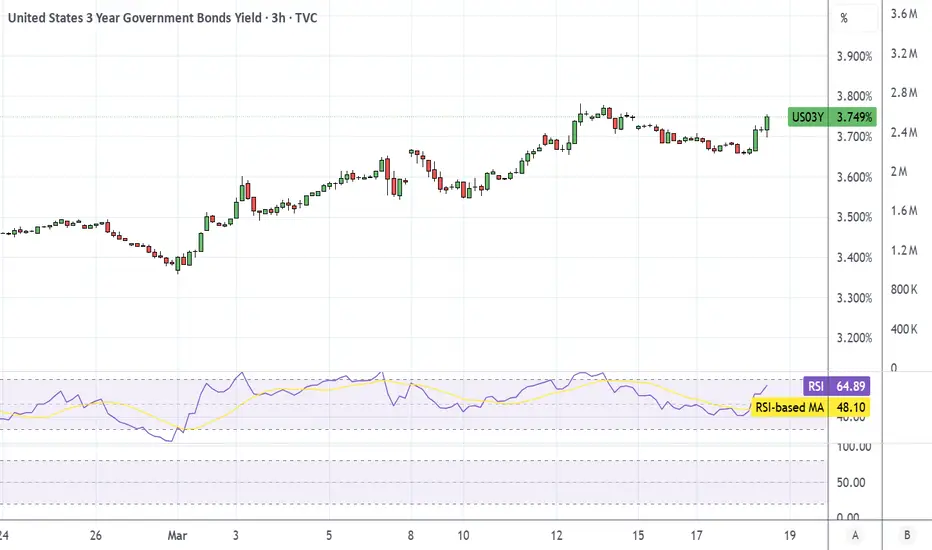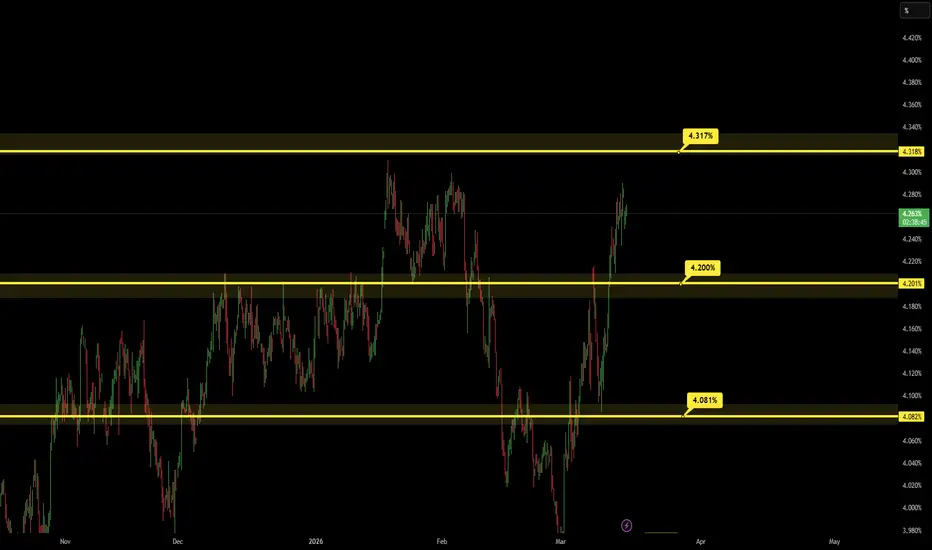
3 YR BondOdd that 3 yr bonds are selling off after the Fed meeting considering it's at the current target rate. Basically the market is ignoring the Dot Plot that shows a rate cut later this year.
If bonds drop any further, they're pricing in a rate hike.
Also, dollar climbing, that's bad for gold, silver, and shitcoin. Gold is oversold on my 3hr chart though.
Government bonds
US 10Y TREASURY: Nervousness ahead of Fed meetingThere are currently a lot of topics which are bringing insecurity among investors, which is one of the main reasons for a huge swing in the 10Y Treasury yields since February this year. The first place is the US macro picture which is bringing some of the latest data pointing to a weaker than expected growth of the US economy. As per posted second estimate of Q4 GDP Growth, the US economy grew only 0,7% q/q, while the market was expecting to see at least 1.4% for the same period. Adding to this
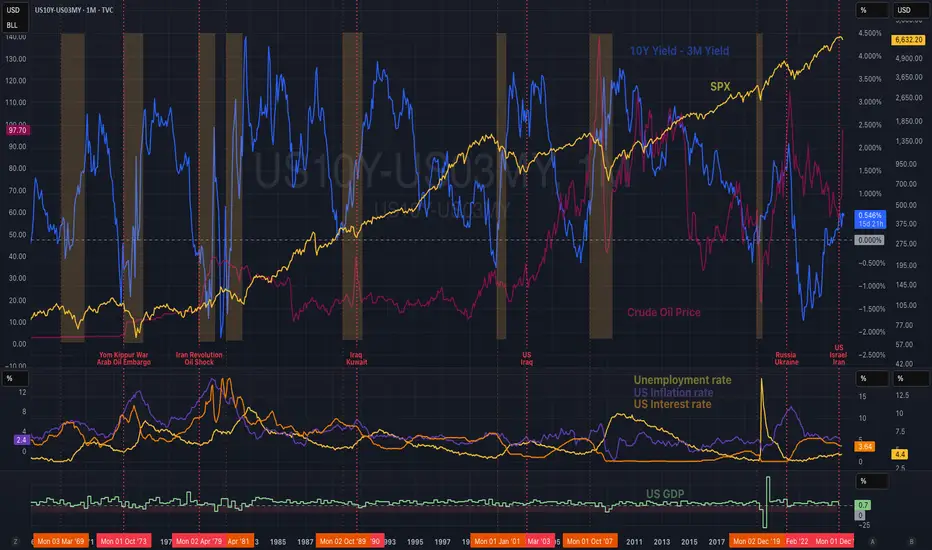
S&P 500, Oil Shock, and Why Recession Risk Is Rising?Almost two years ago, in my post “ A Recession Is Coming - Brace for Impact ”, I talked about the inverted yield curve as a warning sign. Now the curve has already un-inverted, and that part matters a lot.
In my opinion, the inversion is usually the warning, and the un-inversion is often when the economy starts to feel the pressure that the bond market had already priced in earlier.
The New York Fed’s model, updated with data through January 2026, shows a January 2027 recession probabilit
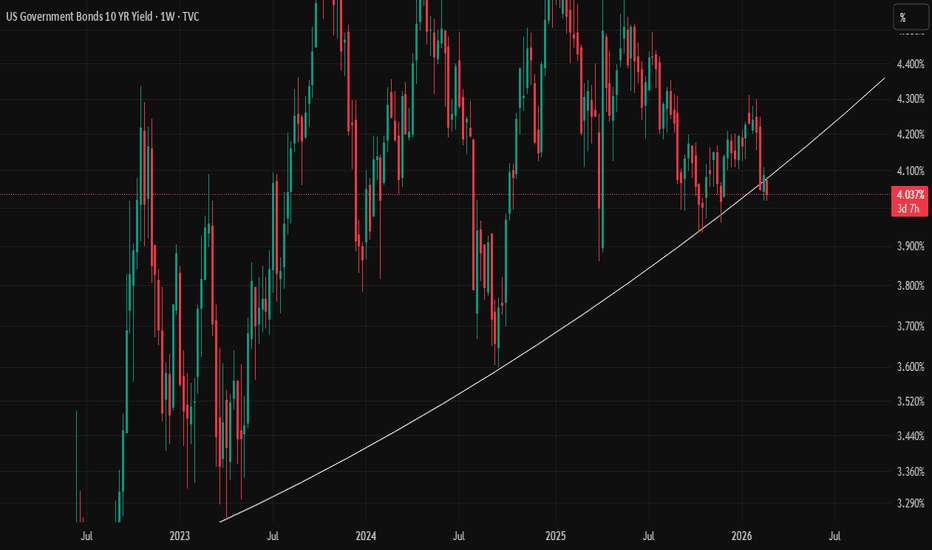
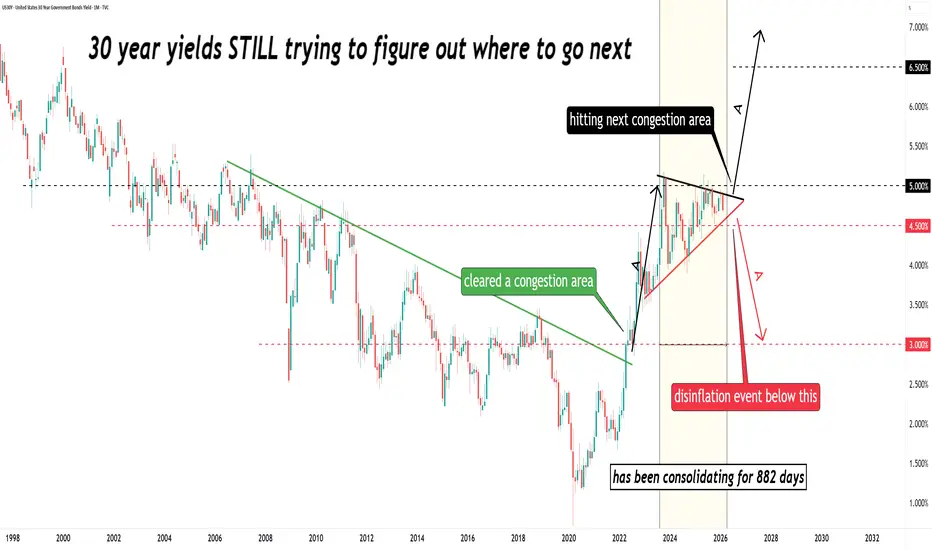
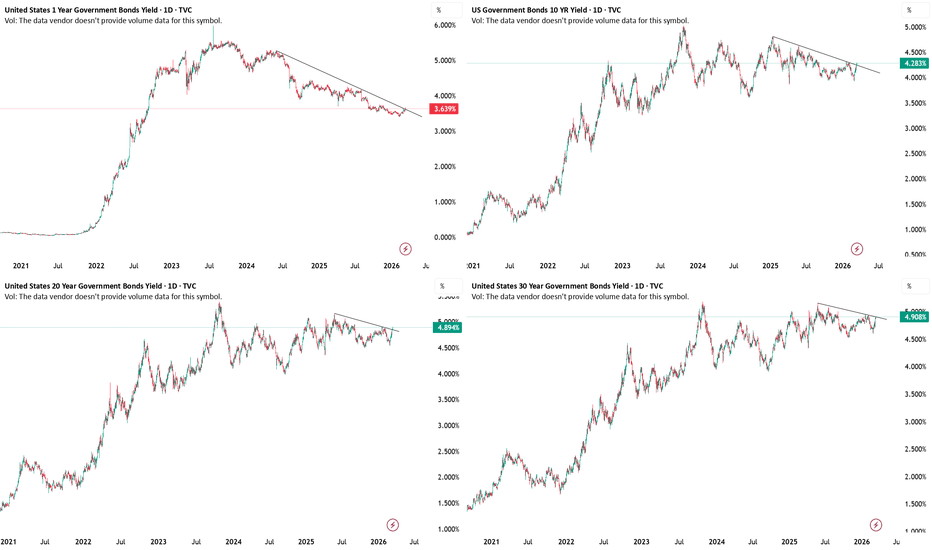
Bonds Yields Long, Bonds Short: Treasury Yields BreakoutOver here, I showed the yields for 4 different maturities: 1 yr, 10 yr, 20 yr, and 30 yr. All shows that we have broken a trendline. What this means is that US debt problems are only going to escalate. It will become increasing costly to issue treasury debts.
I leave you with the charts to decide for yourself.
Good luck!
US 10Y TREASURY: Volatile on inflation riskMiddle East tensions, rising oil prices and weakening job market had a huge impact on 10Y US Treasuries during the previous week. There has been significant volatility, where yields sharply rose from 3,92% up to 4,18%, closing the week at 4,13%. Due to conflict in the Middle East, the price of oil was significantly increased, threatening a new wave of inflation across developed economies, but also in the US. This will make the Fed's decision to cut interest rates extremely difficult. If we add
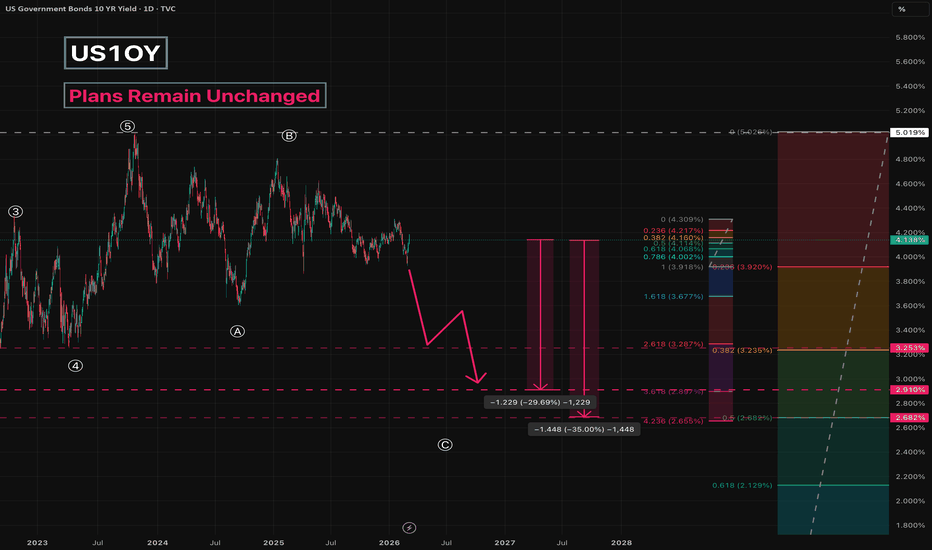
US10Y - Plans Remain UnchangedLet’s return to TVC:US10Y
In the original idea, we outlined the main plan of events:
A new impulse has appeared, based on which initial targets can be set.
First, we expect a corrective move in the 4.2-3.9 range, followed by a downward continuation.
Key targets:
3.25 - local correction
2.91
2.68
Potential move from current levels: ~30-35%
On a broader scale, yields should move much lower, but that will be discussed in other ideas.
A return to 5.01 seems very unlikely. Ev
US 10Y TREASURY: Rising stagflation risk Although the 10Y US Treasury yields were holding ground above the 4% during the week, still, Friday's PPI data moved yields toward the lower grounds, closing the week at 3,96%, after reaching 3,94%. January PPI data came hotter than expected, with 0,5% surge for the month and 2,9% y/y. Core PPI reached 3,6% y/y. The cautious positioning of investors reflected expectations that hotter inflation data could reinforce the case for the Federal Reserve to keep rates steady, prompting some bond buyers
My view on the key points in the US Government Bonds 10 YR YieldI have laid out the key points for bond enthusiasts that a trader should know from my perspective. They are prone to error before being correct, and the trader is not obligated to follow them. The decision ultimately rests on your personal analysis, and I am merely an assistant in identifying the trend. Good luck to all.
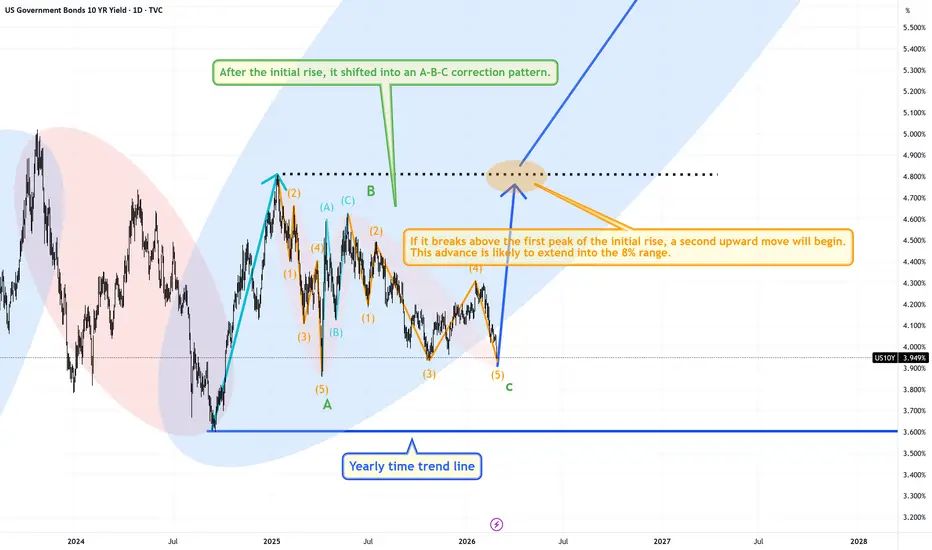
US10Y Time Wave Analysis updateI’m posting an update since the last note,
as the correction pattern changed after the initial rise.
However, the overall upward structure remains intact.
If the price surges above the black dotted line and, even after a pullback, does not return to its previous level,
it could climb into the 8% range.
Thinking about what lies ahead is frightening.
I sincerely urge everyone to return to God.
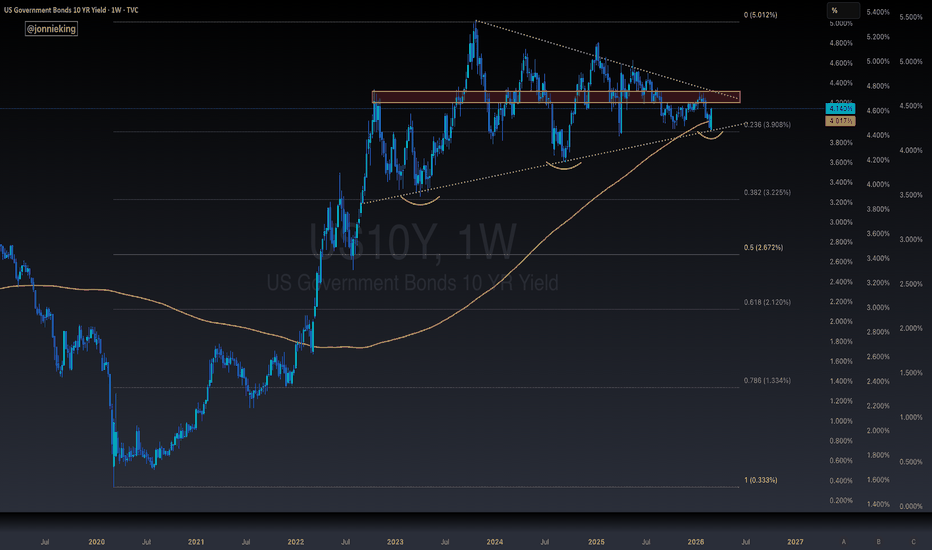
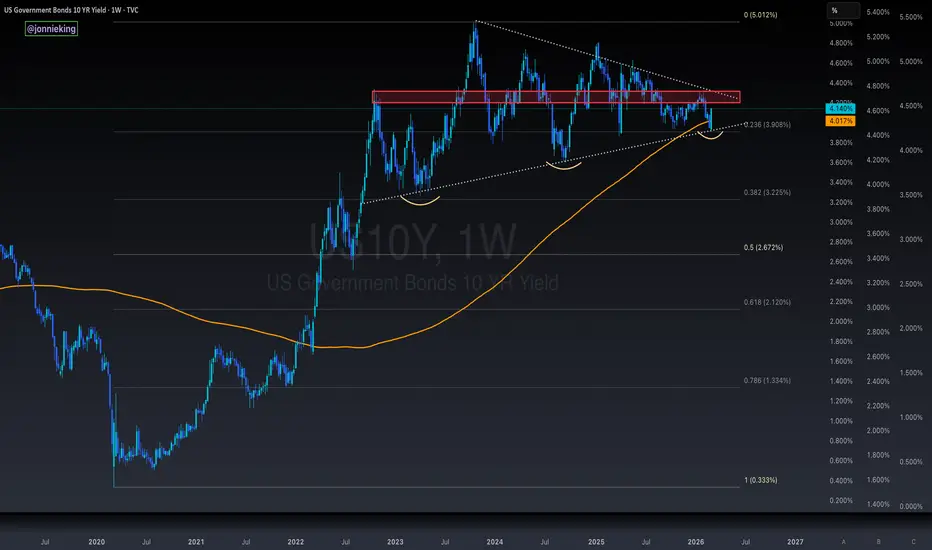
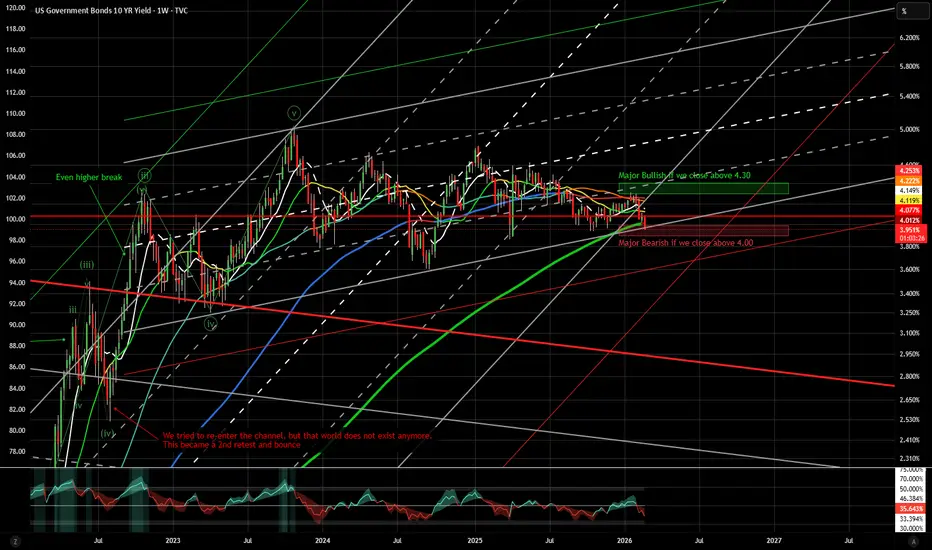
RATES DOWNAnybody looking to refinance a loan?
The chance may be yours later this year (assuming credit is available and banks are lending...)
The 10Y broke down this week officially.
Broke below the channel
Broke below the 200 weekly sma. WOW
and closed below it just now.
This means recession is here right now.
Rates break down like this at the beginning of downturns, or after downturns have already begun.
Equities are beginning to price this in.
Expect -25% at least in the indexes (SPY, QQQ, DJI)
Ex
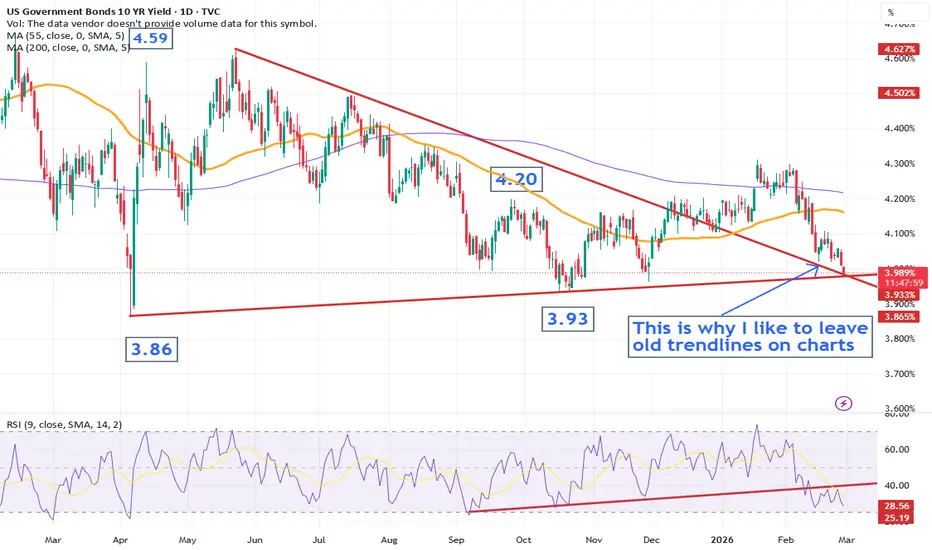
Key Support Test on the US 10‑Year YieldLooking at the US 10‑year yield daily chart, you’ll see I’ve kept a couple of old trend lines on there—because they have a habit of becoming relevant again. And that’s exactly what’s happened. The old downtrend from the May 2025 high is now acting as support, lining up perfectly with the April 2025 support line around 3.98%. With today being Friday, the weekly close matters. The real question is: does 3.98% hold?
(Not investment advice.)
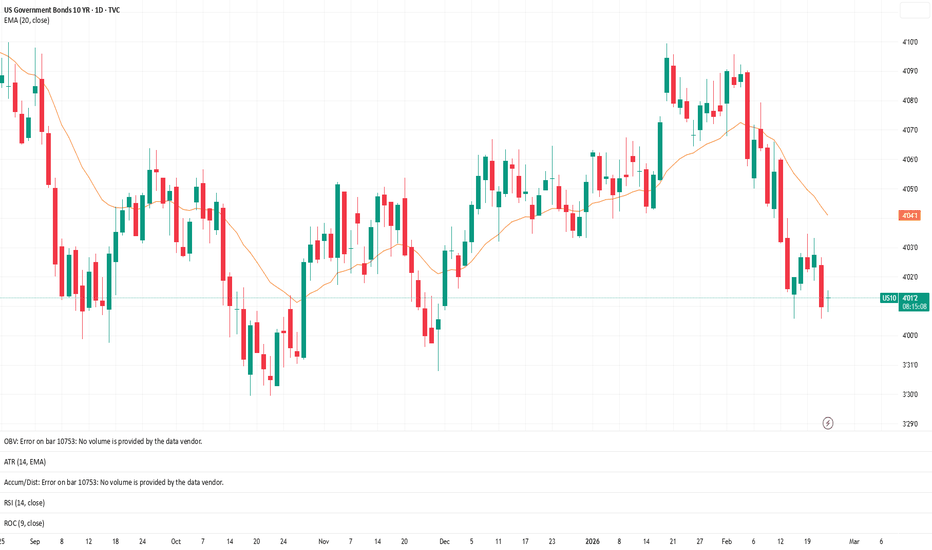
How to Read Long-Term Interest Rate Structure Using the 20 EMALong-term yields reflect growth expectations and inflation pressure in the broader economy.
This chart shows the U.S. 10-Year Yield on the daily timeframe, using the 20 EMA as a structural guide.
Rather than predicting direction, the goal is to understand behavior.
What the 20 EMA Represents
• When price holds above the 20 EMA, long-term rate pressure is building
• When price loses the 20 EMA and fails to reclaim it, longer-term momentum begins cooling
• Repeated rejection at the 20 often si
Sticky Yields, Quiet Alarms: (2026 Outlook, Ep. 1: US Treasury)Sticky Yields, Quiet Alarms: A Subtle Signal Markets Shouldn’t Dismiss (2026 Outlook, Ep. 1: US Treasury)
Welcome to the first installment of our 12-part Investment Theme Outlook for 2026. Over this series, we will dissect 12 critical financial instruments through both fundamental and technical lenses to help you navigate the year ahead. We begin with the “bedrock” of global finance: the US 10-Year Treasury Yield.
________________________________________
The Investment Theme Outlook for 2026:
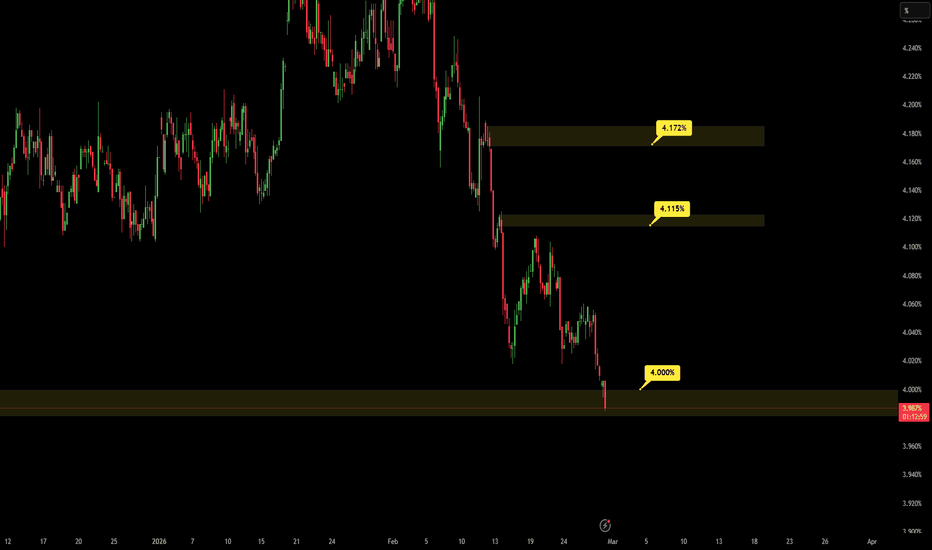
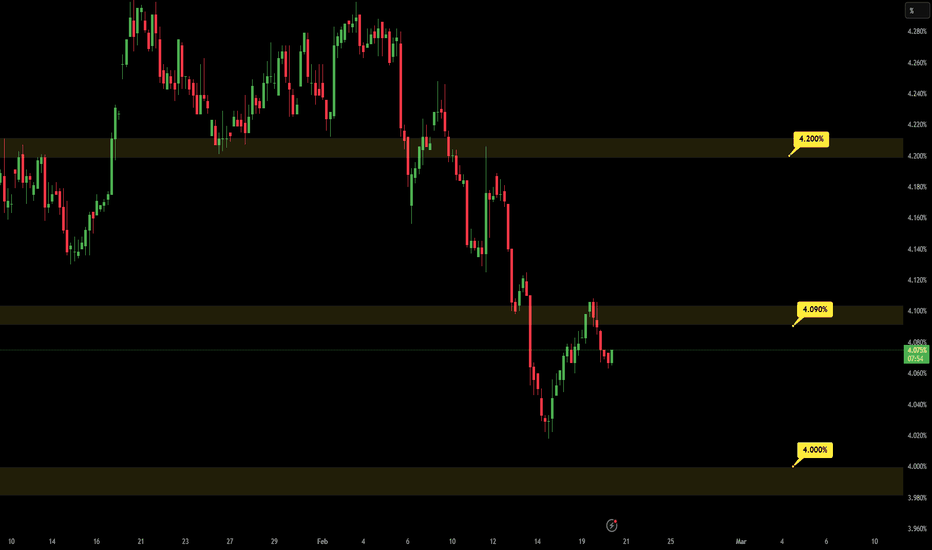
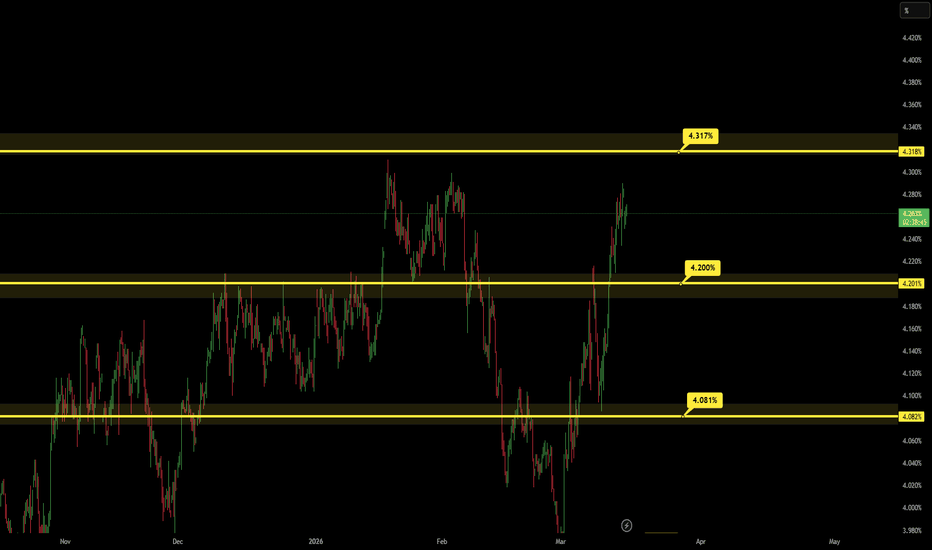
10Y BOND Expectation: 1 - 2 WeekBOND continues the down trend, and it can make retest on 4.115 point and come down till 4.0 point, it is depends on the QE action from FED and Interest rate expectations, above the 4.115 point, bond can increase till 4.172 point. which can be the last pump from the 10Y bond.
US 10Y TREASURY: Steady despite hot PCEU.S. 10Y Treasury yields were mostly flat during the week, moving between 4,02% and 4,08%, where they closed the week. The highest weekly level was at 4,1% on US PCE data. The latest Personal Consumption Expenditures (PCE) report, the Federal Reserve’s preferred inflation gauge, came by 0,1pp hotter than expected, reinforcing the view that price pressures remain persistent and potentially keeping the Fed from cutting rates soon. On the other hand, the GDP Growth rate in Q4 significantly missed e