Is the market ready to rally?
The fear is that debt becomes too expensive to carry—and lenders start questioning who can repay it. Credit markets are where governments and companies borrow.
There are two connected concerns right now:
Government debt: Heavy borrowing, inflation and higher rates are pushing up financing costs. Today’s reporting highlights global bond-market stress, particularly around heavily indebted governments and France’s fiscal troubles.
Corporate and private credit: Weaker companies face expensive re
ETF market
SPY Is Back Above 765.52 Ahead Of Payrolls.SPY Is Back Above 765.52 Ahead Of Payrolls.
SPY is trading 767.92 premarket, above the 765.52 line after Thursday's session closed at 763.99 having dipped to 758.79 on the ISM report. Premarket is not a close, and the September jobs report lands at 08:30 ET, so the reaction sets the read, not the early print. The hourly dashboard leans short with its last announcement bearish, while the 4H shows no thesis and a narrow-range warning - no agreement and no lean. Neutral.
Resistance: 770.09 - the
QQQ Weekly Outlook – Week 39 of 2026 (SEP 28 - OCT 02)PREVIOUS WEEK'S RECAP
UA CAPITAL Weekly Execution Metrics | WEEK 38
Total Trades Closed: 8
Winning Trades: 5
Losing Trades: 3
Overall Win Rate: 63%
Index Options: 3 Trades | 2 Wins / 1 Loss (QQQ - SPY)
Futures: 5 Trades | 3 NQ Wins / 2 ES Losses
Equities / Precious Metals / Forex: 0 Trades
Result: Profitable week.
This Week's Prediction / Scenarios
Risk Index
What is the Risk Index Oscillator?
This oscillator reads macro conditions and converts them into a technical risk framework.
SPY|SPX Weekly Outlook – Week 39 of 2026 (SEP 28 - OCT 02)PREVIOUS WEEK'S RECAP
UA CAPITAL Weekly Execution Metrics | WEEK 38
Total Trades Closed: 8
Winning Trades: 5
Losing Trades: 3
Overall Win Rate: 63%
Index Options: 3 Trades | 2 Wins / 1 Loss (QQQ - SPY)
Futures: 5 Trades | 3 NQ Wins / 2 ES Losses
Equities / Precious Metals / Forex: 0 Trades
Result: Profitable week.
This Week's Prediction / Scenarios
Risk Index
What is the Risk Index Oscillator?
This oscillator reads macro conditions and converts them into a technical risk framewor
MSTX Breakout in progress (2x Leverage ETF)NASDAQ:MSTX looks ready to challenge the recent downtrend. After a healthy pullback from the $23 highs, price has pushed back above the falling wedge and reclaimed the 21 EMA. Volatility compression dominated the consolidation phase, but the squeeze appears to be releasing as buyers step back in. A breakout above $21 could set up a move toward the prior highs near $23, while $18 remains the key support level. The bigger trend still favors the bulls as long as higher lows continue to hold. 📈
Di
Why Fixed OB/OS Levels Fail (and What Adaptive Levels Fix)
Pull up the RSI on any chart that's been trending for a year or more and count how many times it crossed above 70, and then count how many of those crosses came at a top you'd have wanted to sell. On the chart above I get 10 crosses… two of them were followed by pullbacks of -15% and -13%, and both of those were followed by new highs. The other eight produced nothing bigger than a routine dip, and the one decline that actually mattered (-25% off the June top) arrived without a fresh cross above
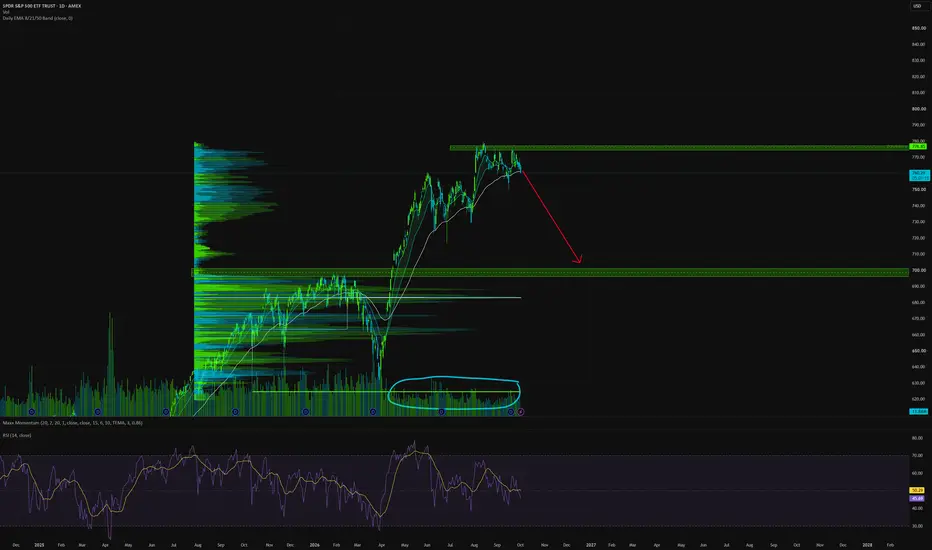
Bullish $SPY Idea1. $762–765 support
2. $769.67 Fibonacci resistance
3. $775.14 September high
4. $777.54 target
5. $782.09 extension.
Several potentially important catalysts are coming this month. The September employment report is scheduled for October 2, CPI for October 14, and PPI for October 15. The next FOMC meeting is scheduled for October 27–28.
There is also some evidence of improving near-term sentiment: Thursday's S&P 500 rebound came as Treasury yields retreated, while recent Fed commentary reduce
$SPY & $SPX — Levels for Friday, October 2, 2026🔮 AMEX:SPY & SPCFD:SPX — Levels for Friday, October 2, 2026
📊 Key U.S. Economic Data (ET)
8:30 AM | Average Hourly Earnings m/m | Forecast: 0.3% | Previous: 0.3%
8:30 AM | Non-Farm Employment Change | Forecast: 89K | Previous: 162K
8:30 AM | Unemployment Rate | Forecast: 4.1% | Previous: 4.1%
⚠️ For informational purposes only. Not financial advice.
📌 #SPY #SPX #Stocks #Trading #TechnicalAnalysis #NonFarmPayrolls #Employment
Check volatility before reusing yesterday's trade planA familiar chart pattern can appear in very different market conditions. Before reusing the same stop distance and position size, check whether recent movement has changed.
On this SPY 15-minute snapshot, Realized Volatility Term Structure shows:
• 10 bars: 12.8% annualized realized volatility.
• 30 bars: 20.0%.
• 240 bars: 18.0%.
• Short/long ratio: 0.71.
The shortest window is about 29% below the longest, but the 30-bar reading is still above it. The newest bars have been calmer relative to
Before you trust a volume spike, check the clockAn opening bar and a lunchtime bar should not need the same volume to get your attention. Compare each bar with previous bars from the same time of day.
The SPY 15-minute snapshot gives a concrete example. The panel's confirmed 15:45 slot shows 654.9K shares against a 740.8K slot median: 0.88x relative volume and the 43.3rd percentile, using 60 complete sessions on the displayed feed. A large-looking absolute number can still be ordinary for that clock slot.
Time-of-Day Volume Normalizer suppl
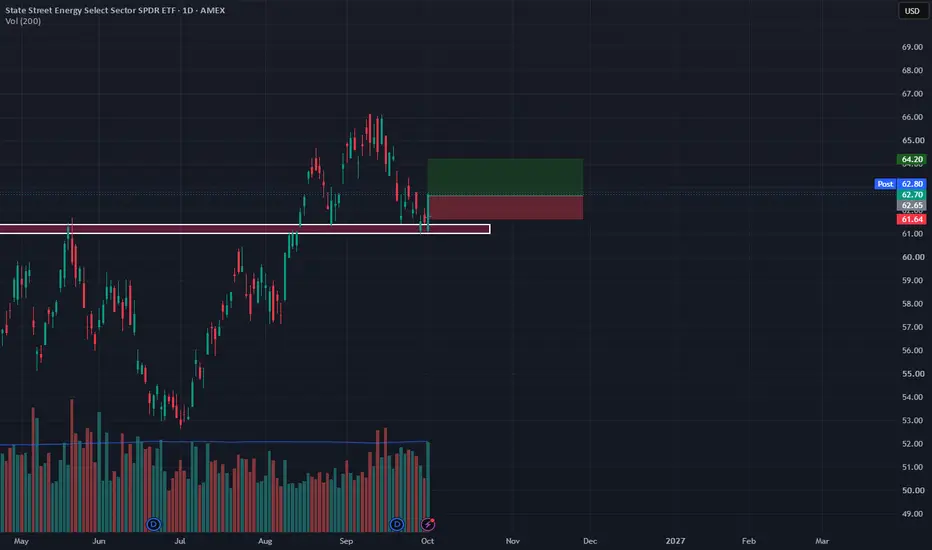
XLE LONG Long position currently active on the Daily timeframe.
The trade is based on bullish market structure and continuation of upward momentum. Position is already in the market and being managed according to the planned levels.
📊 Timeframe: 1D
🟢 Bias: Bullish
🎯 TP & 🛑 SL: Set
#XLE #Energy #Trading #TradingView #LongTrade #PriceAction #TechnicalAnalysis
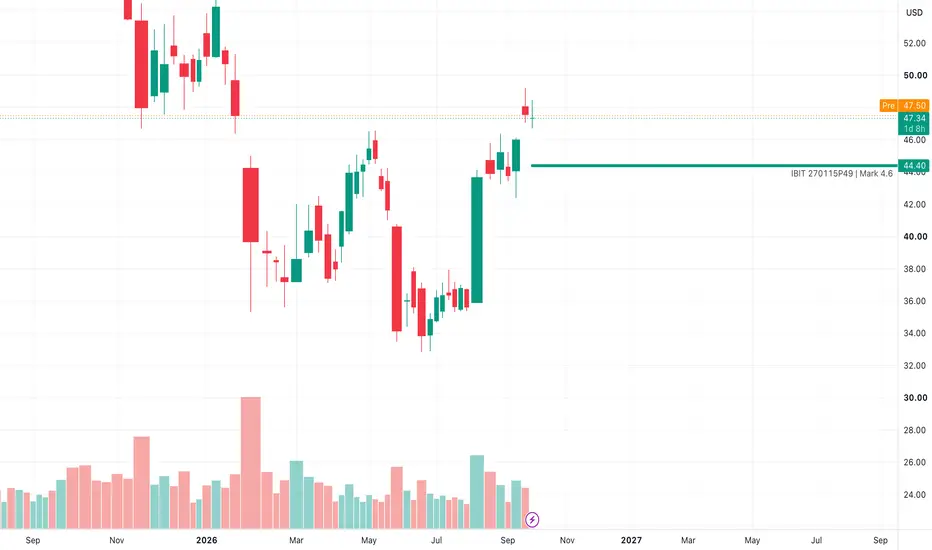
ZCSH Still Bullish: Triangle Target $4,500 ZECLooking at the ZCASH ETF there's a substantial amount of supply coming in. To me this looks like deleveraging in the futures and profit taking in play, not distribution.
Another observation is the ascending triangle. It's a bullish pattern and it hasn't played out yet, so rather than entering distribution ZCASH still remains bullish.
To measure the ascending triangle target, take the measure line at the back of the triangle and apply it to the top of the triangle. On the log chart this comes o
XAR | 26' Q2 - May | Day ChartState Street SPDR S&P Aerospace & Defense ETF
Dividend yield (indicated)
0.32%
--------------------------
Multiple Time-Frame Analysis; Color Code | Strength favors the higher timeframe.
Yearly timeframe = black
Monthly timeframe = pink
weekly = grey
daily = red
4hr = orange
1hr = yellow
15min = blue
5min = green if they are shown. (Level visibility on intervals is set to timeframe the level was found on and below to keep chart view organized.)
** T.A explained **
A Range = two or more cons
ahhhh ! - dollar strong,ahhhh ! - dollar strong, USA Exporting more and more- the dollar is solid... the USA markets are the most liquid in the world - what is there to think about it? ?????? and the USA has a rrr of 10 , while china is massively levered with a rrr of barely 7.5 - I don't see the hesitation that your post implies.....
The USA - massive commodity reserves
The USA - Energy Exporter - now the largest in the world
The USA - massive agro production feeding the world
The USA - Zero beurocracy comared to
TLT Downside Targets & Implied 10Y Yield Read-ThroughsTLT Downside Targets & Implied 10Y Yield Read-Throughs
TLT Target 1: 63.5 | Implied 10Y Yield: 5.60% – 6.10%
TLT Target 2: 55.5 | Implied 10Y Yield: 6.30% – 7.00%
Macro Takeaways
Duration Math: A move to TLT 63.5 (~26% drawdown) requires a +160–190 bps surge in long-end yields. Assuming a 0.75–0.90 10Y/30Y beta, the US 10-year yield lands at 5.60%–6.10%.
Extreme Downside Scenario: A drop to TLT 55.5 (~35% drawdown) implies a +230–280 bps move at the long end, pushing the 10-year yield into t
TLT: the yearly target at 77.89 gave way on a closeTLT has been below its yearly pivot at 87.40 since July, so the yearly bias is down. On September 29 it reached the yearly target at 77.89, the level where a short-side process takes profits, and on September 30 it closed below it. A daily close beyond a target opens the next level: the October monthly target at 75.07, then the second yearly target at 72.49. For anyone still short, 77.89 is now the line to hold: a daily close back above it would say the move is pausing. Options currently price T