Long
Long
 Short
Short
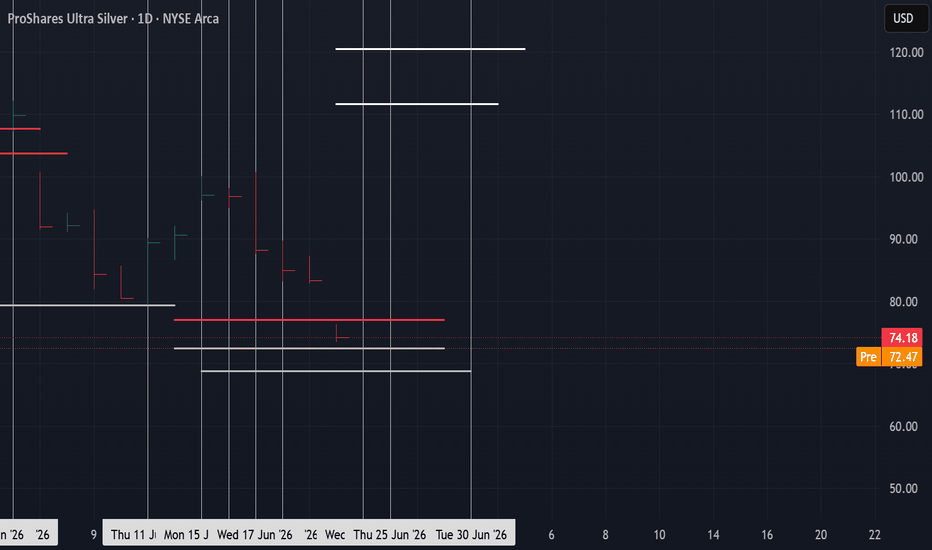
QQQ , IdeaBased in our own TA , we know that QQQ is at a end of cycle! It´s a 12M cycle so this upward movement from past Months soon will result in a correction. It´s not a "if" situation, it´s a "when" .
There a few possible paths, and we´re posting the 2 most probable (for us).
1 - shooting to the stars straight away
2 - a huge fall , and then finalizes the movement
For better understandig of the drawings :
White Lines : end of cycle 12M divided by 3 main targets 686 , 843, 1073
Red Lines : end of cycle 6M divided by 3 main targets 887 , 979, 1097
It can finish any cycle definitely on the values above.
Green / Blue lines : smaller cycles that can give a broader view of the direction
Like , Follow, Boost
Join us !
SPY's Daily Just Flipped Back to LONG. The Hourly...SPY's Daily Just Flipped Back to LONG. The Hourly Didn't Get
the Memo.
Yesterday's post called the resolution of the five-session
cross-timeframe standoff, the Hourly won and the Daily stopped
arguing. One session later the Daily is arguing again. The
thesis flipped from MEDIUM SHORT back to MEDIUM LONG overnight,
the Direction reads Q1 LONG, the Light is GREEN, and the ACE
CQI jumped to 89.9, the highest Daily conviction read on SPY
this cycle. Meanwhile the Hourly is still RED, Q2 neutral,
with the 56-bar bear print at CQI 68.16 holding steady and
EXT MODE still active on the SYNTH Gate. Price dropped another
$10.81 yesterday and is sitting at 736.88 this morning, right
on top of the 736.50-736.87 key support. The Daily looked at
that and decided it was bullish. The Hourly looked at it and
didn't change its mind.
Resistance: 740.44 - nearest overhead
Key resistance: 742.71-743.45 - the cluster above
Current price: 736.88
Support: 736.50-736.87 - the level price is sitting on now
Key support: 732.45 - next shelf below
Thesis line: 721.23 - the broader floor
Two paths from here:
The Daily is right: the CQI 89.9 read and the PARTIAL signal
mark this as a capitulation low, Vol Elev enters on a bounce,
price reclaims 740.44 and pushes toward 742. The Hourly's bear
print finally gets overridden.
The Hourly is right: the EXT MODE flag and the undecayed bear
print hold, 736.50 fails, price drops to 732.45. The Daily's
LONG flip was premature, the same way its SHORT flip yesterday
turned out to be a single-session read rather than a trend
change.
The Daily has now flipped thesis direction twice in two sessions.
MEDIUM SHORT yesterday, MEDIUM LONG today. That kind of
oscillation usually means the Daily is reacting to price rather
than leading it. The Hourly's bear print has been steady for
56 bars through all of it. Stability of conviction versus
reactivity of conviction is the real comparison this morning.
---
Built with SYNTHESIS v3.3 | SOM / ACE / IMP / SYNTHESIS
Study, not financial advice. Research 24.06.2026🌏 Markets:
AMEX:SPY +3.05 +0.42%(pre/m)
NASDAQ:QQQ +4.82 +0.68%(pre/m)
🆕 Economic News:
08:30 USA – The United States current account deficit
10:00 USA – New Home Sales
10:30 USA – EIA Crude Oil / Gasoline Stocks Change
16:00 USA – Fed Bank Stress Test Results
📈 Gap Ups
Reaction to earnings/guidance:
NASDAQ:ICLR NYSE:KBH
Other news:
NASDAQ:PLSM Announces Strategic Partnership with Ouma Health to Expand Access to Remote Prenatal Care Across the United States
NASDAQ:BLZE announced a $335 million, five-year storage deal with CoreWeave.
White House executive order to ramp up U.S. quantum technology development. (secon day) NASDAQ:QNT
NASDAQ:TTWO : Rockstar Games Announces Pre-Orders for Grand Theft Auto VI
NASDAQ:MU Rises Premarket Ahead Of Q3 Report (which will be today on markets close)/ NASDAQ:SNDK
Trump highlighted NYSE:NOK $30 million investment to expand semiconductor testing.
NASDAQ:QCOM Explores Custom Chip Partnership With ByteDance as It Expands Beyond Smartphones
EU set to clear NASDAQ:PSKY $111bn takeover of NASDAQ:WBD
📉 Gap Downs
Reaction to earnings/guidance:
NASDAQ:CBRS NYSE:FDX NASDAQ:PAYX VANTAGE:NG
Other news:
Fairmount Funds Management LLC, Director of Spyre Therapeutics sold $399.7M of
NASDAQ:SYRE
NYSE:BABA sues Pentagon over blacklist designation
‼️ Additional
NASDAQ:GOOGL shares will replace NYSE:VZ shares in the Dow Jones index at Friday’s market close on June 26.
HONEYWELL NASDAQ:HON BOARD OF DIRECTORS APPROVES SPIN-OFF OF HONEYWELL AEROSPACE $HONA
-- Spin-off distribution is expected to occur on June 29, 2026
-- Honeywell Aerospace will be a leading global tier-1 aerospace and defense supplier of mission critical systems and technologies
-- Honeywell Technologies will be a global leader of the industrial world's transition from automation to autonomy
-- $HONA WILL BE ADDED TO S&P100 AND S&P500 indexes and replace NASDAQ:HON and NYSE:CAG respectively
Wintermute, one of the world’s largest crypto market makers: BTC could fall to $59,000 amid the seasonal summer liquidity slump.
The US dollar continues to strengthen against G10 currencies, with the DXY index rising to a one-year high.
Due to the decline in NASDAQ:SPCX and NASDAQ:TSLA shares, Musk has lost his trillionaire status and is once again just a regular billionaire.
Trump accused companies of being slow to lower gasoline prices and ordered an investigation.
🔁 Business Combination / SPAC Deal
NASDAQ:CCXI – Churchill Capital XI / Agility Robotics
Agility Robotics, a humanoid robotics company, signed a merger agreement with Churchill Capital XI to go public through a SPAC business combination. The deal values Agility at a $2.5B pre-money equity value and includes a $200M PIPE at $10 per share. Core thesis is commercial humanoid robots for logistics, warehouses and industrial automation.
Pre-Money Equity Value: $2.5B
PIPE Financing: $200M at $10/share
Closing Conditions: shareholder approvals, regulatory clearances, Nasdaq listing and minimum cash requirement
Key points:
Agility holders signed voting support agreements
Sponsor agreed to lock votes and avoid redemptions
180-day lock-up for certain new holders
M. Klein & Company will advise the company for 2 years post-close
Comparable public companies: NASDAQ:SYM , NASDAQ:RR , NASDAQ:SERV , NASDAQ:TER , NYSE:ROK , NSE:ABB
📋 List of tickers involved:
NASDAQ:ICLR NYSE:KBH NASDAQ:PLSM NASDAQ:BLZE NASDAQ:QNT NASDAQ:TTWO NASDAQ:MU NASDAQ:SNDK NYSE:NOK NASDAQ:QCOM NASDAQ:PSKY NASDAQ:WBD NASDAQ:CBRS NYSE:FDX NASDAQ:PAYX VANTAGE:NG NASDAQ:SYRE NYSE:BABA NASDAQ:GOOGL NYSE:VZ NASDAQ:SPCX NASDAQ:TSLA NASDAQ:CCXI NASDAQ:SYM NASDAQ:RR NASDAQ:SERV NASDAQ:TER NYSE:ROK NSE:ABB NASDAQ:HON $HONA
Best regards – hi2morrow team.
 Long
Long
 Long
Long
 Long
Long
Short
 Long
Long
 Short
Short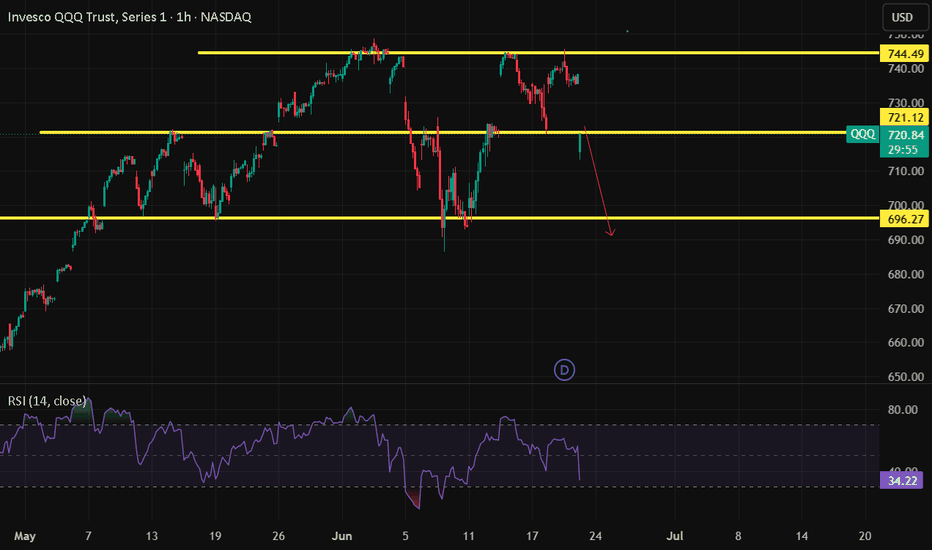
 Long
Long
Short 
Short 
Short 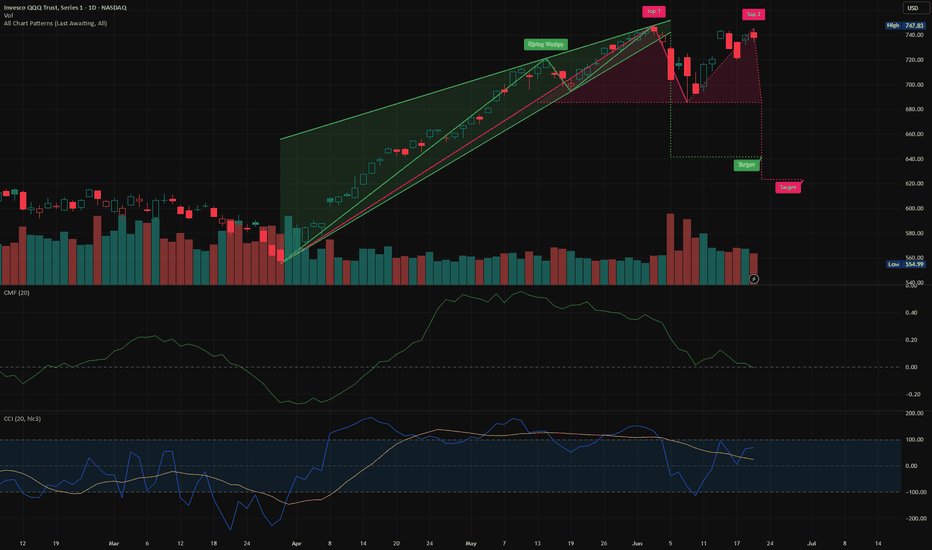
 Short
Short
Research 23.06.2026🌏 Markets:
AMEX:SPY −8.31 −1.12%(pre/m)
NASDAQ:QQQ −17.85 −2.42%(pre/m)
🆕 Economic News:
South Korea’s KOSPI index fell 10% amid a selloff in the world’s leading memory chipmakers, Samsung and SK Hynix, forcing trading to be halted for 20 minutes. The US chip sector is falling in sympathy with Korea.
08:30 USA – ADP Employment Change Weekly
16:30 USA – API Crude Oil Stock Change
📈 Gap Ups
Reaction to earnings/guidance:
Other news:
Trump signs orders calling for powerful quantum computer, targeting 2028 NYSE:INFQ NYSE:IBM
NYSE:IBM and OpenAI partner to bring frontier AI to enterprise cyber defense / NYSE:ACN rises in sympathy to IBM
South African court grants NYSE:NVO petition to block Ozempic copies
NYSE:CVX Signs 20-Year Power Deal With NASDAQ:MSFT for Massive Texas AI Hub
📉 Gap Downs
Reaction to earnings/guidance:
NYSE:SUNB NYSE:CCL
Other news:
Global chip stocks tumbled on Tuesday as a broad selloff in technology shares swept from Asia through Europe and threatened to drag Wall Street lower at the open, fuelled by mounting concerns over stretched AI valuations and the prospect of higher U.S. borrowing costs.
-- In South Korea, memory chip giants Samsung Electronics and SK Hynix, which together account for roughly half of the benchmark Kospi index's market capitalisation, both fell more than 12%. The losses were severe enough to trigger a 20-minute trading halt on the Kospi, the fourth such suspension this year, leaving the index down 10% on the day.
-- The biggest losers from this news were: NYSE:WOLF NASDAQ:TSEM NYSE:STM NASDAQ:MXL NASDAQ:SNDK NASDAQ:MRVL NASDAQ:MU NASDAQ:AXTI NASDAQ:NBIS NASDAQ:ASML NASDAQ:WDC NASDAQ:AMAT NASDAQ:INTC NASDAQ:ARM NASDAQ:STX NASDAQ:ALAB NYSE:COHR NASDAQ:LRCX NASDAQ:AMD NASDAQ:LITE NASDAQ:KLAC NASDAQ:QCOM NYSE:GLW NYSE:VRT NYSE:DELL NYSE:TSM NASDAQ:AVGO
NYSE:PRIM Slashes Outlook; Operating Chief to Depart / KeyBanc downgraded the PRIM stock to "Sector Weight" from "Overweight" and currently has no price target.
‼️ Additional
BofA expects 3 Fed rate hikes this year: in September, October, and December.
Deutsche expects 2 hikes: in September and December.
📋 List of tickers involved:
NYSE:INFQ NYSE:IBM NYSE:ACN NYSE:NVO NYSE:CVX NASDAQ:MSFT NYSE:SUNB NYSE:CCL NYSE:WOLF NASDAQ:TSEM NYSE:STM NASDAQ:MXL NASDAQ:SNDK NASDAQ:MRVL NASDAQ:MU NASDAQ:AXTI NASDAQ:NBIS NASDAQ:ASML NASDAQ:WDC NASDAQ:AMAT NASDAQ:INTC NASDAQ:ARM NASDAQ:STX NASDAQ:ALAB NYSE:COHR NASDAQ:LRCX NASDAQ:AMD NASDAQ:LITE NASDAQ:KLAC NASDAQ:QCOM NYSE:GLW NYSE:VRT NYSE:DELL NYSE:TSM NASDAQ:AVGO NYSE:PRIM
Best regards – hi2morrow team.
SPY's Five-Session Standoff Is Over. The Hourly Won...SPY's Five-Session Standoff Is Over. The Hourly Won and the Daily
Just Stopped Arguing.
The cross-timeframe disagreement that defined SPY for the last
week has finally resolved. The Hourly's bear announcement at CQI
68.03 is now 40 bars old, still carrying virtually the same
conviction it had when it fired on June 18. The Daily's 215-bar
bull print at CQI 69.86 is still technically alive, but the
Daily itself has flipped to MEDIUM SHORT thesis with PANIC active,
a PARTIAL signal loaded, NR7 anti-signal firing, and the Short
Score at 1/3. The bull announcement is still there. The Daily has
stopped listening to it. That's the resolution.
Resistance: 736.50-736.87 - nearest overhead
Key resistance: 740.44-742.71 - last week's floor
Current price: 734.77
Support: 732.45 - nearest level below
Key support: 727.0-728.0 - next structural shelf
Thesis line: 721.23 - the broader floor
Two paths from here:
The bearish resolution accelerates: Vol Elev climbs from 34th
on the Hourly on a move lower, the Daily's PARTIAL signal
upgrades, price breaks 732.45. Opens 727-728 and eventually
721.23, the level that's anchored the bottom of every cheat
sheet this cycle.
The resolution was premature: price reclaims 736.50 with volume,
the Daily's bull print reasserts relevance, the PANIC state
clears. Price pushes back into the 740-742 zone. But this would
require the Daily to reverse a MEDIUM SHORT thesis call, a
PARTIAL signal, and an active PANIC state, which is a lot to
unwind.
The Hourly's EXT MODE is active for the first time on SPY this
cycle. That's the same flag that's been running on BTC for over
a week now. Whether SPY follows the same pattern - extended
downside that grinds rather than snaps - carries into the rest
of the week.
---
Built with SYNTHESIS v3.3 | SOM / ACE / IMP / SYNTHESIS
Study, not financial advice. Short 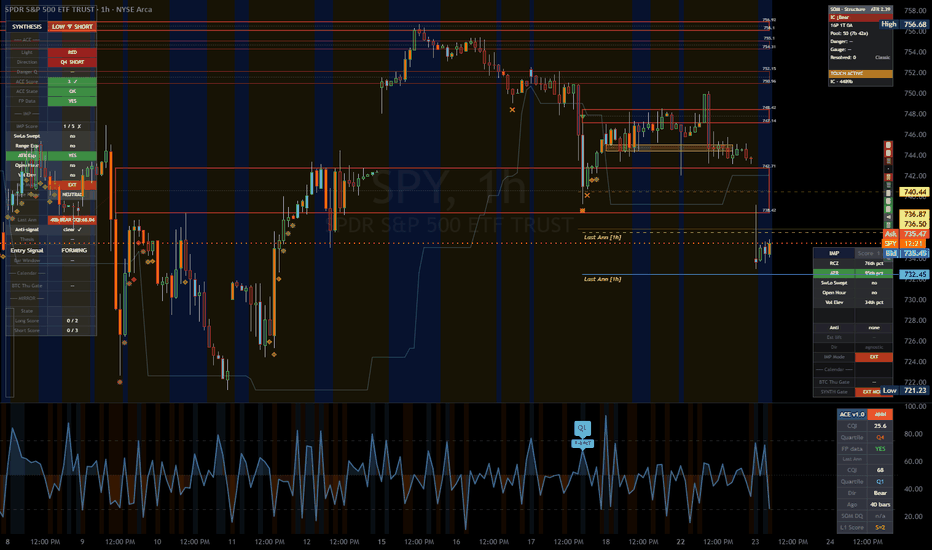
The 4th of July Euphoria Blow-Off Top Before the 'Minsky Moment'As seen in the chart, the SPDR S&P 500 ETF Trust (SPY) is hovering around the $744 level, closely contesting the 1.618 Fibonacci extension ($740.91) within a major multi-year ascending channel. This analysis charts out a classic speculative bubble anatomy—tracking a final parabolic blow-off top over the summer, followed by a systemic "Minsky Moment" in September 2026.
The Technical Framework
Current Position: Consolidating just above the 1.618 Fibonacci extension ($740.91) along an accelerating parabolic trajectory.
The Ultimate Target: A final vertical thrust aiming for the 2.618 Fibonacci extension at $810.60.
The Macro Support: If the parabolic arc breaks, the ultimate macro target sits near the multi-year green support trendline, signaling a potential drop back down toward the low $500s.
The 7-8 Month Catalyst Roadmap
Phase 1: Summer Mania & The $810 Peak (July 2026)
The immediate outlook points to a sharp vertical melt-up driven by sheer momentum and psychological triggers:
4th July Euphoria: America’s 250th anniversary acts as a massive cultural tailwind for a patriotic market rally.
AI Paradigm Shift: Speculation reaches a fever pitch with headlines of the US Government actively buying stakes in AI companies.
The Sentiment Trap: Mainstream narratives shift to a "permanently high plateau," masking what is fundamentally a state of "irrational exuberance."
Phase 2: The Fed Shock & The Bull Trap (Late Summer / Autumn 2026)
Once the market hits the structural ceiling at the $810 Fibonacci level, the macro environment aggressively shifts:
Rate Hikes: Persistent high inflation forces the newly appointed Federal Reserve Chair, Kevin Warsh, to aggressively raise interest rates.
The Dead Cat Bounce: The initial drop triggers a fierce psychological reflex. Retail and institutional dip-buyers rush in under the classic delusion: "This time is different, buy the f*ing d!p."
Phase 3: The Minsky Moment & Geopolitical Liquidation (Winter 2026 – Early 2027)
The structural fragility of the market is exposed as multiple global black swan events cascade at once, leading to a systemic unwinding:
Geopolitical Flares: Israel violates its ceasefire, and the Strait of Hormuz is closed once again, triggering a massive global energy supply shock.
De-Dollarization & Fractured Diplomacy: President Xi cancels his highly anticipated US visit, coinciding with the launch of a new BRICS payment system explicitly engineered to bypass the USD and SWIFT.
Sovereign Debt Crisis: A boiling domestic and international currency crisis triggers a true liquidity crunch.
Phase 4: The Christmas Illusion to Final Capitulation
The Fake-Out: A brief relief rally tempts trapped bulls to declare that a "healthy correction is over," calling for a "New ATH by Christmas."
The Final Blow: This end-of-year trap fails brutally. Entering early 2027, headlines of an Iranian nuclear test shatter remaining global market stability, sending the SPY into a vertical capitulation through its long-term green baseline support.
Key Levels to Track
Immediate Resistance / Target: $810.60 (2.618 Fib Extension)
Key Pivot Point: $740.91 (1.618 Fib Extension)
Macro Capitulation Target: ~$520 - $540 (Green support trendline retest)
Traders Note: Parabolic moves offer the most explosive gains, but they build the weakest structural foundations. Enjoy the summer blow-off, but keep your trailing stops tight and an eye firmly on the exit as we head into late Q3.
Disclaimer: This is a speculative macro roadmap blending technical market structures with hypothetical socio-political catalysts for educational purposes. Always manage your own risk. QQQ / NDX Weekly Outlook – Week 25 of 2026 (22-26 JUN)QQQ/NDX WEEKLY MARKET OUTLOOK
Last Week's Recap
Price found a small bounce from KEY Level 1, but because it happened on Wednesday morning ahead of the FOMC meeting, we decided not to take the trade.
As discussed throughout the week, the FOMC meeting was the key event. With significant uncertainty surrounding the outcome, our expectation was that markets would likely find direction and potentially begin a meaningful move after the announcement.
Following the FOMC conference, QQQ found a nearly perfect bounce just below the KEY Level 1 zone and delivered exactly the reaction we were looking for.
Following the plan, we took profits around 735 and 742, closing the trade with a solid gain.
1 trade 1 win.
(For reference, I have included last week's outlook on the right.)
UA CAPITAL LAST WEEK RECAP (WEEK OF JUNE 15–19)
Markets closed the previous week with strong bullish momentum. On June 14, both I and the Premium Group had already established swing long positions in semiconductor names as well as SPY and QQQ.
When markets opened on Monday, that upside momentum continued. Our swing positions and stock positions performed extremely well, especially names such as ARM, MU, SNDK, and MRVL, which generated significant gains.
The key levels outlined in the Weekly Market Outlook were not reached on Monday or Tuesday. Price only approached those zones late Tuesday afternoon. However, with Wednesday's FOMC meeting and Kevin Warsh's first conference approaching, we informed the Premium Desk that opening new positions before the event would involve unnecessary risk. Instead, we focused on preparation and risk management ahead of the announcement.
Following the FOMC conference on Wednesday, SPY delivered a precise reaction from 737.5 while QQQ bounced directly inside the KEY Level 1 zone and immediately resumed higher. Seeing these weekly scenarios play out so precisely after such a major macro event is always encouraging.
The Long Scenario 2 setups published in Tuesday's Updated Forecast were fully achieved, as those scenarios were simply updated versions of the original Weekly Market Outlook.
On Thursday, the UA CAPITAL Trading Desk shared additional daily scenarios and intraday strategies with Premium members. While the SPY setup struggled due to relative weakness, QQQ performed almost exactly as expected, allowing us to capture additional profitable scalp opportunities.
Throughout the week we also continued highlighting bullish continuation opportunities in memory-related names such as MU and SNDK. By Friday premarket, MU was up more than 11% and SNDK more than 11.5%, creating several excellent trading opportunities for the group.
This Week's Scenarios / Prediction
Risk Index
The Risk Index remains firmly in a risk-on environment. As long as markets do not face a meaningful negative catalyst or macro surprise, institutional positioning continues to favor the bullish side.
This oscillator reads macro conditions and converts them into a technical risk framework. It was developed internally at UA CAPITAL and remains the primary indicator I use for both short term and long term positioning decisions.
The Risk Index currently signals the potential for bullish continuation. If geopolitical headlines remain stable and no new negative catalysts emerge, the model suggests that new all time highs remain achievable.
For that reason, we will continue focusing exclusively on swing long opportunities from predefined key levels.
Long Scenarios
Long Scenario 1
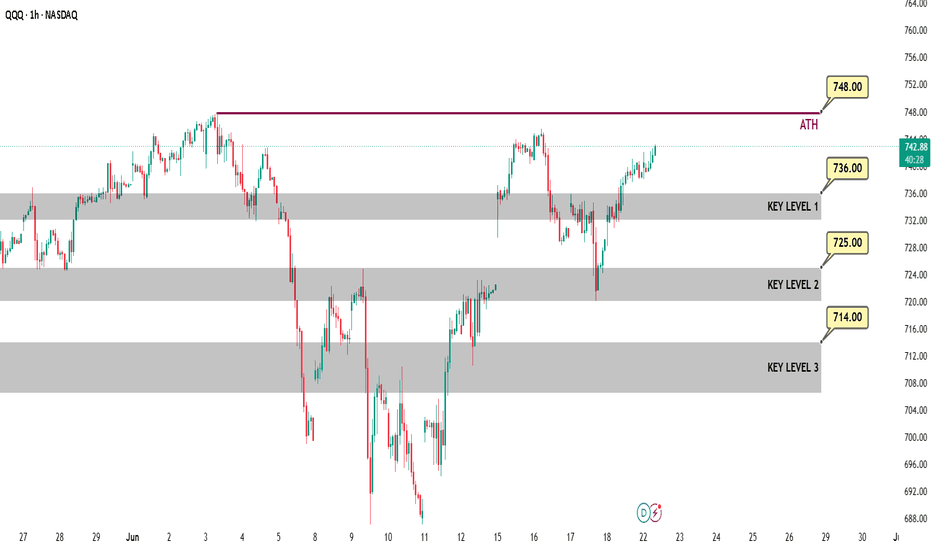
KEY Level 1 (736)
This is the first major demand zone. If price reaches this level and confirms support, call options can be used to establish long exposure.
Targets: 740 → 744 → 748
Runner can be held.
Invalidation: Daily candle close below 732.
Long Scenario 2
KEY Level 2 (725)
This is the second major demand zone. If price reaches this level and confirms support, call options can be used to establish long exposure.
Targets: 729.5 → 732 → 736
Invalidation: Daily candle close below 720.
Long Scenario 3
KEY Level 3 (714)
This is the third major demand zone. If price reaches this level and confirms support, call options can be used to establish long exposure.
Targets: 720 → 729.5 → 732 → 736
Invalidation: Daily candle close below 706.5.
IMPORTANT TIP
QQQ continues to show stronger relative strength than SPY. Because of this, long positions generally offer better reward potential through QQQ, while SPY remains the more attractive vehicle for short exposure.
In previous posts, I explained how to use the CC Model (Correlated Confluence Model) for trade execution and partial profit taking. Reviewing those posts may be particularly useful this week.
Position Management Rules
1. Entry model: One hourly bullish candle close above the level.
2. Take profits in stages because market reversals can happen quickly.
3. After the first profit target is reached, move all remaining stop losses to breakeven and convert the position into a risk-free trade.
4. A reaction from the level must be confirmed. We do not predict price. We react to price.
5. Daily candle close below the bounce zone = stop loss.
Notice: My previous SPY, QQQ and individual stock content since 2025 is no longer visible following a TradingView content review. This included my regular weekly outlooks and mid week market updates. I have been consistently publishing structured index and equity market analysis, and I will now rebuild this track record with weekly/daily posts going forward.
This analysis is for educational purposes only and reflects my personal opinion. It is not financial advice. Long