Education
Samsung Electronics vs $SMH (VanEck Semiconductor ETF) part 2
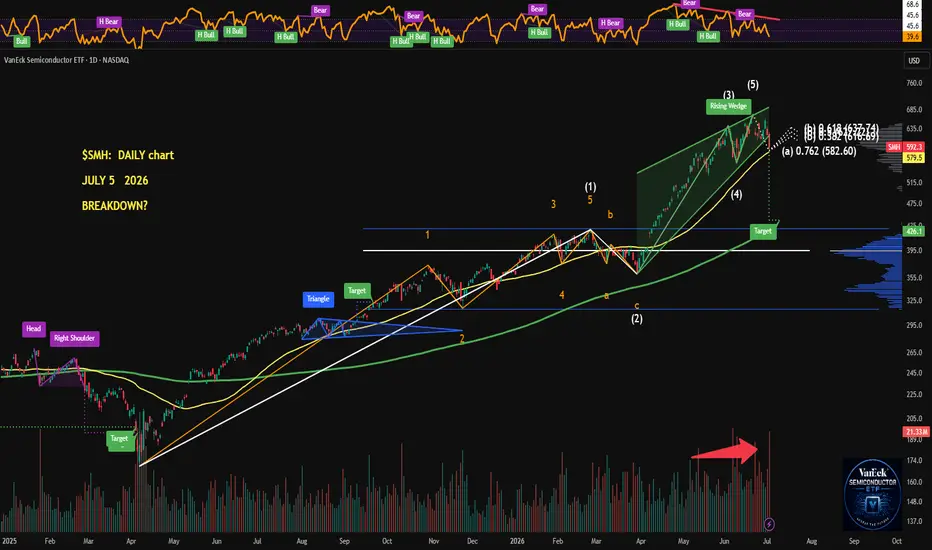
Samsung Electronics vs NASDAQ:SMH (VanEck Semiconductor ETF) - time for a bigger correction?
Samsung accounts for roughly 9% of AMEX:EEM , one of my main long-term portfolio positions, so I follow it closely. Unfortunately, the chart isn't looking great right now. After a roughly 600% rally over the past year and a series of record quarterly results, the daily chart looks quite close to confirming a larger correction.
On the weekly chart, every new high over the past few months has come with a bearish RSI divergence. The daily chart tells a similar story and is starting to resemble a distribution phase. There's a breakdown from a Rising Wedge, a failed attempt to reclaim the pattern, price has slipped below the yellow 50 SMA, and we've now printed the first lower low - at least if we count the wicks.
The key question now is whether price can make a higher high. If not, there's a good chance we're seeing a dead cat bounce before another leg lower. The green 200 MA is still bullish but sits much lower around 176K, while the measured breakdown target from the wedge comes in near 207K.
Samsung reports earnings in a few weeks. The last several quarters have all delivered record results and earnings beats, yet the chart is telling a different story. We'll see how the earnings and, more importantly, the guidance look. Will expectations be raised once again?
The same pattern is visible in NASDAQ:SMH (VanEck Semiconductor ETF). It has also broken down from a very similar Rising Wedge, accompanied by bearish RSI divergences. The main support is now the yellow 50 MA around $579.5.
In SMH's case, the distribution thesis is reinforced by the Elliott Wave structure and heavy selling volume.
So the chart of the Korean semiconductor giant looks remarkably similar to the chart of the leading U.S. semiconductor ETF. Add a strengthening TVC:DXY on top of that, and it's hard not to argue that the entire semiconductor sector may be entering a global distribution phase.
If we're indeed moving into a correction, it will probably last as long as the U.S. dollar remains strong. Naturally, Samsung is likely to feel that pressure even more than most U.S. semiconductor companies.
For now, it looks like better buying opportunities may appear over the coming months, in my opinion.
💙👽  Short
Short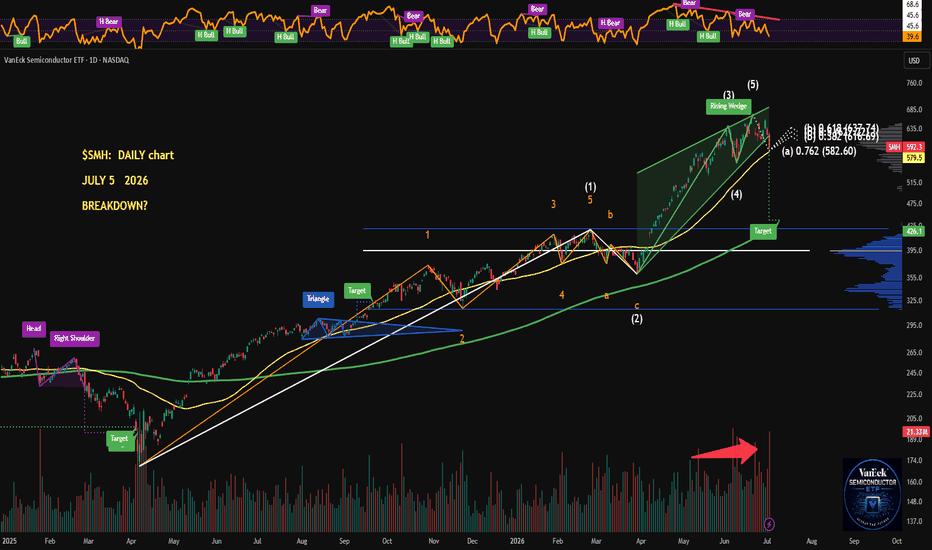
Weekly Bias — 6 July3 important things are converging
20d EMA (~$721)
50d EMA (~$709–$710)
Multiple AVWAPs from swing lows (~$710–$713)
Markets often react strongly when multiple independent support measures align
AVWAPs from swing lows represent the average cost basis of buyers from important lows
The fact that NASDAQ:QQQ is still above or sitting on these AVWAPs suggests buyers from those pivots are still profitable
If those AVWAPs begin to fail one after another, the probability of a larger correction rises quickly
AVWAP from the ATH Is particularly interesting given price is below it, meaning everyone who bought around the ATH is underwater
This AVWAP often becomes dynamic resistance until reclaimed, so expect repeated selling around $728–$735 before a true breakout
When several indicators point to the same area, the level tends to matter much more than any single trendline
If buyers can defend $709–$713 & reclaim the 20d EMA (~$721), it's likely this is a consolidation within a broader uptrend
If confluence fails on expanding volume, the odds shift toward a deeper retracement into the $690–$675 area before the next durable base forms
The loss of the 20d EMA on the NASDAQ:QQQ shifts the short-term trend bearish, but the intermediate trend remains bullish while above the 50d EMA
A move back above $718–$720 would improve the short-term outlook
~$748 remains the major breakout level
The rising 50d EMA (~$700) creates a strong confluence support area
The June swing low area (~$685) is roughly where we should expect stronger institutional buying if $700 fails
AMEX:SPY continues to show relative strength
The pivot (~$742) & the 20d EMA almost overlap
Above $742–$744 favors buyers
Below it, the path opens toward $724
AMEX:SPY is still in a healthier technical position than NASDAQ:QQQ
AMEX:IWM remains the strongest structurally
The current pullback has only brought price back toward the 20d EMA
Typical of a healthy trend rather than a trend reversal
All 3 ETFs would be trading below their 20d EMAs & threatening their 50d EMAs if this were a broader correction; instead, NASDAQ:QQQ is the weakest, while AMEX:SPY & AMEX:IWM are holding up relatively well so still looks more like sector-specific pressure (especially in large-cap tech) than broad market liquidation
Bullish (≈55%)
Reclaim $718–$721 (20d EMA)
Hold above that on a daily closing basis
Challenge $735, then ATHs
Would indicate the recent pullback was a successful retest
Neutral (≈30%)
NASDAQ:QQQ oscillates between $700–$721
This would allow the 20d EMA to flatten & the 50d EMA to continue rising, resolving the overextension through time rather than price
Bearish (≈15%)
A decisive close below $702–$700 (50d EMA) would be the first meaningful break of intermediate support
Would make $685 the next high-probability downside objective
Avoid chasing downside here; rather, wait for 1 of 2 higher-probability setups
A reclaim & close back above $718–$721, which would suggest buyers have regained control & increase the odds of a move back toward $735–$748
A decisive daily close below $700, ideally accompanied by expanding volume, which would strengthen the case for a move toward $685
Right now, NASDAQ:QQQ is trading in the middle of an important support cluster rather than in open space — historically, that tends to produce more choppy, 2-sided trading until one side wins control
The most important level remains $712–$721
NASDAQ:QQQ finished almost exactly in highest volume node, 20d EMA neighborhood, prior breakout area, 82.6% retracement & just above the 50d EMA (~$702)
This is an exceptionally strong area of confluence
It still looks more like a backtest
CBOE:COR1M near these depressed levels means the market is not pricing a broad, systemic risk event
Stocks are behaving independently rather than all moving together in panic
Historically, this environment is more consistent with consolidation or rotation than the early stages of a major bear leg
CBOE:DSPX is still climbing
Indicates investors continue paying for upside participation
If traders truly expected a sharp correction, you'd usually see CBOE:DSPX weaken materially while downside protection demand accelerated
The obvious buy-side liquidity remains
NASDAQ:QQQ $748.65
AMEX:SPY $760.40
AMEX:IWM $302.70
Sell-side liquidity sits around
NASDAQ:QQQ $703 → $686
AMEX:SPY $732 → $723
AMEX:IWM $286 → $278
The market is trapped between those pools
All 3 ETFs are primary bullish in an intermediate range correction
Higher highs → higher lows
The sequence I would expect is NASDAQ:QQQ holds $710–$715 → reclaims $721 → recovers $730 → $740 → retest ATH around ~$750
If NASDAQ:QQQ closes below $702 (50d EMA) → expect $700 → $694 → $686 → $675
Would represent a true market structure shift rather than a simple pullback
The first hour on Monday should tell us a lot
55–60% sideways consolidation between $710 & $725 as momentum resets
25–30% bullish breakout toward $740–$749 after buyers reclaim the 20d EMA
15–20% bearish breakdown below the 50d EMA, targeting $694–$686
The key takeaway is that price has weakened more than the internals have
Yields are falling, the TVC:VIX remains contained, breadth is still healthy enough & the correction has brought NASDAQ:QQQ back into a dense area of accepted value
Until the market loses the $702–$710 support cluster on a closing basis with expanding volume, the larger uptrend remains intact
The leadership beneath the index is becoming much more bifurcated, but the weight of the evidence still favors buying weakness once momentum stabilizes, but not chasing strength until leadership broadens
1. Sector Rotation
AMEX:XLF (Financials)
AMEX:XLV (Healthcare)
AMEX:XLP (Staples)
AMEX:XLB (Materials)
These sectors are either making fresh highs or holding above the 20d EMA
Money is not leaving equities, it's rotating
AMEX:XLK
Technology is pulling back, expected
NASDAQ:QQQ follows AMEX:XLK
AMEX:XLC
Communications is also weakening
That's mostly NASDAQ:META & NASDAQ:GOOGL pressure
AMEX:XLY
Consumer discretionary rolled over
Largely NASDAQ:TSLA & NASDAQ:AMZN
This is a late-cycle sector rotation — not broad liquidation
2. Leadership
NASDAQ:AAPL
Actually constructive
MACD improving
RSI recovering
Price reclaiming upper retracement
NASDAQ:AAPL may become the next leadership stock
NASDAQ:AMZN
Quietly improving
Higher probability breakout than breakdown
NASDAQ:GOOGL
Probably the strongest chart
RSI rising
MACD crossed
Price almost at highs
Bullish
NASDAQ:MSFT
Still one of the strongest
No concern
Neutral
NASDAQ:META
Pulling back after huge run
Healthy
NASDAQ:AVGO
Still correcting
Needs time
NASDAQ:NVDA
Still below declining averages
RSI weak
MACD negative
No confirmed bullish reversal
Since NASDAQ:NVDA is almost 9% of NASDAQ:QQQ , this matters
NASDAQ:AMD
Very weak
Lower highs
Momentum fading
NASDAQ:MU
Still digesting earnings
Momentum rolling over
NASDAQ:TSLA
Probably the weakest mega cap
Momentum deteriorating
Failed breakout
3. Semis
Semis are still outperforming NASDAQ:QQQ , but the ratio has begun rolling over
Suggests leadership is no longer accelerating
Not bearish
Just less explosive
Historically this usually produces 2–6 weeks of index consolidation
4. Software
Software may begin replacing semis as leadership
Exactly what healthy bull markets do
Leadership rotates
NASDAQ:QQQ rallied roughly 34% without any meaningful correction, so a 5–8% pullback would be entirely normal, even a decline to $680 would still leave the long-term trend intact
Price made a marginally higher high; meanwhile, several leaders made lower RSI highs, weaker MACD & poorer breadth which is a hidden bearish divergence beneath the index
It doesn't necessarily imply a bear market, but it does argue against expecting an immediate V-shaped breakout to new highs
A daily close below $700 would materially weaken the bullish case & would shift the odds toward a test of $694–$686, where multiple technical references converge
Defensive & financial sectors are absorbing capital while several of the biggest growth names digest large gains & that kind of internal rotation often extends the life of a bull trend — the missing ingredient right now is semi leadership so until NASDAQ:NVDA , NASDAQ:AVGO & NASDAQ:AMD begin improving together, it's difficult to expect NASDAQ:QQQ to break decisively above ATHs; however, if software ( CBOE:IGV ) continues strengthening while semis stabilize & NASDAQ:QQQ holds the $702–$715 support cluster, the odds would increasingly favor another advance toward new highs later in July rather than a transition into a deeper correction  Long
Long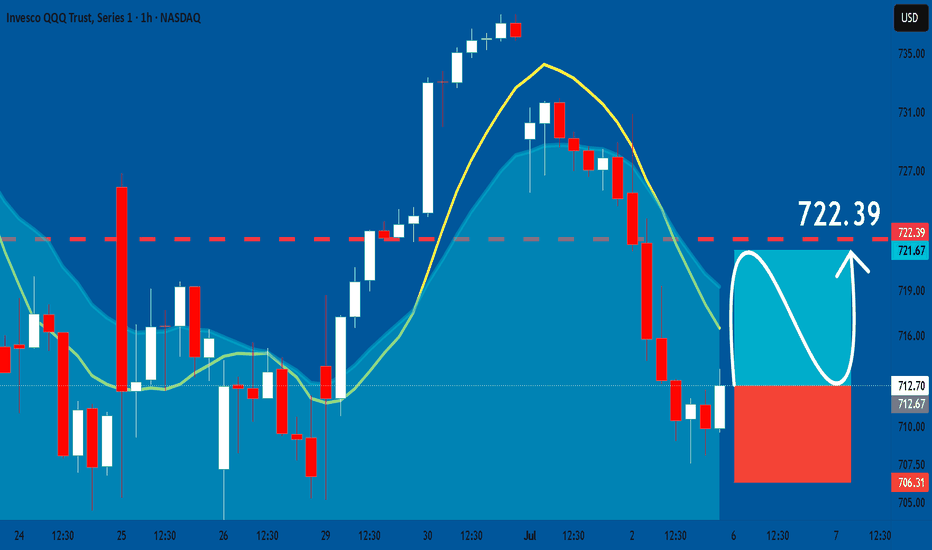
Position #4: $EEM (1-DAY chart update): BEAR RSI divergence etc.Position #4: AMEX:EEM (iShares MSCI Emerging Markets ETF) - Update
A strong U.S. Dollar Index ( TVC:DXY - see my previous posts) continues to put pressure on emerging markets, so it's time to take a closer look. I'm still planning to increase my exposure over time. I currently have only two tranches in the portfolio, while my long-term target is probably four or five.
In the short term, however, I think the strong dollar will keep creating headwinds. It also makes sense to analyze the ETF's largest holdings one by one, since roughly 70% of the portfolio is concentrated in technology, financials and a handful of mega caps such as TSMC, Samsung Electronics, SK hynix, Tencent and Alibaba. Some of these charts already look weak for at least the next quarter.
On the weekly chart, I still view EEM as being in the Mark Up phase, following what looks like an 18-year accumulation range. That process could play out over several years. The current pullback resembles one of Wyckoff's Low Volume Sell Offs, with declining volume during the correction. If that's the case, the larger bullish structure remains intact and a future Buying Climax would still fit the overall cycle.
The weekly chart is also showing a bearish RSI divergence, which aligns well with the recent strength in the U.S. dollar.
The daily chart tells a similar story: another bearish RSI divergence, a clean Elliott Wave structure suggesting the beginning of a corrective phase, a possible dead cat bounce, loss of the 50-day SMA, a breakdown from a Rising Wedge (technical target around $53), and a potential Double Top with a neckline near $64, which is the key level to hold.
There are currently quite a few technical arguments supporting a correction, and the macro backdrop reinforces what the weekly and daily charts are already suggesting.
As for downside targets, I see several possibilities:
Rising Wedge target: $53
Double Top target: $56.6
200-day MA: around $59+
Elliott Wave 0.618 Fibonacci retracement: below $61
For now, I think patience is the better strategy. Let the strong dollar create better valuations across emerging markets. That process could easily take several months and provide much more attractive long-term buying opportunities.
Not financial advice - just my market journal.
💙👽  Short
Short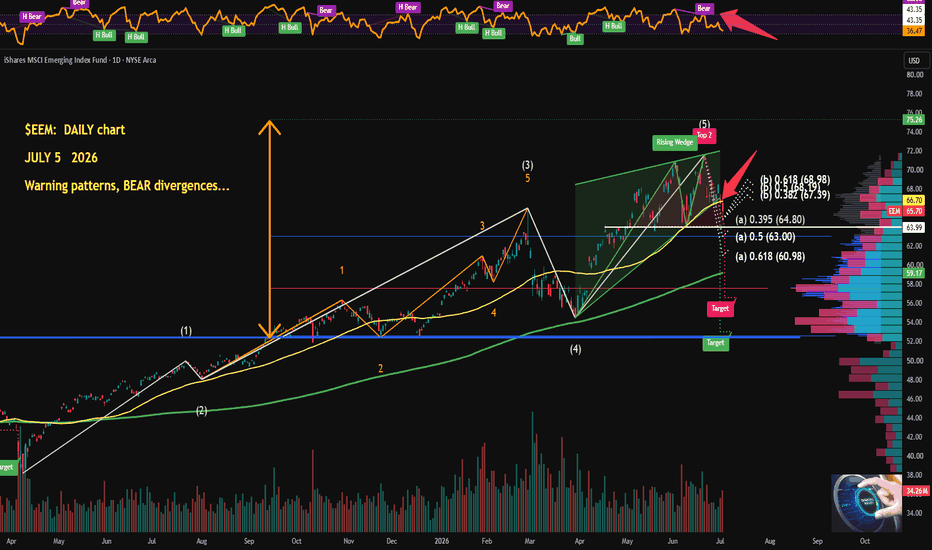
Position #4: $EEM (1-WEEK chart update) - MARK UP phase is ON!Position #4: AMEX:EEM (iShares MSCI Emerging Markets ETF) - Update
A strong U.S. Dollar Index ( TVC:DXY - see my previous posts) continues to put pressure on emerging markets, so it's time to take a closer look. I'm still planning to increase my exposure over time. I currently have only two tranches in the portfolio, while my long-term target is probably four or five.
In the short term, however, I think the strong dollar will keep creating headwinds. It also makes sense to analyze the ETF's largest holdings one by one, since roughly 70% of the portfolio is concentrated in technology, financials and a handful of mega caps such as TSMC, Samsung Electronics, SK hynix, Tencent and Alibaba. Some of these charts already look weak for at least the next quarter.
On the weekly chart, I still view EEM as being in the Mark Up phase, following what looks like an 18-year accumulation range. That process could play out over several years. The current pullback resembles one of Wyckoff's Low Volume Sell Offs, with declining volume during the correction. If that's the case, the larger bullish structure remains intact and a future Buying Climax would still fit the overall cycle.
The weekly chart is also showing a bearish RSI divergence, which aligns well with the recent strength in the U.S. dollar.
The daily chart tells a similar story: another bearish RSI divergence, a clean Elliott Wave structure suggesting the beginning of a corrective phase, a possible dead cat bounce, loss of the 50-day SMA, a breakdown from a Rising Wedge (technical target around $53), and a potential Double Top with a neckline near $64, which is the key level to hold.
There are currently quite a few technical arguments supporting a correction, and the macro backdrop reinforces what the weekly and daily charts are already suggesting.
As for downside targets, I see several possibilities:
Rising Wedge target: $53
Double Top target: $56.6
200-day MA: around $59+
Elliott Wave 0.618 Fibonacci retracement: below $61
For now, I think patience is the better strategy. Let the strong dollar create better valuations across emerging markets. That process could easily take several months and provide much more attractive long-term buying opportunities.
Not financial advice - just my market journal.
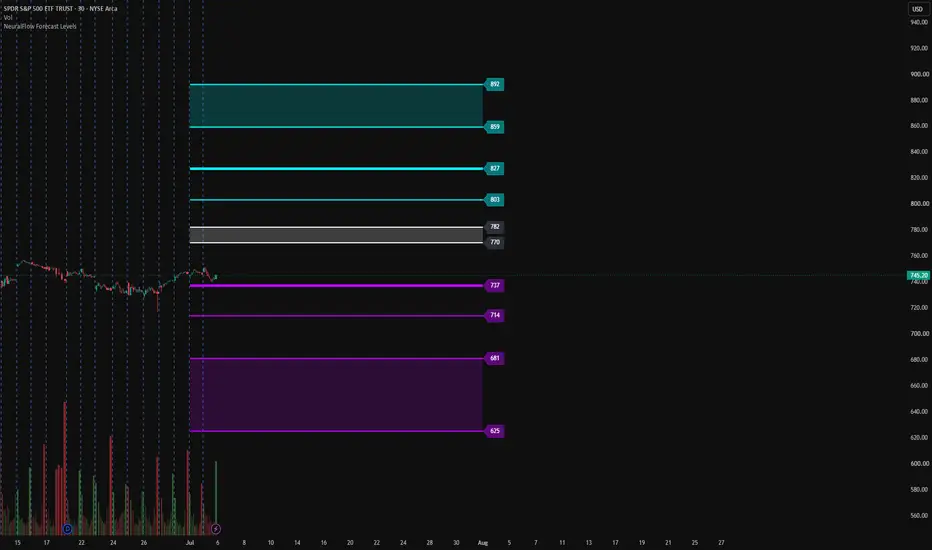
💙👽 SPY July Forecast — Monthly LevelsSPY enters July after a strong Q2 rally, but momentum is no longer one-way. The broader trend is still constructive, while recent price action shows rotation: strength in defensive/value areas, pressure in AI/chips, and a market waiting for the next Fed/earnings trigger.
For July, the key AI reclaim zone is **770–782**.
SPY is not fully bullish below this band. A move back above **770** improves structure, but acceptance above **782** is the real confirmation that buyers are back in control.
Above **782**, upside opens toward **803** first. If momentum expands, the next major rail is **826**.
A clean breakout above **826** would shift July into extension mode, with **859** as the next upper zone.
On the downside, failure to reclaim **770–782** keeps SPY vulnerable to a retest of **737**. Below **737**, the structure weakens further toward **714**, then **681**.
### July Map
**Reclaim zone:** 770–782
**Bullish confirmation:** Above 782
**Upside path:** 803 → 826 → 859
**Key downside:** 737
**Weakness below:** 737 → 714 → 681
### Final Read
SPY’s July trade is simple:
Below **770–782**, rallies can still face supply.
Above **782**, the trend reclaims control and **803–826** becomes the active upside path.
Below **737**, July shifts from pullback to breakdown risk.
QQQ / NDX Weekly Outlook – Week 26 of 2026 (29-03 JUN/JUL)QQQ / NDX WEEKLY MARKET OUTLOOK
Last Week's Recap
None of the long scenarios from last week's Weekly Market Outlook were triggered early in the week. Our first long position was stopped out on Tuesday after the daily invalidation level was confirmed.
In the Mid Week Update, however, we published an updated framework and, as outlined, Short Scenario 1 was triggered perfectly and delivered a strong profitable trade.
Total trades on QQQ:
2 Trades | 1 Win | 1 Loss | Outcome: Decent Profit
(For reference, I have included last week's outlook on the right.)
UA CAPITAL LAST WEEK RECAP (WEEK OF JUNE 22–26)
Week 25 of 2026 marked another deep green week for UA CAPITAL, extending our streak to 12 consecutive profitable weeks. We have now gone the entire year without a single red week.
Markets began the week trading near all time highs with a bullish tone. Since the Risk Index was still signaling a risk on environment, our initial Weekly Market Outlook focused exclusively on long opportunities for both SPY and QQQ.
We also had an important catalyst approaching, with both the MU earnings report and the PCE inflation data scheduled for later in the week. Our MU swing position had already been established two weeks earlier, and in the Weekly Market Outlook we explained that the position would likely be managed and closed around Wednesday or Thursday depending on price action.
For the PCE release, we prepared three separate scenarios covering outcomes above expectations, in line with expectations, and below expectations. Each scenario included a clear execution plan and position management framework shared with the UA CAPITAL Trading Desk.
Our first long position from the Weekly Market Outlook was stopped out on Tuesday. At the same time, the Risk Index shifted aggressively from risk on into a short term bearish regime.
Immediately after that transition, I notified the Trading Desk through our private chat that we had begun positioning for downside exposure across the major indices.
On Wednesday, our Mid Week Update introduced a completely new trading framework. Short Scenario 1 was triggered almost perfectly, allowing us to short both SPY and QQQ through put options with excellent execution.
Despite a positive premarket rally on Wednesday, the Risk Index algorithm had already shifted decisively into a short term bearish bias. Trading Desk members were warned to begin looking for short exposure while becoming significantly more selective with any new long positions.
Once markets opened, Nasdaq futures dropped nearly 3%, where I was already carrying short futures exposure. My SPY put positions were closed after approximately a 6.5 point decline, while my QQQ puts were closed following roughly a 14.5 point move lower.
Together with the UA CAPITAL Trading Desk, we generated profitable trades across both the futures and options markets during the selloff.
Thursday brought another major opportunity as MU reported earnings. The July 24 $100 call options that I purchased for roughly $90 were sold around $266, generating an approximate 195% return. This entire swing trade, from entry through position management and exit, was shared live with the Trading Desk.
Overall, the week demonstrated exactly why adaptability matters. Our initial long exposure early in the week was stopped as planned. Once the Risk Index detected the shift in market structure, we quickly transitioned into short exposure and captured strong profits across futures and options. Combined with the 195% return on the MU swing trade, it was another exceptional week for the Trading Desk.
This Week's Scenarios / Prediction
Risk Index
This oscillator reads macro conditions and converts them into a technical risk framework. It was developed internally at UA CAPITAL and remains the primary indicator I use for both short term and long term positioning decisions.
The Risk Index algorithm is currently signaling a short term bearish bias. As a result, additional downside remains possible over the near term. However, the longer term structure continues to stay firmly risk on, meaning high probability buying opportunities may emerge once price reaches our predefined demand zones.
Our objective this week is to capitalize on short term bearish momentum while remaining ready to shift back into swing longs once technical confirmation appears.
Scenarios / Strategies
Chop Zone
The 725–709 range is currently defined as our primary Chop Zone.
Within this area, I expect price to remain highly indecisive as buyers and sellers fight for control. Because false breakouts and poor risk-to-reward conditions become much more common inside this range, I do not intend to initiate new positions while price remains inside the Chop Zone.
Short Scenario
Trigger: A confirmed breakdown below the Chop Zone with a daily close below 709.
Targets: 698 → 692.5 → 681
Invalidation: Daily close above 725.
Long Scenario 1
KEY Level 1 (692.5) This is the first major demand zone. If price reaches this level and confirms support, call options can be used to establish long exposure.
Trigger: Price must reach the level and produce a bullish candle close back above the zone.
Targets: 703 → 709 → 720
Invalidation: Daily close below 681.
Long Scenario 2
KEY Level 2 (663) This is the second major demand zone. If price reaches this level and confirms support, call options can be used to establish long exposure.
Trigger: Price must reach the level and produce a bullish candle close back above the zone.
Targets: 673 → 681 → 692.5
Invalidation: Daily close below 653.
Position Management Rules
1. Entry model: Aggressive: 1H candle close above or below the designated level. Conservative: Daily candle close above or below the designated level.
2. Take profits in stages because market reversals can happen quickly.
3. After the first profit target is reached, move all remaining stop losses to breakeven and convert the position into a risk-free trade.
4. A reaction from the level must be confirmed. We do not predict price. We react to price.
5. Daily candle close below the designated bounce zone equals stop loss.
Notice: Starting a fresh, high frequency track record for SPY, QQQ, and core equities on TradingView. Moving forward, all institutional research, weekly outlooks, and mid week updates will be tracked consistently right here.
This analysis is for educational purposes only and reflects my personal opinion. It is not financial advice. SPY / SPX Weekly Outlook – Week 26 of 2026 (29-03 JUN/JUL)SPY/SPX WEEKLY MARKET OUTLOOK
Last Week's Recap
None of the scenarios outlined in last week's Weekly Market Outlook were triggered during the first half of the week, so we stayed patient and did not take any trades.
However, in the Mid Week Update, the updated analysis identified **Short Scenario 1**, which was triggered exactly as planned and resulted in a strong profitable trade.
Total trades: 1
Wins: 1
Outcome: Decent profit
(For reference, I have included last week's outlook on the right.)
UA CAPITAL LAST WEEK RECAP (WEEK OF JUNE 22–26)
Week 25 of 2026 marked another deep green week for UA CAPITAL, extending our streak to 12 consecutive profitable weeks . We have now gone the entire year without a single red week.
Markets began the week trading near all time highs with a bullish tone. Since the Risk Index was still signaling a risk on environment, our initial Weekly Market Outlook focused exclusively on long opportunities for both SPY and QQQ.
We also had an important catalyst approaching, with both the MU earnings report and the PCE inflation data scheduled for later in the week. Our MU swing position had already been established two weeks earlier, and in the Weekly Market Outlook we explained that the position would likely be managed and closed around Wednesday or Thursday depending on price action.
For the PCE release, we prepared three separate scenarios covering outcomes above expectations, in line with expectations, and below expectations. Each scenario included a clear execution plan and position management framework shared with the UA CAPITAL Trading Desk.
Our first long position from the Weekly Market Outlook was stopped out on Tuesday. At the same time, the Risk Index shifted aggressively from risk on into a short term bearish regime.
Immediately after that transition, I notified the Trading Desk through the private chat that we had begun positioning for downside exposure across the major indices.
On Wednesday, our Mid Week Update introduced a completely new trading framework Short Scenario 1 was triggered almost perfectly, allowing us to short both SPY and QQQ through put options with excellent execution.
Despite a positive premarket rally on Wednesday, the Risk Index algorithm had already shifted decisively into a short term bearish bias. Trading desk members were warned to begin looking for short exposure while becoming significantly more selective with any new long positions.
Once markets opened, Nasdaq futures dropped nearly 3%, where I was already carrying short futures exposure. My SPY put positions were closed after approximately a 6.5 point decline, while my QQQ puts were closed following roughly a 14.5 point move lower.
Together with the UA CAPITAL Trading Desk, we generated profitable trades across both the futures and options markets during the selloff.
Thursday brought another major opportunity as MU reported earnings. The July 24 $100 call options that I purchased for roughly $90 were sold around $266, generating an approximate 195% return. This entire swing trade, from entry through position management and exit, was shared live with trading desk.
Overall, the week demonstrated exactly why adaptability matters. Our initial long exposure early in the week was stopped as planned. Once the Risk Index detected the shift in market structure, we quickly transitioned into short exposure and captured strong profits across futures and options. Combined with the 195% return on the MU swing trade, it was another exceptional week for the Trading Desk.
This Week's Scenarios / Prediction
Risk Index
This oscillator reads macro conditions and converts them into a technical risk framework. It was developed internally at UA CAPITAL and remains the primary indicator I use for both short term and long term positioning decisions.
The Risk Index algorithm is currently signaling a short-term bearish bias . As a result, further downside and lower prices remain possible over the near term. However, the longer term structure continues to remain firmly risk on , meaning we can continue looking for bullish reactions once price reaches our higher probability demand zones.
Our approach this week is straightforward: capitalize on short term bearish momentum while remaining prepared to buy quality bounce zones once confirmation appears.
Scenarios / Strategies
Chop Zone
The 743.5–731.5 range is currently defined as our primary Chop Zone.
Within this area, I expect price to remain highly indecisive as buyers and sellers fight for control. Since the probability of false breakouts and poor risk to reward increases significantly inside this range, I do not intend to initiate new positions while price remains within the Chop Zone.
Short Scenario
Trigger: A confirmed breakdown below the Chop Zone with a daily close below 731.5.
Targets: 723.5 → 716.5 → 710
Invalidation: Daily close above 743.5.
Long Scenario 1
KEY Level 1 (723.5) This is the first major demand zone. If price reaches this level and confirms support, call options can be used to establish long exposure.
Trigger: Price must reach the level and produce a bullish candle close back above the zone.
Targets: 731 → 739
Invalidation: Daily close below 716.5.
Long Scenario 2
KEY Level 2 (710) This is the second major demand zone. If price reaches this level and confirms support, call options can be used to establish long exposure.
Trigger: Price must reach the level and produce a bullish candle close back above the zone.
Targets: 716.5 → 723.5 → 731
Invalidation: Daily close below 703.
Position Management Rules
1. Entry model: Aggressive: 1 hour candle close above/below the designated level. Conservative: Daily candle close above/below the designated level.
2. Take profits in stages because market reversals can happen quickly.
3. After the first profit target is reached, move all remaining stop losses to breakeven and convert the position into a risk-free trade.
4. A reaction from the level must be confirmed. We do not predict price. We react to price.
5. Daily candle close below the designated bounce zone equals stop loss.
Notice: Starting a fresh, high frequency track record for SPY, QQQ, and core equities on TradingView. Moving forward, all institutional research, weekly outlooks, and mid week updates will be tracked consistently right here.
This analysis is for educational purposes only and reflects my personal opinion. It is not financial advice.
Short 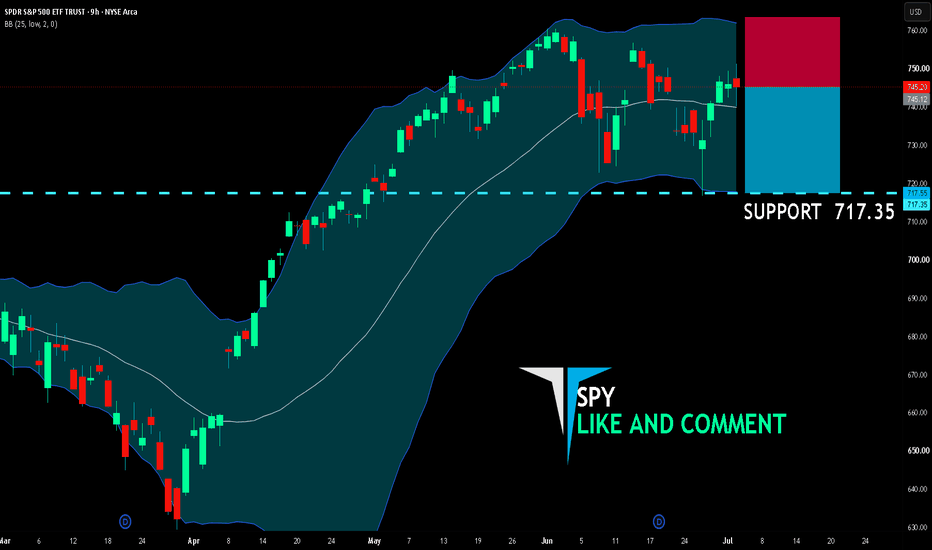
Long
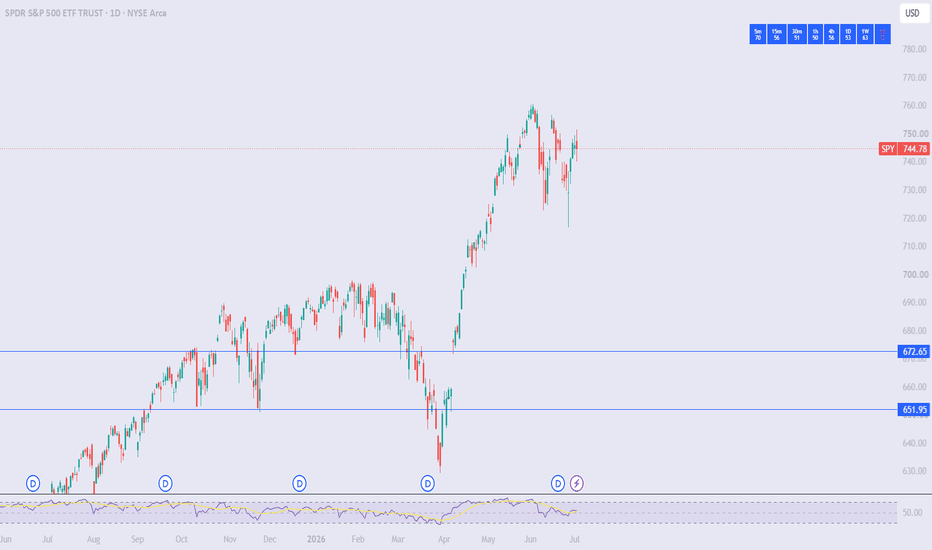
SPY: Weekly Outlook Hey everyone,
Here are my thoughts on SPY for the weekly, plus as an added bonus I will give you my LLM's thoughts on SPY for this week haha. More insightful than I have time for xD.
For SPY, looking for Bearish Monday. SPCX is being added to the the NAS which I left out of my QQQ idea because I thought it to be irrelevant with Monday already projected to be bearish, but because someone in my group is so obsessed with it and feels I need talk about it (said with love and respect xD), here it is. Its being added to the NAS and historically additions to indicies are bearish events for both the ticker and the index. So it explains some of the bearish sentiment being forecasted for Monday for sure. Though not directly impacting S&P since its not being added to the S&P, S&P is not immune to what tech does / QQQ does.
The SPCX addition is likely to be weighed under 1% of the NAS but it still requires displacement of other tickers. The outcome is actually paradoxical, despite indicies having to buy the level of shares to match the weight, the index and the ticker affected tend to sell. I am not 100% clear on this as the explanation is quite complex. But essentially, the index managers buy pre event on the close price of the day (so after hours orders) and because arbitrage players know its coming, they accumulate before the event and release on the event, which ends up being a profit taking event on the actual release. This is massively simplified but is the gist of the idea.
Back to SPY, overall outlook on the week is bullish. The high probabiity target on the month actually corresponds to PH2 on the week, so that is quite interesting (yellow target). We have a very bullish quarterly high probability (pink line), worth paying attention to but not worth expecting to hit right away. As I indicated in my QQQ idea which is equally true for SPY, currently the regime is mean reverting and not really dip buying / rip shorting. Its mostly mean reverting, aggressive up moves followed by aggressive down moves.
Strategies for this type of regime are simply BB, Z-Score, even a lower timeframe EMA can work. Easy to trade if you like to scalp and be in and out fairly quickly.
The targets are posted on the chart, but before I conclude the idea, I will share my LLm's weekly analysis, which goes into much more depth that I really can on my own without a lot of overhead haha, so here you go:
Overview
Current Price: $744.78
Time Horizon: 5 days
Velocity: The current Z-score is -1.02, indicating an EXTREME CLIMAX state.
Key Indicators
Regression Analysis:
Bullish Box: $757.97
Bearish Box: $731.21
EMA Analysis: 20% consensus is bullish.
XGBoost Analysis: 73.3% consensus is bullish.
Analogues: 10/10 Bullish | Drivers: vol_v, entropy, rsi, hurst.
Celestial Bias: BULLISH (color commentary only, no impact on confidence level)
Fibonacci Structural Analysis
Daily Timeframe:
Resistance: $746.68 (141.4%)
Distance: 0.26% above current price
Historical Rejection Rate: 75%
Support: $738.2 (127.2%)
Distance: 0.88% below current price
Historical Hold Rate: 25%
Weekly Timeframe:
Resistance: $760.4 (161.8%)
Distance: 2.1% above current price
Historical Rejection Rate: 100%
Support: $727.1 (141.4%)
Distance: 2.37% below current price
Historical Hold Rate: 100%
Monthly Timeframe:
Resistance: $760.4 (161.8%)
Distance: 2.1% above current price
Historical Rejection Rate: 0%
Support: $663.1 (141.4%)
Distance: 10.97% below current price
Historical Hold Rate: 100%
Confidence Level
Confidence Level: 70%
Swing Target
Primary Swing Target: Given the regression analysis and Fibonacci levels, the primary swing target is $757.97 (Bullish Box) as it aligns with the 141.4% Fibonacci level.
Secondary Swing Target: If the price fails to hold above the 127.2% support level ($738.2), it could retest the 141.4% support level ($727.1).
Day-by-Day Trajectories
Day 1: Price is likely to consolidate within the current range, possibly testing the 141.4% resistance level ($746.68).
Day 2-3: If the price breaks above the 141.4% resistance level ($746.68), it could push towards the 161.8% resistance level ($760.4).
Day 4-5: If the price continues to rise, it could reach the Bullish Box target ($757.97). However, if it fails to break above the 141.4% resistance, it could retest the 127.2% support level ($738.2).
Final Verdict
Final Verdict: BULLISH
Given the high consensus from XGBoost and the strong Fibonacci support, the primary trajectory is bullish. However, the market is currently in an EXTREME CLIMAX state, which increases the risk of a short-term pullback. Therefore, while the overall trend is expected to be bullish, traders should be cautious and manage risk appropriately.
In my opinion, 757 is on the high end of things since it involves pushing towards the third high target and implies somewhat of a breakout, but the fib levels provide a great guide as potential areas to watch for support/rejection. Also note the overly bearish EMA metrics. Though the majority of metrics are bullish which is why the LLM is pushing a bullish narrative, something to watch out for.
Overall those are my thoughts, not advice of course.
Take care everyone and as always, safe trades!
QQQ/NQ1! Month and Week Here are my thoughts on QQQ/NQ1! for next week and the current month.
The chart has Monthly levels for QQQ. With the most pressing being the yellow line represent the monthly high probability target of 742.61.
QQQ came just shy of snagging the second low range 702 on the month, which remains a possibility into next week, depending on how much Asia and London want to pump it Sunday night.
For QQQ on the month the targets to watch are:
High targets:
TP1: 768 (27.3% probaiblity)
TP2: 774 (9% probability)
With the high prob target being at 743 which serves as the current immediate upside target.
Low targets:
721 (98% probability); already hit
710 (68% probability); already hit
The Week Ahead
For the week ahead, going into Monday, expect some selling pressure. Looking at NQ1!:
With expectations on the day between Sunday into Monday close to retrace down to 29183.64 (96.6% probability).
However, the week for both NQ1! and QQQ are generally optimistic.
For NQ1!:
Projections for NQ1! (Weekly)
High targets:
TP1: 30098.97 (84.6% prob)
TP2: 31001.91 (89,6% prob (higher probability here because they are separate models)).
On the low side:
28427 (3.7% prob)
27409 (2.8% prob)
For the week on QQQ:
730 is what we should be watching.
In the longer range, the market has some pretty bullish high probs on the quarter but a quarter is a long time and just started some days ago. The reality is the market can crash and recover in much less time than it takes for a quarter to elapse. So its important to stay vigilant.
As of now, the market is in a mean reversion regime, you would do well to continue using strategies such as BB or z-score until a breakout comes either way.
I'll leave the analysis at that, overall for the short term outlook is bullish save for Monday. Unsure of the gap likelihood, but if I had to guess, gap up probably. We could even see NQ1! take out its weekly high at 30098.97 before we even open on Monday, which is typical for this market lol.
Good luck! Safe trades and take care everyone!
 Long
Long
Long 
Long

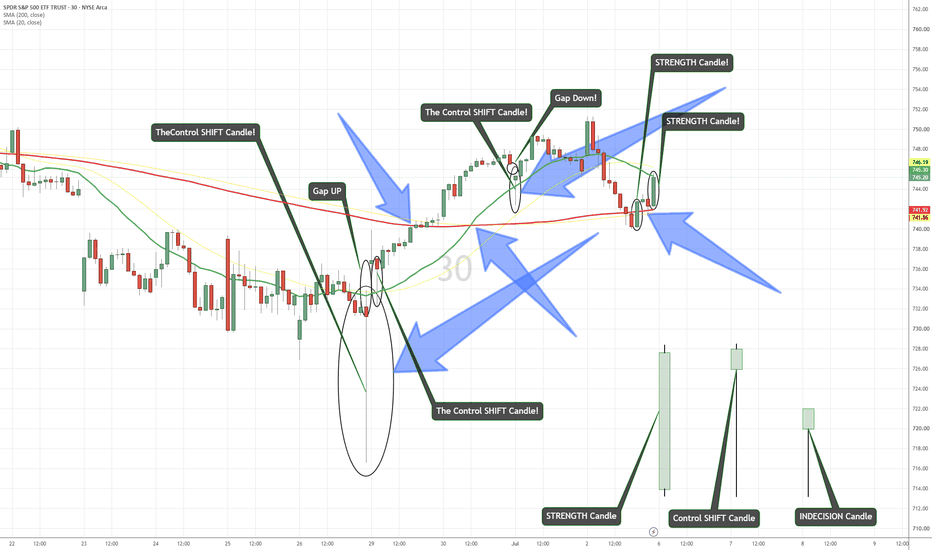
SPY Candles Direction Market!STRENGTH, Control SHIFT, INDECISION Candles!!!
STRENGTH
A "strength candlestick" (or strong candle) in trading refers to a price movement with a large body and very short (or no) wicks. It indicates decisive dominance by either buyers or sellers. A strong bullish (green) candle means aggressive buying, while a strong bearish (red) candle means aggressive selling with little to no resistance.
Why Candlestick Strength Matters
Understanding candlestick strength is essential for price action analysis because it reveals the momentum behind a price move, rather than just the pattern itself.
The Real Body: This reflects the distance between the open and the close. A tall body shows high urgency and conviction.
The Wicks (Shadows): These indicate price rejection. Short wicks mean the winning side maintained control throughout the entire time period without pulling back.
Common Types of Strength CandlesMarubozu: A candle with a maximum-sized body and no wicks at all. A bullish Marubozu indicates buyers controlled the price from the open to the close.
Momentum Candles: A sequence of large-bodied candles that show a strong directional trend.
Reversal Momentum: Sometimes a single strength candle is so large it engulfs the previous two or three candles, signaling a powerful shift in market sentiment.
Control SHIFT
A "shift control candle" (or "control shift") refers to a specific candlestick that signals a decisive change in market momentum, showing that either buyers or sellers have taken full control of the price action.
These candles often appear near major turning points. Key characteristics include:
*Bullish Control Shift: A candle forms with a long lower wick and closes near its high. This indicates that sellers tried to push prices down, but buyers stepped in aggressively, rejecting lower prices and taking control.
*Bearish Control Shift: A candle forms with a long upper wick and closes near its bottom. This shows that buyers initially pushed the price up, but sellers overwhelmed them, forcing the price down and taking control.
*The Breakout: Traders often look for this candle to "sweep" or break above/below the high or low of the previous candle. This confirms the shift in power.
INDECISION Candle
An indecision candlestick indicates that neither buyers nor sellers are in control, resulting in a small body where the opening and closing prices are almost identical. The long wicks on both sides show the market tested higher and lower prices but couldn't commit, signaling a potential shift in momentum.
Types of Indecision Candlesticks
Doji: The most common indecision candle. The open and close are exactly (or nearly) equal, forming a plus-sign (+) shape with long wicks.
Spinning Top: Has a slightly larger body than a Doji but features upper and lower wicks of similar length. It indicates an intense battle between buyers and sellers that ended in a stalemate.
High Wave Candle: Similar to a Spinning Top but features exceptionally long wicks. It signals high volatility alongside market uncertainty.
Long