CIBR - Cybersecurity Stock Hit New Highs!Cybersecurity stocks surged to fresh records on Monday, with the First Trust Cybersecurity ETF (CIBR) reaching an all-time high as the tech-heavy Nasdaq Composite (^IXIC) notched a new record of its own. The simultaneous milestones suggest that investors are increasingly treating cybersecurity as a core holding rather than a niche sector bet, and that the broader market's appetite for technology exposure remains strong despite persistent questions about valuation and macroeconomic conditions.
T
ETF market
SPY 1h: a close below the rising channel, and its levelsSPY 1-hour, with our Pattern Breakout Signals study at default settings.
What broke
The 1-hour candle that closed at 13:30 New York closed at 764.11, below the lower line of a rising channel the study found on its own. At that candle the channel ran from about 765.53 (lower line) to 785.34 (upper line). Red down triangle: side Short, grade B.
The levels, drawn from that close
Entry 764.11
Stop 767.76, 1.5 times the prior bar's ATR above the close
T1 760.46, T2 756.81, T3 753.16: one, two and t
SPY at the Crossroads | Breakout, Breakdown Or Trap?Current Price: $771.70
Timeframe: 15-minute
SPY is trading just below the Point of Control (POC) at $772.31, with recent candles showing selling pressure near this key level. The next move depends on whether buyers reclaim the POC or sellers maintain control.
🟢 Bullish Scenario
Entry trigger: A 15-minute candle closes above $772.31 and holds on a retest.
Upside targets: $775.65 → $777.76 → $780.47
Confirmation: Strong volume and sustained buying above the POC.
🔴 Bearish Scenario
Entry tri
SPY: Weekly Double Top at 780, Watching 750 for ConfirmationSPY has tested the 780 area twice, in August and again this month, and both times sellers stepped in. That's a potential double top on the weekly. The latest push into 780 came with bearish RSI divergence, so momentum is fading even as price retests the high. The bigger uptrend is still intact: price is above the rising moving averages and the long-term trendline. That makes this a watch for confirmation, not a call that the top is in yet.
📉 Confirmation: a weekly close below 750, the September
SMH: trend goes neutral after breaking its monthly target downSMH closed Thursday at 558.84. It lost its October and Q4 pivot at 610.68 last week, then went through the monthly target down at 572.91 on Wednesday without stopping. On my side the trend reading turned neutral after Thursday’s close, from bullish a week ago. So the buy-low-in-an-uptrend setup I was watching is off for now. I’d rather wait for the trend to pick a side again, or for a daily close back above 572.91 that shows the selling is done. Over the last 20 sessions semis went from the best
TLT closes above its range top while the trend is still downTLT closed Tuesday at 78.34, above its 2026 yearly target at 77.89 and well above its October and Q4 pivot at 76.94, so the monthly and quarterly bias point up while the yearly bias stays down. It also closed above the top of its short-term range, which usually means the move is stretched for now. On my side the trend is still bearish, so for me this is a strong bounce inside a downtrend until the trend turns. The next level above is the monthly target at 79.41, where I’d take some profit if lon
XLF: back above its yearly pivot, all three biases point upFinancials (XLF) closed Monday at 55.05, back above the 2026 yearly pivot at 54.81 for the first time since September 25. The October and Q4 pivot at 53.21 is already well behind it, so the monthly, quarterly and yearly bias now all point up. The next level is the monthly and quarterly target at 55.82; the high since October 1 is 55.17, so it has not printed yet. If long, that is where a long-side process takes partial profits rather than adds. The line to hold is 54.81 on a daily close: a close
SMH back above a key level as semis lead a narrow marketSemiconductors closed Thursday at 617.81, above 610.68 after stalling just under that level for a week. Semis and tech are leading while small caps lag, so this is a narrow move.
What I'm watching:
- Daily closes above 610.68 keep the move intact. A close back under it would undo the breakout.
- Next level above: 651.04, near the late-June highs. If long, that's where I'd think about taking some profit.
- Today's US jobs report can move rates and tech together.
Research 16.10.2026🌏 Markets:
AMEX:SPY +1.31 +0.17%(pre/m)
NASDAQ:QQQ -0.23 -0.03%(pre/m)
🆕 Economic News:
S&P 500 futures tick higher but the index heads for a losing week; Nasdaq futures flat as chipmakers slip again
08:30 USA – Import/Export Prices (Sep)
08:30 USA – NY Fed Services Activity Index
09:15 USA – Industrial Production (Sep)
09:15 USA – Capacity Utilization (Sep)
14:00 USA – Monthly Budget Statement (Sep)
16:00 USA – Net Long-term TIC Flows (Aug)
18:00 USA – Fed Goolsbee Speech
SPY Reclaimed 770.09 On The Close After Dipping To 764.43.SPY Reclaimed 770.09 On The Close After Dipping To 764.43.
SPY dipped to 764.43 yesterday, briefly under the 765.52 shelf, then reversed and closed at 771.79 - back above the 770.09 floor it lost in the CPI session. It is trading near 773.20 premarket. An hourly bullish announcement printed at 4 am with CQI in Q1, but the hourly traffic light is red; the 4H light is green with the quartile neutral and IMP at 2/5 on elevated volume. The reclaim came on a data day and the hourly light and announc
VXUS: Pullback Toward SupportVanguard Total International Stock ETF
VXUS is trading at 83.84 on the daily chart, pulling back from the 88.27 resistance after a prolonged advance within a broad ascending channel. Price is testing a key support cluster around 82.66, where the rising trendline and previous consolidation zone converge. The first recovery level is 85.33, while a decisive breakout above 88.27 would confirm renewed bullish momentum and open the way toward 94.67. If support at 82.66 fails, the next downside levels
$SPY & $SPX — Levels for Friday, October 16, 2026🔮 AMEX:SPY & SP:SPX — Levels for Friday, October 16, 2026
📊 Lower-impact U.S. Economic Data (ET)
8:30 AM | Import Prices m/m | Forecast: 0.9% | Previous: 0.7%
9:15 AM | Industrial Production / Capacity Utilization | Forecast: 0.4% / 76.5% | Previous: 0.0% / 76.3%
⚠️ For informational purposes only. Not financial advice.
📌 #SPY #SPX #StockMarket #TechnicalAnalysis #Trading
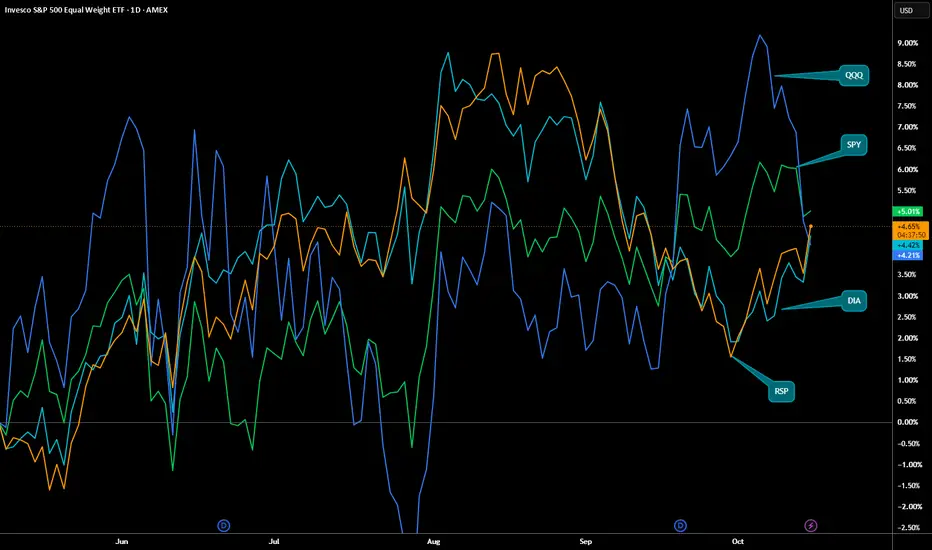
The Real Issue; Rotation and Not CPILooking at the QQQ versus RSP, it shows that there is an out of tech rotation. Yet people blame the CPI for the sell off. If CPI was the issue, the market development up until October reading should have been much worse and consumer stocks (e.g. KO, JNJ etc.) would be going down too. Charting QQQ vs RSP vs SPY shows that RSP has been on the uptrend, while QQQ, which is driven by heavy weight techs on the way down. Therefore, contrary to the popular belief that CPI is the issue, it is a pure ou
$SOX: Oversold Relief Bounce?Semis have been under heavy pressure, but the tape is flashing some early exhaustion signals worth monitoring. We are not calling a definitive bottom here, but the setup is getting ripe for a fast mean reversion pop if buyers step in to defend this floor.
The Big Picture (4HR Chart)
The 4HR RSI is pressed deep into extreme oversold territory near the 20 mark.
While price broke down to test the SUPPORT shelf, the momentum histogram is printing a clear bullish divergence with higher lows versus
XLV: health care closes back above its monthly & quarterly pivotHealth care (XLV) closed Wednesday at 168.81, above its October and Q4 pivot at 168.15. The monthly and quarterly bias now point up, matching the yearly bias, so all three periods agree. The next monthly target is 172.84; the high since October 1 is 170.38, so it has not printed yet. If long, that is where a long-side process starts taking partial profits rather than adding. The line to hold is 168.15 on a daily close: a close back under it would turn both shorter biases down again. Intraday dip
QQQ hits its monthly target down after losing its October pivotQQQ closed Wednesday at 728.95, under its October and Q4 pivot at 742.58, which turned the monthly and quarterly bias down while the yearly bias still points up. It also closed below the bottom of its short-term range, on the same day as the big tech and semiconductor ETFs. Thursday’s open went straight to the next level below: the monthly target at 718.40 printed in the first minutes, with QQQ trading around 716 at the time of writing. That is where a short-side process takes profits rather tha
SPY Is Holding Above 765.52 Below The Lost 770.09 Floor.SPY Is Holding Above 765.52 Below The Lost 770.09 Floor.
SPY closed at 769.60 yesterday, 0.49 under the 770.09 floor it lost in the CPI session, and is trading near 767.00 premarket with a 766.68 low - the 765.52 shelf has not been touched. The hourly traffic light is yellow with the quartile in Q1 and IMP at 2/5 in extension, while the 4H light is green with the quartile in Q4 and IMP at 3/5 mixed on elevated volume. The two timeframes disagree, and producer prices and retail sales print at 8:
Research 15.10.2026🌏 Markets:
AMEX:SPY -2.20 -0.29%(pre/m)
NASDAQ:QQQ -8.67 -1.19%(pre/m)
🆕 Economic News:
Nasdaq futures fall as the AI rout deepens on debt and rate concerns; Dow futures edge higher
08:30 USA – PPI (Sep)
08:30 USA – Retail Sales (Sep)
08:30 USA – Initial Jobless Claims
08:30 USA – NY Empire State Manufacturing Index
08:30 USA – Philadelphia Fed Manufacturing Index
10:00 USA – Business Inventories
12:00 USA – EIA Crude Oil Inventories
16:30 USA – Fed Hammack Speech
23:30 U
SPY: Halfway Is a Charting Convention, Not a Fibonacci RatioThe Halfway Line Is Useful Without Being a Fibonacci Ratio
The 50% line on a Fibonacci drawing is a common retracement convention. It is not a Fibonacci ratio. Its usefulness comes from defining a consistent halfway reference for a selected swing, not from a mathematical guarantee that price must reverse there.
The attached SPY example uses the identified daily upswing from September 16 low 749.60 to October 6 high 781.62. The range is 32.02 points. Half is 16.01; subtracting that from the hig
A Red Candle Can Still Finish Above Yesterday's CloseA Red Candle Can Still Finish Above Yesterday's Close
Candle color and day-over-day change use different comparisons. A standard red body means the close is below that candle's open. A positive daily percentage means the close is above the previous close. A gap can allow both descriptions to be true at once.
The marked October 6 QQQ candle provides a historical teaching example inside the chart reviewed on October 15. It opened at 760.52 and closed at 759.66, making a red body of 0.86 points.