Government bonds
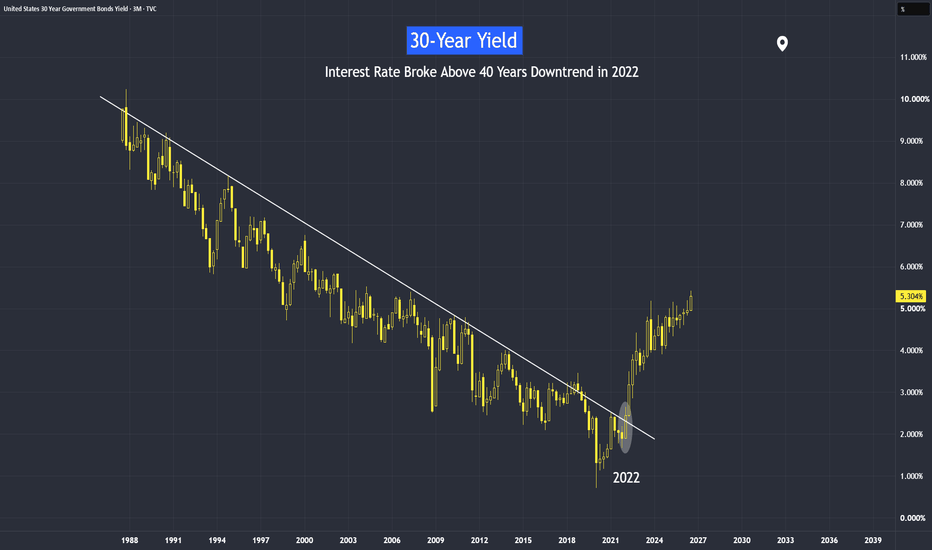
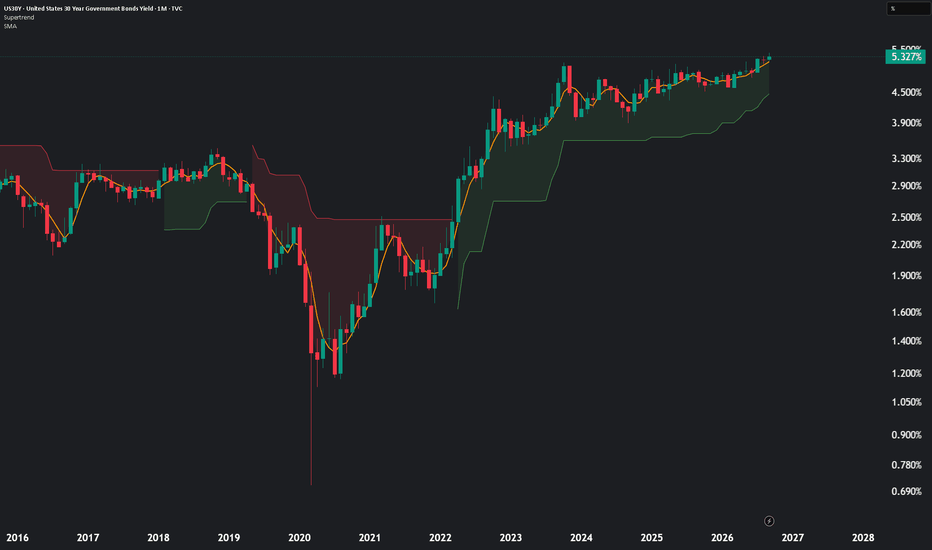
US30Y Breaks to a New Cycle High: 5.50% Is the Next TestThe U.S. 30-Year Treasury yield is trading around 5.327% on the monthly chart, pressing above the major highs formed during the 2023-2025 consolidation.
The long-term structure remains bullish for yields: the recovery from the 2020 low has produced higher lows, the monthly Supertrend is still green, and the latest advance is testing territory not seen in many years. The U.S. Treasury's official 30-year par yield closed at 5.34% on September 18, broadly confirming the level shown on this chart.
Key levels
โข Immediate resistance: 5.50%
โข Above 5.50%: 6.00%, then 6.50%
โข First support: 5.00%-5.10%
โข Secondary support: 4.75%-4.80%
โข Major trend support / invalidation zone: approximately 4.50%-4.60%
Bullish yield scenario
A sustained monthly break above 5.50% would confirm the breakout and increase the probability of an extension toward 6.00%, with 6.50% as the next major long-term reference.
Failed-breakout scenario
A rejection below 5.50% followed by a monthly close back under 5.00% would weaken the breakout. Losing 4.75% would expose the Supertrend area near 4.50%-4.60% and shift the structure toward consolidation.
Why it matters
A rising 30-year yield means falling long-duration Treasury prices and tighter discount-rate pressure on long-duration assets. It can weigh on equity valuations, real estate and refinancing conditions, but it should be treated as a macro risk signal rather than a standalone equity sell signal.
My bias remains bullish on yields while US30Y holds above 5.00%, with 5.50% as the decisive confirmation level.
This analysis is for educational purposes only and is not financial advice.
Laurent - Private Investor
โ
DL INVEST | Community Leader
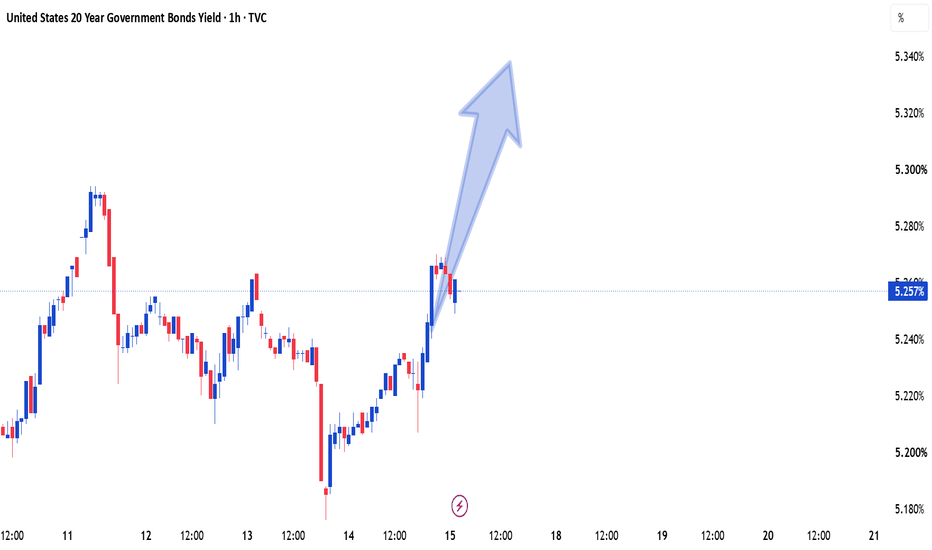
US 20Y Yield โ Bullish Momentum AheadThe US 20-Year Government Bond Yield is showing a constructive bullish structure, with price action indicating renewed buying interest and strengthening upside momentum. The market continues to hold its bullish structure, suggesting that buyers remain active and are positioning for further upside.
From a technical perspective, the setup is supported by continued demand and a favorable market structure. Buyers are stepping in around important areas, keeping the upward momentum intact. Any controlled pullback into demand could provide an opportunity for a favorable risk-to-reward entry.
A sustained move above recent resistance would further strengthen the bullish outlook and potentially open the way toward higher targets. The focus remains on buy-side opportunities while the overall structure continues to favor buyers.
Overall, the trade idea remains focused on bullish momentum and further upside potential, with Demand & Supply analysis supporting the setup. ๐
Bias: Bullish
Setup: Buy Side
Focus: Higher Targets
Why Record Bonds Yield MattersToday, we read the headline: "30-year Treasury yield hits a 19-year high."
Yes, that is an interest rate of 5.3% for a loan tenure of 30 years. Why does this higher interest rate matter?
In this discussion, we will explore the differences between the bank interest rates we receive on our savings or pay for our mortgages, the Fed's rate decisions (called the Federal Funds rate), and this Treasury yield.
Finally, we will look at whether interest rates will continue to rise and how these rising rates will impact the markets.
30-Year Yield
Ticker: 30Y
Minimum fluctuation:
0.001 Index points (1/10th basis point per annum) = $1.00
Disclaimer:
โข What presented here is not a recommendation, please consult your licensed broker.
โข Our mission is to create lateral thinking skills for every investor and trader, knowing when to take a calculated risk with market uncertainty and a bolder risk when opportunity arises.
CME Real-time Market Data help identify trading set-ups in real-time and express my market views. If you have futures in your trading portfolio, you can check out on CME Group data plans available that suit your trading needs www.tradingview.com
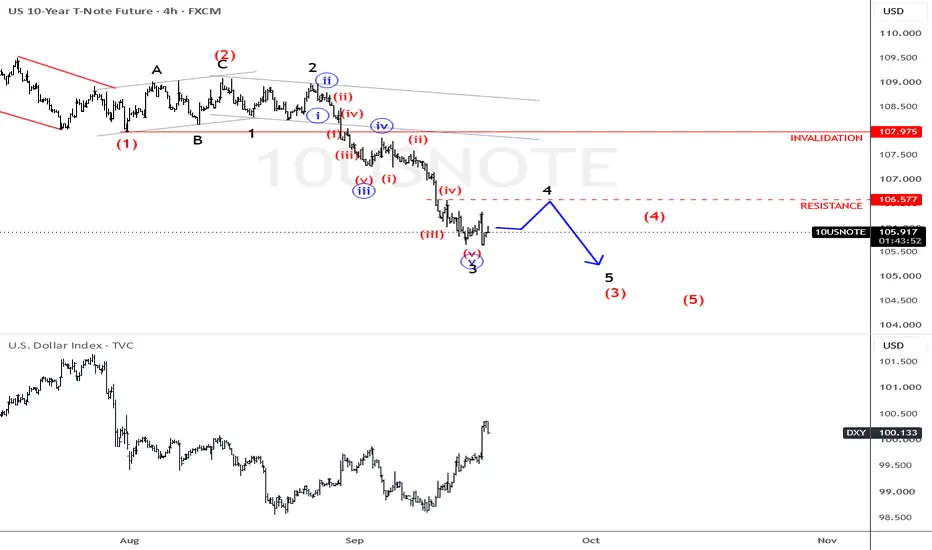
FED raised rates, more dollar strenght possibleYesterday, as you know, the Fed raised rates by 25 basis points as expected, but more importantly, Chair Warsh sounded very hawkish during the press conference. He said that inflation has been well above the 2% target for too long and that the Fed needs to bring it back towards that target. Some policymakers even voted for a 50-basis-point hike. So with the Fed delivering only 25 basis points this time, more hikes are still possible in the months ahead. That's why we saw such a strong move higher in US yields and the US dollar.
Looking at US Treasuries, we are now seeing some stabilization after bonds and stocks recovered during the Asian session following Trump's comments that US interest rates should be lower. However, looking at the 10-year Treasury wave count, this still looks like only a wave four recovery, with important resistance around 106.57. So more weakness in bonds could follow, which would mean another move higher in yields and could keep the dollar supported.
GH
10's back to 5% After the Rate HikeSlightly hawkish lean in the projection, and 10-year yields quickly returned to that 5% marker. The Fed is forecasting one more hike into the end of the year and that's helped to push a run of USD strength to go along with that run-higher in yields.
The next major mark for 10-year notes is the 5.25% level that last traded in 2007 and if that trades soon, it would seem weakness in equities would come along with it.
Next up for the USD is perhaps the more pertinent item for FX markets, and that's how the Bank of Japan positions their widely-expected rate hike. - JS
Free Markets Set Rates Not The FED!"Blame the FED" is such a bullscitt excuse for all political economic theories. It's the villain in their cute story where they are the hero.
In reality, it's the free markets that set rates, not the FED. The FED is always late to the party. This time was no different. The Fed raised .25 bp today. A surprise to no one who understands economics and finance.
What is a pleasant surprise is that the FED has not been taken over by Trumpchenko. This keeps the FED's independence & credibility intact. Good for US macroeconomics, but not a fix.
The Fix is to remove Trumpchenko immediately from office bc the wheels are coming off.
What are the implications? Follow for more.
If you enjoy the work: ๐ Drop a solid comment. Letโs push it to 7,000 and keep building a community grounded in raw truth, not hype.
Warsh's balancing actFed day is here, and the bank is widely expected to hike rates for the first time in three years.
Interestingly, the Fed chair that President Trump took months to select and nominate has come into the bank with a highly hawkish tenor, and this likely has at least a little bit to do with the nomination process. After the administration leaked the name of Kevin Hassett, current director of the National Economic Council and widely considered to be a Trump loyalist, bond markets broke down with yields flying higher. Kevin Warsh was one of the next names on the list, and along the way, Trump said that a willingness to cut rates was a 'litmus test' for whomever he was going to choose.
Matters haven't gone that way, however, as Warsh struck a hawkish tone at his first press conference in June and the reaction across markets was clear. To date, the Nasdaq 100 still hasn't set a fresh high since.
But how hawkish is Warsh, really? It's clear that he has to strike a tone of Fed independence or else the upcoming maturity wall in US debt becomes an even larger problem. If the Fed is disinterested in managing inflation, who would want to hold 10-year notes at a 5% yield?
So, he has to sound like inflation is the priority or else US debt becomes an even more unsustainable problem.
On the other hand, if he invoked a Paul Volcker like stance, where crushing inflation is the only thing that matters, those exuberant valuations in equities start to look even more ridiculous. What's the point of holding on to stocks if the Fed is actively looking to stem economic growth in favor of lower inflation?
So, this is a delicate balancing act, and markets are still very much getting to know Kevin Warsh. It's unlikely that the Fed put has been completely abandoned but given the state of the US Treasury market, there's reason to at least buffer that normally bullish and dovish tone that we've become so used to hearing. - JS
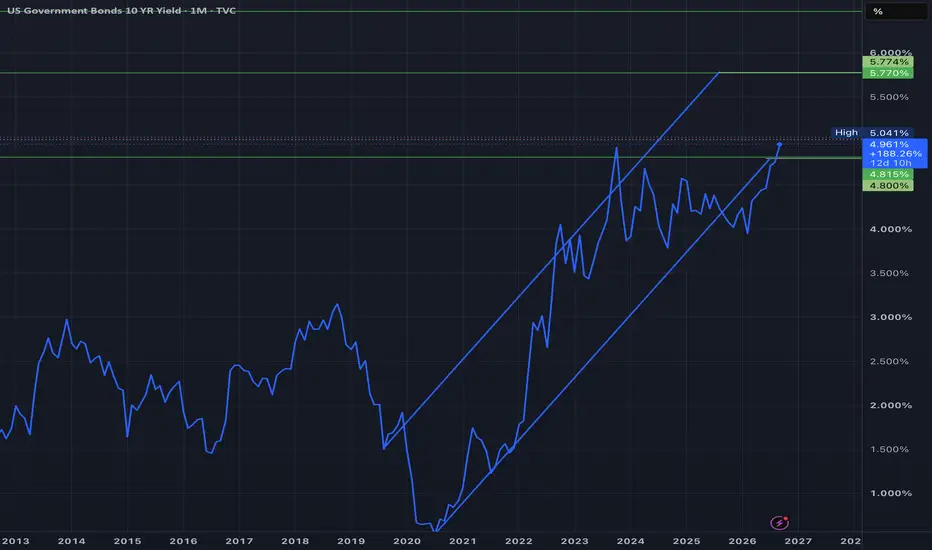
US10Y - Bullish SetupThe 10-year yield has successfully broken out of the descending wedge pattern that contained price action throughout 2024-2025, a technically bullish signal suggesting the consolidation phase is complete. Price is now pressing against the upper trendline resistance near 4.5%, and a confirmed breakout above this level would open the door toward a retest of the October 2023 highs around 5%. The RSI has recovered from oversold conditions and is trending higher with room to run before reaching overbought territory, providing momentum confirmation for the move. Persistent inflation, resilient economic data, and growing fiscal deficit concerns continue to underpin structural upward pressure on yields, giving the technical breakout fundamental backing. A sustained move above 4.5% would shift the macro narrative decisively toward "higher for longer," potentially driving yields into the 4.75โ5.25% range over the coming months.
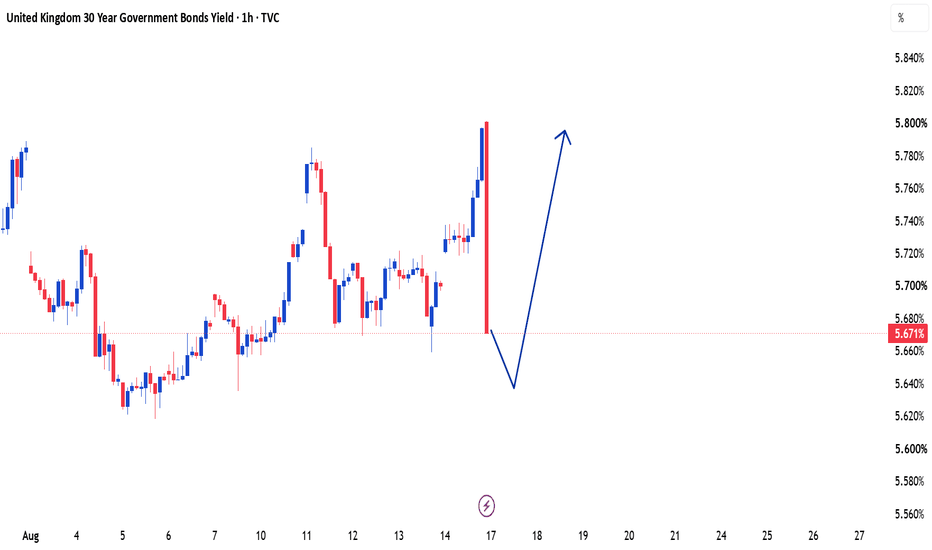
GB 30Y Bonds โ Buy-Side Opportunity After the DropGB 30Y Bonds have experienced an aggressive downside move, but despite the sharp decline, the buy-side setup remains valid according to my analysis and methodology. The recent drop has created a significant move in price, while the current structure presents an opportunity for a potential recovery toward higher levels.
From a technical perspective, the setup is based on the underlying market structure and price behavior around key areas. Rather than reacting to the aggressive sell-off, the focus remains on identifying a potential bullish reaction and positioning for the expected upside move.
I remain confident in the methodology behind this setup. Strong price movements can create emotional pressure, but the analysis remains focused on the defined structure and the original trade thesis.
If the expected bullish reaction develops, GB 30Y Bonds could recover from the recent decline and move toward the projected higher targets. The overall outlook therefore remains buy-side, with further upside potential in focus. ๐
Bias: Bullish
Setup: Buy Side
Focus: Recovery & Higher Targets
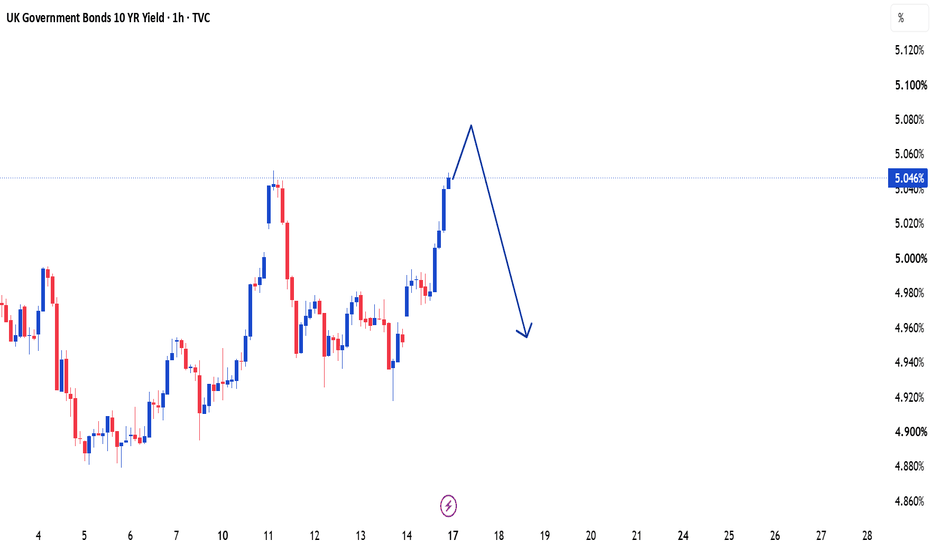
GB 10Y โ Tactical Short OpportunityGB 10Y Bonds continue to show underlying bullish strength, but the current positioning leaves room for a temporary downside move. The idea is to take advantage of that corrective phase rather than treating it as a reversal of the broader structure.
Price action is approaching an area where a controlled decline could develop, creating a potential short-term opportunity for sellers. The key focus is on how price reacts from the current zone and whether bearish momentum begins to build.
This setup is based on my trading methodology and the expected behavior of price around the identified levels. The bullish environment does not prevent a tactical short; the objective is simply to capture the downside leg that may occur before buyers regain control.
For now, the focus remains on the corrective move toward the downside target, while the broader market direction remains under observation.
Market Structure: Bullish ๐
Trade Direction: Short-Term Sell ๐
Objective: Capture the Downside Leg ๐ฏ
GB 2Y Yield โ Bullish Setup & Upside PotentialThe GB 2-Year Government Bond Yield is presenting a strong bullish setup, with price action indicating that buyers are gaining strength and the market has room for further upside. The current structure suggests that bullish momentum is developing, while key price areas continue to support the upward outlook.
From a price-action perspective, the setup is focused on the current bullish structure and the behavior of price around important levels. A controlled pullback may provide a better opportunity to enter on the buy side, while sustained strength above recent highs would further confirm the upside scenario.
The broader trade idea remains centered on buy-side momentum, with the potential for price to advance toward higher targets if the current structure remains intact. The focus is on following the planned setup rather than reacting emotionally to short-term fluctuations.
Confidence remains high in the methodology behind the analysis, with patience and precise execution being essential as the market develops. Overall, the GB 2Y Yield continues to favor a bullish outlook with further upside potential. ๐ฏ
Bias: Bullish ๐
Setup: Buy Side
Focus: Higher Targets ๐ฏ
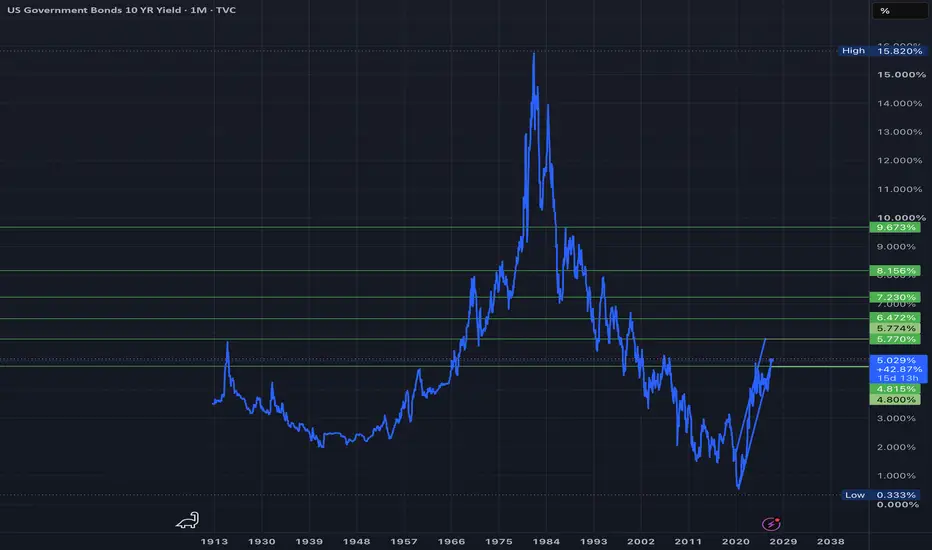
Bull Flag on 10 Year Yield !!If this chart is correct next stop is near 8 % which could take several years to play out. The chart really looks like Bull Flag which makes sense since we were at a historical low for the interest rate.
It is loco to think that interest rate could go that high but in the face of history it makes sense. Also since oil prices and interest rates are so correlated does this mean that oil prices will spike dramatically from here ?
The war in Afghanistan was 20 years long. Does this mean we will have disruption for 20 years in Iran. If Iran is fighting an existential war then this could be the case. The IRGC has stated it will wait out the Trump administration so we are looking at least 2 more years of war. I think that is conservative.
What do you think ? will rate go to 8% in the following years or drop from there ?
Tell me what you think !!
GB 20Y โ Selling the RetracementGB 20Y Bonds are currently maintaining a bullish structure, but the price action suggests that a short-term retracement could develop before the broader move continues.
The trade idea is focused on capturing a sell-side opportunity during the expected pullback. Rather than chasing the current bullish move, the focus remains on waiting for price to retrace into the identified area and then looking for the downside move.
From a technical perspective, the setup is based on the current price structure and expected short-term correction. If the retracement develops as anticipated, it could provide a favorable opportunity for sellers before the market resumes its broader direction.
The analysis remains focused on the planned setup, with patience and proper execution being key. The bullish structure does not invalidate the short-term selling opportunity; instead, the retracement itself is the setup.
Current Structure: Bullish ๐
Trade Idea: Sell the Retracement ๐
Focus: Short-Term Downside ๐ฏ
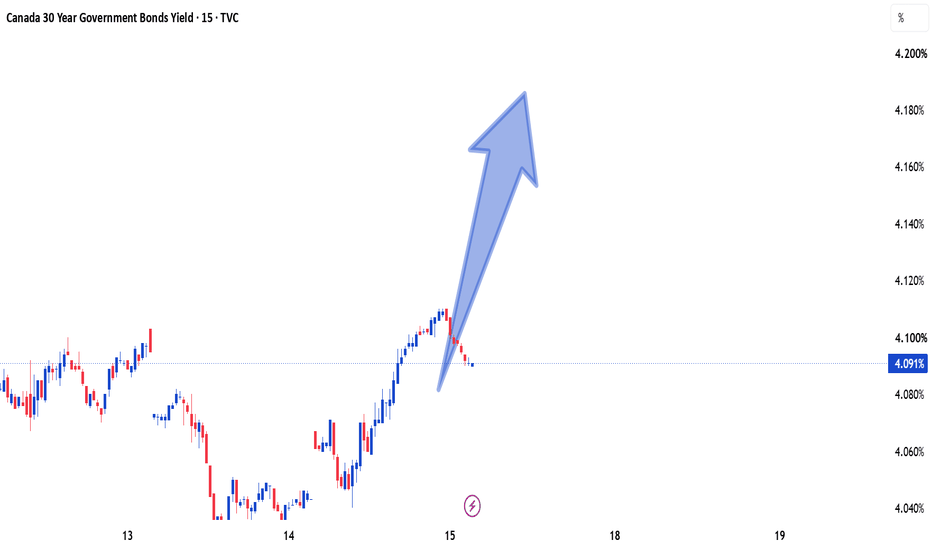
Canada 30Y Yield โ Buying Into ResistanceCanada 30-Year Government Bond Yield is currently trading around a significant resistance zone, yet my outlook remains firmly bullish. ๐๐ฅ
While resistance is clearly present and the market is already at an elevated level, I am still looking for a buy-side move toward a fresh new all-time high based on the structure and signals generated by my own trading method.
This is exactly where confidence in a tested method matters. When the market reaches an obvious resistance area, the easy reaction is to immediately look for a sell. But my analysis is not based on resistance alone. Iโm focusing on the overall market structure, price behavior, momentum and the conditions defined by my setup. If those conditions continue to support buyers, I remain committed to the buy-side idea.
The expectation is that buyers can absorb the selling pressure around resistance, push price through the current high and establish a new ATH, opening the way toward the next upside target. ๐
For me, the key is not predicting every candleโit is trusting the method, respecting the setup and staying disciplined with the plan. Resistance may create hesitation, but a strong methodology creates conviction.
Resistance in front. Confidence behind the setup. New ATH in focus. ๐ฏ๐
Trust the Method. Trade the Structure. Stay Disciplined. ๐ฅ
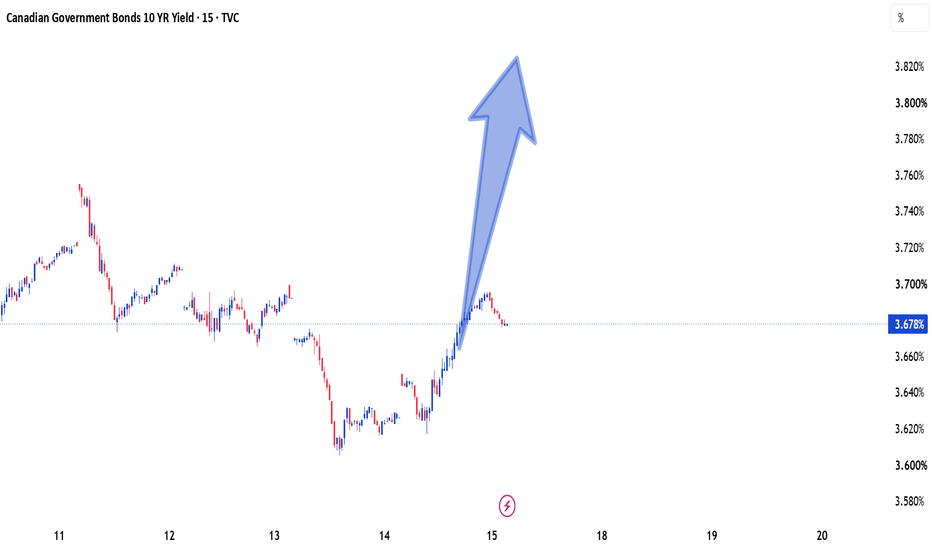
Canada 10Y Yield โ Buyers Preparing for a Fresh HighCanada 10-Year Government Bond Yield is approaching a well-defined resistance area, but my outlook remains bullish. Instead of treating the current resistance as an automatic selling signal, Iโm reading the broader price structure and the conditions of my method to identify the potential for another upside expansion.
The market has already pushed into a key technical zone, which makes this setup interesting. If buyers continue to absorb the supply around these levels and price gains acceptance above the resistance, the next objective can be a fresh all-time high. ๐
What makes this trade idea different is the decision to stay with the buy-side scenario despite the obvious resistance. My approach is based on a structured process rather than reacting emotionally to a single level. Iโm comfortable taking the bullish view because the setup continues to meet the criteria I rely on.
The focus remains simple: follow the method, respect the risk, remain patient and execute with discipline. No need to force the market or change the plan simply because price is approaching resistance.
Resistance is the challenge. The setup is the reason for the buy. A fresh ATH remains the objective. ๐ฏ๐
Trust Your Process. Respect Your Strategy. Execute With Discipline.
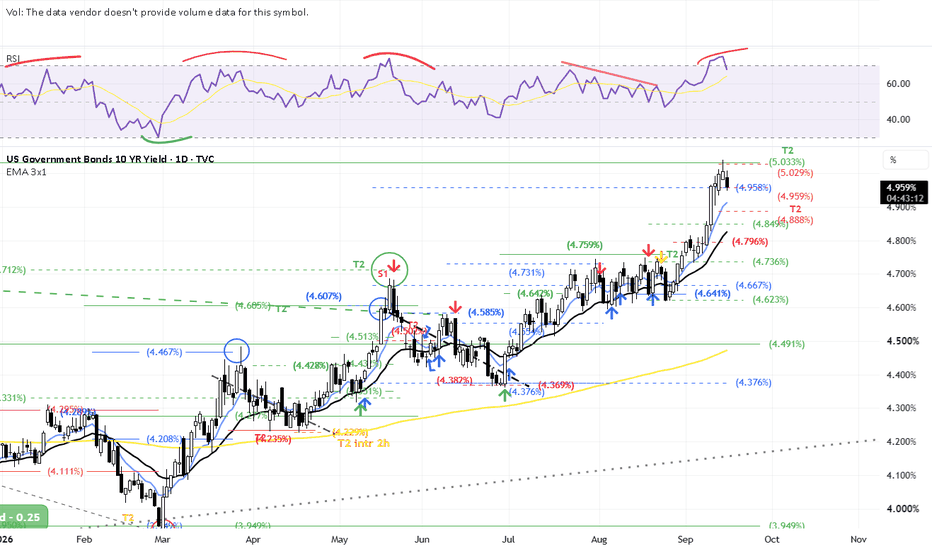
US 10-Year Yield: Uptrend Extends Toward 5.08% ResistanceThe U.S. 10-Year Treasury yield remains in a well-defined daily uptrend, with the latest move pushing toward the 5.08% resistance area. Price action continues to form higher highs and higher lows, while the yield is trading comfortably above both the 50-day SMA near 4.68% and the 200-day SMA near 4.38%.
Momentum remains supportive of the trend. MACD is above its signal line and rising, with both lines holding above the zero level, indicating continued positive momentum. At the same time, RSI has climbed to roughly 74, placing the market in overbought territory. That does not automatically imply a reversal, but it does suggest the current advance is becoming stretched on a short-term basis.
The moving-average structure also reinforces the broader bullish bias. The 50-day SMA is rising and remains well above the 200-day SMA, while price has accelerated away from both averages. This confirms strong trend strength, although the widening distance from the shorter-term average may increase the probability of consolidation or mean reversion.
From a structural perspective, 5.08% is the key nearby technical level. A sustained move through that area would represent a continuation of the prevailing trend, while hesitation beneath it could allow momentum to cool. On the downside, the 4.80%โ4.70% region is the first notable area of prior consolidation and trend support.
Overall, the daily chart maintains a bullish directional bias, supported by price structure, moving averages, and MACD, while the elevated RSI signals that short-term conditions are increasingly extended.
-MW
Canada 2Y Yield โ Short-Term Strength, Upside PotentialCanada 2-Year Government Bond Yield is showing a constructive setup, and my analysis is positioned toward the buy side. The focus here is on capturing the potential upward move as price develops within the current structure.
Rather than relying on a single resistance or support level, this trade idea comes from the specific conditions and signals I follow through my method. The objective is to remain aligned with the market while allowing the setup enough room to develop naturally.
The bullish scenario remains valid as long as the underlying structure continues to support buyers. If momentum strengthens and price confirms the expected direction, the market could extend toward the next upside area and potentially challenge fresh record levels. ๐
Iโm approaching this setup with a clear plan and controlled execution. No unnecessary reaction to short-term noise โ just confidence in the analysis, trust in the strategy and discipline throughout the trade.
Read the structure. Respect the setup. Let the market reveal the move. ๐ฏ
Strategy First. Execution Second. Results Follow.
Waiting for the rate hike?๐ 1. Yield Curve Snapshot & Structural Shifts
Purple Curve (Baseline / Prior State) : Shows a deeply inverted short-end dipping to a local trough around 3Y (~3.55%) before sloping upward toward the 20Y/30Y (~4.65%). This reflects an aggressively priced rate-cutting cycle and lower inflation expectations.
Red Curve (Intermediate Bearish Shift) : Shows a major parallel shift higher and flattening at the short end. Yields across the entire curve rise substantially, with the 10Y moving near 4.70% and the 20Y/30Y reaching ~5.25%.
Blue Curve (Current State / Hawk Pivot) : The current curve reflects a severe bear-steepening and upward shift across all tenors:
Short End (1Mโ1Y) : Rises to ~3.85%โ4.35%, reflecting immediate repricing of Fed policy.
Belly (2Yโ10Y) : Surges, with the 2Y at ~4.63%, 5Y at ~4.80%, and 10Y topping ~4.98%.
Long End (20Yโ30Y) : Peaks near 5.36%โ5.40%, signaling heavy term premium expansion.
---
๐จ 2. Macro Drivers: Geopolitics, Fiscal, & Inflation
๐ข๏ธ Iran Conflict & Energy Supply Shocks
Oil Surge & Headline CPI : The escalation of the Middle East conflict and rising energy prices have driven Brent crude back over $100/bbl. This introduces a classic supply-side commodity shock that feeds directly into headline CPI and raises pass-through risks for core goods.
Stagflationary Risk : Rather than triggering a "flight to quality" rally in Treasuries (which would lower yields), energy-driven inflation is pushing yields higher as investors demand protection against persistent purchasing power erosion.
---
๐๏ธ Fed Chair Kevin Warsh & "Rate Hikes Back on the Table"
Hawkish Stance : Following Kevin Warsh's takeover as Fed Chair and his hawkish guidance at Jackson Hole, the Fed's stance has pivoted firmly toward price stability. Warsh explicitly warned that the Fed has "work to do" if inflation remains sticky above the 2% target.
Hiking Cycle Repricing : With recent CPI readings holding firm at 3.4%, markets have shifted rapidly from pricing rate cuts to pricing an impending 25 bps rate hike. This has pushed short-term bill/note yields sharply upward (from the purple to blue line).
๐งพ Term Premium & Fiscal Supply
Fiscal Deficits & Supply Flood : High federal borrowing needs continue to flood the market with long-dated Treasuries.
Long-End Selloff : With term premium returning, investors are refusing to hold 20Y/30Y paper without significant yield compensation, driving long-end rates to 5.35%+ levels.
---
๐ก 3. What the Market is Pricing In
Short-Term Policy Rate : The front end (1Mโ2Y) reflects a terminal rate higher for longer, with an active probability of rate hikes in upcoming FOMC meetings.
Persistent Inflation Regime : The belly and long end (5Yโ30Y) demonstrate that the market does not expect a quick return to 2.0% CPI, embedding a structurally higher inflation premium.
Un-inversion / Normalization : The yield curve has completed its transition from inverted to strongly upward-sloping (positive 10Y-2Y spread at +35 bps and 10Y-3M at +96 bps), driven by a combination of higher short-end policy rates and expanding long-end term premiums.
TVC:US10Y
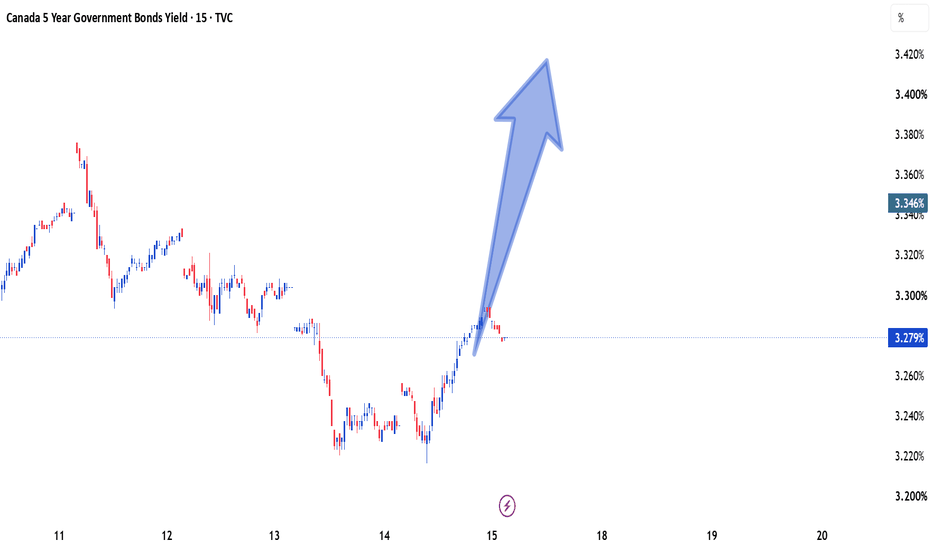
Canada 5Y Yield โ A Bullish Bet Beyond the BarrierCanada 5-Year Government Bond Yield is sitting close to a notable resistance region, but Iโm maintaining a bullish perspective and looking for price to push into uncharted territory. ๐
At first glance, the current location may encourage sellers to step in, but my trade idea is built on the information coming from my own methodology rather than simply reacting to the resistance level. The structure continues to provide enough evidence for me to favor the upside scenario.
If demand remains active and buyers manage to overcome the overhead barrier, the market could unlock another strong leg higher and potentially establish a new all-time high. The important part of this setup is allowing price action to confirm the idea instead of anticipating every short-term fluctuation.
Iโm fully aware that buying near resistance requires patience and strong risk management. That is why my focus remains on following the rules, trusting the system and maintaining discipline throughout the trade.
I donโt need the market to look comfortable before taking a setup. I need my conditions to align.
A difficult location. A clear plan. A bullish objective. ๐ฏ๐ฅ
Read the Market. Follow the System. Stay Consistent.