Research 16.09.2026🌏 Markets:
AMEX:SPY +2.58 +0.34%(pre/m)
NASDAQ:QQQ +4.45 +0.63%(pre/m)
🆕 Economic News:
08:30 USA – Export/Import Prices
08:30 USA – Retail Sales
10:00 USA – Business Inventories
10:00 USA – NAHB Housing Market Index
10:30 USA – EIA Crude Oil/Gasoline Stocks Change
14:00 USA – Fed Interest Rate Decision
14:30 USA – Fed Press Conference
📈 Gap Ups
Reaction to earnings/guidance:
NASDAQ:TCOM
Other news:
Barclays upgraded NASDAQ:ALVO from Underweight to Overweight and raised its price target from $4.00 to $8.00. Barclays highlighted the FDA’s decision to close its May 2026 inspection of Alvotech’s Reykjavik manufacturing facility with a Voluntary Action Indicated (VAI) classification.
Eight operators are advancing AI-RAN proofs of concept and live trials with NYSE:NOK on NVIDIA platforms.
NYSE:BE Gains Another ‘Meaningful’ Proof Point With Project Phoenix, Says RBC — 2 GW Build Reinforces Data Center Opportunity
NASDAQ:SKHY and NASDAQ:INTC are discussing a potential agreement to manufacture memory chips in the United States.
📉 Gap Downs
Reaction to earnings/guidance:
Other news:
NASDAQ:JBHT warned of a decline in earnings and highlighted rising operating costs.
CRYPTOCAP:BTC , NASDAQ:COIN , NYSE:CRCL Under Pressure After CLARITY Act Vote Stalls.
NYSE:STLA to invest over €1bn in French van plant upgrade – report
‼️ Additional
Von der Leyen: The EU’s trade deficit with China has reached €1 billion per day. The EU depends on China for more than 80% of many critical raw materials and for 90% of certain rare earth elements.
-- EU countries’ military spending has increased by nearly 80% over the past five years.
-- We want to make Canada the EU’s first associate member.
Musk’s X has partnered with Interactive Brokers, Moomoo, Gemini, Kraken, and Coinbase to launch trading, including cryptocurrencies, directly through the platform. The social network X is part of the SpaceX corporate structure. NASDAQ:SPCX
Foreign investors are currently buying more US equities than US Treasuries, something that has occurred only three times over the past century. Deutsche says this reflects exceptionally weak demand for US government bonds.
🏢 IPO
NYSE:ASBH – American Savings Bank of Hawaii
Company is the third-largest bank in Hawaii by deposits, serving nearly 400,000 customers through 35 branches and 120+ ATMs across five islands. Its loan portfolio is heavily concentrated in Hawaiian real estate. Core thesis is a well-capitalized local banking franchise with a century-long operating history and strong market presence in Hawaii.
Price: $16.00
Shares: 8.1M
Raised: $128.9M
Market Cap: ~$1.0B
LTM:
Revenue: $195.2M
Net Income: -$30.2M
Key point:
The bank swung back to net profit in H1 2026 and reported a CET1 ratio of 13.5% and Tier 1 leverage ratio of 9.1%.
Comparable public companies: NYSE:BOH , NASDAQ:FHB , NYSE:WAL , NASDAQ:COLB , NASDAQ:CVBF , NYSE:BANC
📋 List of tickers involved:
NASDAQ:TCOM NASDAQ:ALVO NYSE:NOK NYSE:BE NASDAQ:SKHY NASDAQ:INTC NASDAQ:JBHT CRYPTOCAP:BTC NASDAQ:COIN NYSE:CRCL NYSE:STLA NASDAQ:SPCX NYSE:ASBH NYSE:BOH NASDAQ:FHB NYSE:WAL NASDAQ:COLB NASDAQ:CVBF NYSE:BANC
Best regards – hi2morrow team.
 Long
Long
 Long
Long
Short
$SPY — Confirmed 34-50 Break, But Follow-Through Still MissingAMEX:SPY broke the 34-50 @ripster47 EMA cloud and closed below it — a confirmed 34-50 Break, the first one of this leg.
760.57 is gone too. Price tried it at the open, topped out at 760.35, and closed at 757.39. That level flips to resistance now.
Volume came in above average for the fifth straight session. Sellers are actually showing up — a real shift from the first half of the month, when nothing could get above a normal day's volume.
But the range is still tight, and the low at 756.15 dipped under 756.70 before closing back above it. That's the fourth test of that zone, and the fourth time it's held on the close.
So the structure is bearish, but the follow-through isn't there yet. A real breakdown comes with a wide range and a close on the lows. Today gave neither.
Levels
756.70 is the line now, not 760. Lose 756.15 with the range expanding, and 750 opens up, then 739.63.
No long setup here — price is below both clouds.
AMEX:SPY Short 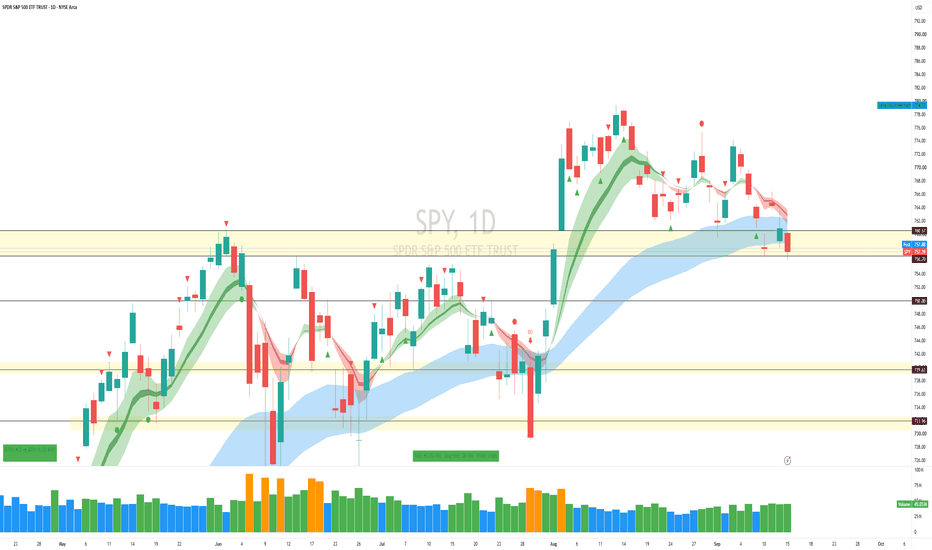
$QQQ — Yesterday's Shakeout Loses Follow-Through Ahead of FOMCNASDAQ:QQQ closed 704.54, down 0.65%, on 26.14M volume against a 31.21M average — 84% relative volume. Range was 5.89 against an 8.99 ATR, 66% of a normal day. Quiet session ahead of FOMC.
Reading the bar
Yesterday was a shakeout — price gapped below the weekly low into 700, ran the stops sitting under it, and reversed on the heaviest volume of the sequence. That's a real signal, properly confirmed.
Today is a down bar that gave back most of that recovery.
Worth being precise on the labels here, because this is where people go wrong. A shakeout needs a support level broken and then recovered. Today's low at 703.64 didn't break anything — it sat inside yesterday's range. A test needs the close in the upper portion of the bar. Today closed at 704.54 against a 703.64–709.53 range, which is 15% of the range, near the low.
So it's neither. It's just a drift lower on light volume.
What that means for the shakeout
Yesterday established demand at 700. Today price came back to check it, and buyers didn't turn up to defend. Sellers didn't need volume either to push it down.
That's weak follow-through to a strong signal — the most common way a shakeout starts to fail. The 702.74 low is still unbroken, so the signal isn't dead, but it's weaker than it was. Another session like this ends it.
Levels
Above: 709.26 restores the shakeout. 714 is where both @ripster47 EMA clouds sit — a close through gives a 5-12 Curl and a 34-50 Crossed together. 724.20 caps the range.
Below: 702.74 is the line. Lose it and the shakeout failed — 700 is the last shelf, and 686.78 opens underneath.
FOMC tomorrow. The levels are set either way.
NASDAQ:QQQ Short 
 Long
Long
Long 
 Long
Long
Short 
SPY Pre-Market Prep — Tuesday, Sept. 15SPY briefly gapped outside the scenarios I mapped last night, but premarket has already pulled price back toward the battlefield.
That matters because today isn’t just about the gap. It’s about whether the market can accept outside the existing structure or gets dragged right back into negotiation.
The macro backdrop is still ugly:
10Y Treasury yield > 5%, its highest level since 2007
Brent crude around $107
WTI around $103
Markets now pricing roughly a 92–94% chance of a 25 bp Fed hike
FOMC begins its two-day meeting today
Tech is under additional pressure from renewed AI-growth/safety concerns
That combination keeps pressure on growth stocks and makes me cautious about trusting any early bullish move.
Today’s SPY battlefield
759–760 is my first pivot.
If SPY can hold above it and start building structure, I’m watching:
762 → 763 → 765–766
That 765–766 area is still heavy resistance. A clean move through it would be the first thing that makes me take a stronger bullish continuation seriously.
Above that:
768 is the next major decision area.
And if the market somehow completely shrugs off oil, yields and FOMC risk, 774 remains the bigger upside Projected AOA.
On the downside:
758 is critical.
If SPY loses 758 and starts accepting underneath it, then the bearish scenarios begin gaining serious weight again.
Below that, I’d be watching the 756–754 area, with a deeper move possible if yields continue pushing higher and the market starts pricing a more hawkish Fed path.
What I’m watching for
Bullish trade idea:
Hold/reclaim 760, build structure above it, then use 762/763 as the next confirmation ladder.
Bearish trade idea:
Lose 758, fail the reclaim, and begin building below yesterday’s lower structure.
No-trade idea:
If SPY spends the morning whipping between 758 and 762, that’s negotiation. I’m not forcing a directional trade just because price is moving.
That third scenario may be the most important one today.
We are less than 24 hours from a Fed decision that the market is heavily pricing in already. That can create a lot of movement without producing clean structure.
Bigger picture
The thing I’m watching most is whether the market is beginning to front-run tomorrow’s FOMC resolution or simply repositioning ahead of it.
The 10-year breaking 5% is not background noise anymore. It is one of the most important inputs on the board right now.
And remember:
A hike by itself is now increasingly expected.
The real reaction tomorrow will depend on:
decision + outlook + projections + Powell + yields + oil + price structure
So today I’m keeping it simple.
760 = pivot
762–763 = repair
765–766 = major resistance
758 = breakdown line
Everything else is noise until price proves otherwise.
Preparation > Prediction. Research 15.09.2026🌏 Markets:
AMEX:SPY -1.32 -0.17%(pre/m)
NASDAQ:QQQ -0.74 -0.10%(pre/m)
🆕 Economic News:
08:15 USA – ADP Employment Change
08:30 USA – NY Empire State Manufacturing Index
14:15 USA – CLARITY Act Senate vote
16:30 USA – API Crude Oil Stock Change
📈 Gap Ups
Reaction to earnings/guidance:
NYSE:FPS
Other news:
NASDAQ:VEEA and NovaGen announce potential merger to launch an Edge AI-Powered Global Health Platform
NASDAQ:WAY shares rose following reports that the healthcare software company is considering strategic options, including a potential sale.
NASDAQ:VERA Announces TRUTAKNA (atacicept-vymj) Stabilized eGFR and Prevented Kidney Disease Progression Through Two Years in ORIGIN 3 Final Efficacy Analysis in IgA Nephropathy
Rosenblatt initiated coverage of Nokia NYSE:NOK with a Buy rating and a $15 price target, implying 55% upside.
NASDAQ:ASML is exploring ways to produce more than 110 extreme-ultraviolet (EUV) chip-printing machines in 2028 as artificial-intelligence demand remains "very very strong," JPMorgan says.
NASDAQ:RKLB expects its proposed acquisition of Iridium Communications NASDAQ:IRDM to double its size overnight, as the space company prepares to use the deal as a springboard for a broader expansion across orbital applications and constellations.
📉 Gap Downs
Reaction to earnings/guidance:
Other news:
NASDAQ:TRMD announces pricing of secondary public offering of approximately U.S. $290,250,000
Crypto Stocks NASDAQ:MSTR , NASDAQ:COIN , NYSE:CRCL , NASDAQ:HOOD Tumble 3-5% Ahead of CLARITY Act Senate Vote. Democrats rejected Republicans' latest CLARITY Act text ahead of Senate vote.
European shares hit three-month lows on Tuesday, with banks leading losses, as surging oil prices and bond yields sapped risk appetite ahead of the U.S. Federal Reserve's interest rate decision this week. NYSE:UBS BME:BBVA BME:SAN NYSE:HSBC
‼️ Additional
Wells Fargo cut its year-end 2026 S&P 500 target to 7,700 from 7,950.
-- BofA says US equities are ripe for a correction.
-- Inflation in Spain reached a three-year high in August, while inflation in France accelerated.
RTRS: Elevated mortgage rates continue to hold back the US housing recovery, with the 30-year fixed mortgage rate rising above 7%.
-- Morgan expects two Fed rate hikes this year and further ECB tightening.
-- CME FedWatch now puts the probability of a Fed hike on September 16 above 92%.
Democrats sent Republicans a counterproposal on provisions of the CLARITY Act as disagreements continue ahead of today’s key Senate vote.
-- Cointelegraph says the odds of passage have fallen to 16%.
📋 List of tickers involved:
NYSE:FPS NASDAQ:VEEA NASDAQ:WAY NASDAQ:VERA NYSE:NOK NASDAQ:ASML NASDAQ:RKLB NASDAQ:IRDM NASDAQ:TRMD NASDAQ:MSTR NASDAQ:COIN NYSE:CRCL NASDAQ:HOOD NYSE:UBS BME:BBVA BME:SAN NYSE:HSBC
Best regards – hi2morrow team.
SPY Swept 756.22 And Closed Back On 759.13.SPY Swept 756.22 And Closed Back On 759.13.
SPY traded down to 756.22 on Monday, through Thursday's low, and closed at 759.59 - back on the 759.13 range low it has been arguing with for four sessions. That is a sweep of the lows followed by a recovery into the level, not a breakdown, and price is unchanged this morning at 759.61. The 4H reads impulse continuation lower with volatility in the 95th percentile of its range, the hourly is flagging a swept low alongside a trend-resumption state, and a fresh high-conviction downside print landed on the hourly with congestion warnings attached to it. Conviction and structure point the same way while price refuses to leave the level. Neutral.
Resistance: 762.57 - the shelf lost Monday
Key resistance: 765.52 - the level capping the range
Current price: 759.61
Support: 759.13 - the range low being defended
Key support: 756.22 - Monday's low
Structural floor: 753.22 - deeper support
Two paths from here:
It closes below 759.13 and the sweep becomes a break. Monday's low at 756.22 is the first target under it and 753.22 the next real level, and a close beneath the range low after four sessions of defending it would be the cleanest structural signal this chart has given in two weeks.
It holds 759.13 and works back at 762.57. Defending the low again puts the lost shelf back in play, and only a reclaim of 765.52 would repair anything above that. Four defenses of a level is a shelf; five starts to look like a base.
The low was swept and bought back the same session, which is the opposite of what the conviction surface is describing - and that disagreement is the whole read. 759.13 settles it either way.
Built with SYNTHESIS v3.3 | SOM / ACE / IMP / SYNTHESIS
Study, not financial advice.  Long
Long
 Long
Long
Long 


