Long
Long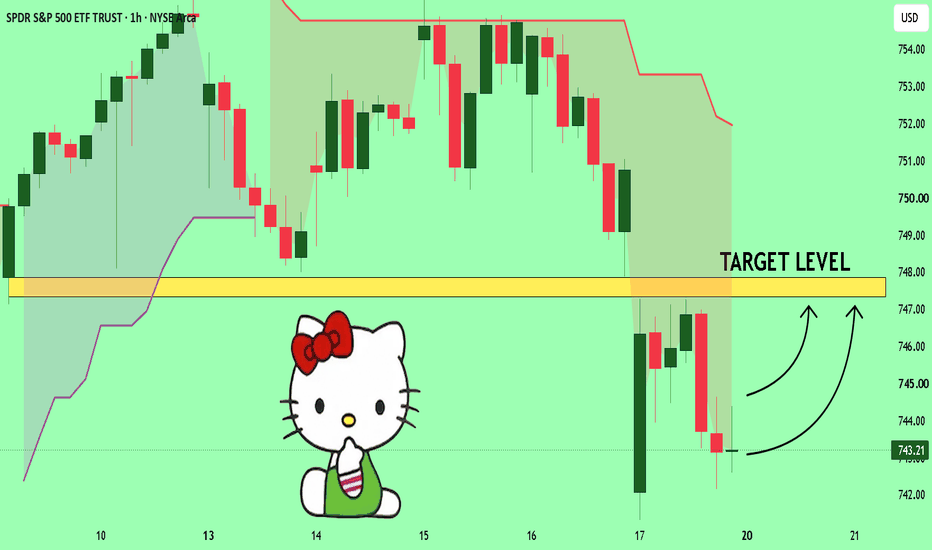
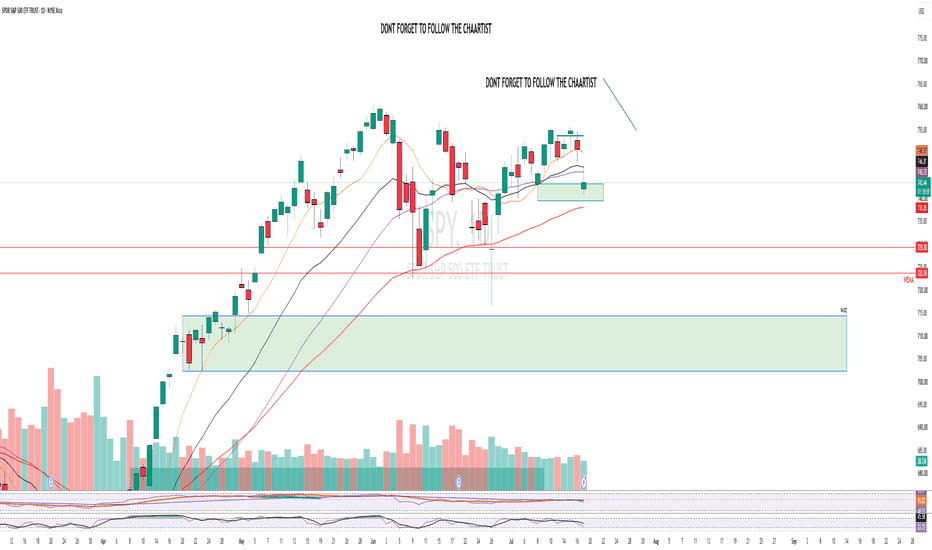
SPY Options Trades Week of July 20SPY is trading right under a major decision zone after gapping down chopping around the 743.20 intraday level. The chart is still coiling between the 740.00 key daily level and the gap breakdown area, with the 760.40 ATH area sitting much higher as the next major upside target if the gap is reclaimed.
I've mapped out three scenarios for the coming sessions:
🟢 Bullish Scenario
If SPY can cleanly reclaim the gap and hold above it, that opens the door for a push back toward 754.00 A confirmed move above would put ATH continuation on the table, but that likely needs strong follow-through and isn’t the base case yet.
🔴 Bearish Scenario
If the 743.20 area loses and price starts failing beneath 740.00, the move lower can accelerate fast toward 736.00 and then 731.00. Note, the bearish move could initially look like a gap fill and continuation, but if buyers don’t step in quickly, the tape can dump back down quickly
🟡 Sideways Scenario (My Lean)
SPY stays trapped between 740.00 and the gap area while market participants wait for direction, with 744 acting as the midpoint magnet. This is the scenario is till very much game for good trades as the chop box could be 8-9 delta or bigger giving us ample opportunity
My Outlook
If I had to rank the probabilities today:
🟡 Sideways (my current lean)
🔴 Bearish
🟢 Bullish breakout
A reclaim of the gap with significant push from chip stocks would force me to respect more upside, while a clean break below 740.00 would shift the bias toward downside continuation. Until then, the chop range is still the most likely path.
As always, the Heavy Diligence Options Signals Indicator will be my primary tool for entries and exits. While these scenarios provide the broader roadmap, the indicator is designed primarily for day trading on shorter timeframes, helping identify higher-probability Call and Put opportunities. Combining those signals with key technical levels helps improve risk management instead of simply guessing the next move.
A side note on the indicator if you prefer the old V1.2 turn off the confirmation layer. If you want to learn more follow on X there is a lot covered on there
Disclaimer: This is only my interpretation of the current chart and is not financial advice. Always do your own research, wait for confirmation, and manage your risk before entering any trade.  Long
Long
 Long
Long
A decade of tops and bottoms, called in publicThe market everybody is afraid of tends to go up, and the market nobody worries about tends to go down.
Here is ten years of that, timestamped on TradingView. Tops and bottoms, one method, nothing backfilled or edited after the fact. All of it public: no private posts, no posting a long and a short and then showing off whichever one worked. Judge the read you're getting before you take it.
Recent
- SPY, April 2026: bought the panic when the tape read like 2015, not 2022. The rally that followed was near vertical and caught most people flat.
- HYPE, Dec 2025: bottom at 25.24 while the loudest voices waited for 20. It ran to about 73, close to +190%, in five months.
- Gold, Oct 2025: called the multi-year top, said sell, don't FOMO. It topped on target.
Gold, the full cycle
Long near 1,395 in June 2019, with the multi-year path drawn on a 2-month chart. Price walked it to about 5,250 by early 2026. Both ends public: the COVID bottom in March 2020 and the top in October 2025. +275% over seven years, same toolkit. The full gold cycle is attached below and written up on my site.
Tops, called early
- AAPL, Jan 2020: flagged the top ahead of the COVID crash.
- AMZN, Jan 2022: topped, said short it, into the tech unwind.
- BTC, Dec 2017: buckle up, bear market started. It lost about 84% into 2018.
Bottoms, when nobody wanted them
- ETH, 2016: long from about 7 euros, ran past 1,200.
- BTC, 2017: bottom near 1,000, ran to 20k.
- BTC, March 2020: called the COVID low.
- AAPL, March 2023: long off the bear-market low.
Calling one turn is luck. Calling them with the same tools for a decade is a process.
Every call above is attached below as a related idea, timestamped. Full write-ups on my site, link in bio. Follow for the live work. Short 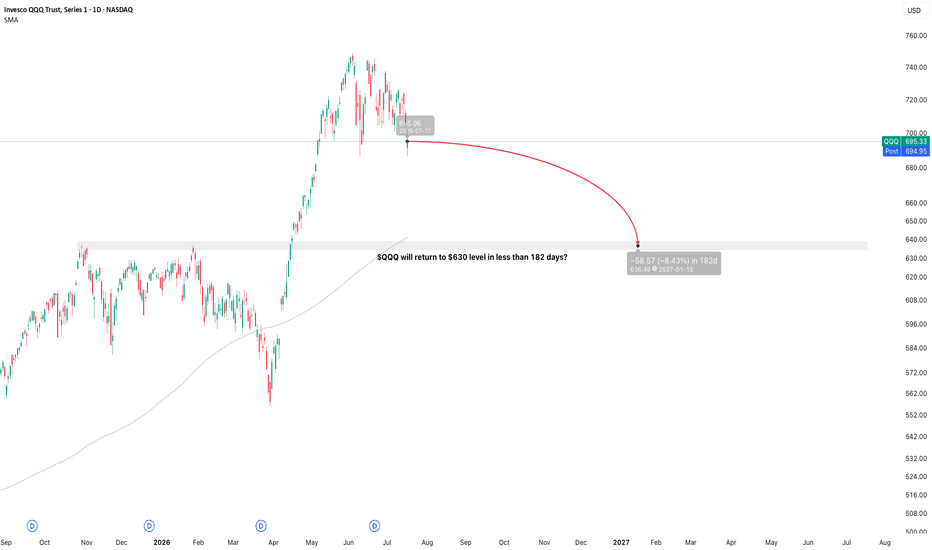
 Long
Long
TQQQ - to serve as my remaining 2026 tqqq trade logs .For the rest of the year I plan on staying ultra focused on TQQQ trades only . I want to see how I do staying out of stocks and only day trading TQQQ momentum , no swings allowed/no stocks allowed
All trades will be posted as notes as close to the time of as possible and I am going to keep a separate R log on my profile description to isolate the R of TQQQ .
Typically ,when day trading trading momentum, I am averaging around a 70% BA with a profit factor of 3.5 but when the market is ranging I usually do less. However, I have never focused entirely on TQQQ day trades so I think this will be a fun way to look at the data of forcing myself to not swing it and also to not trade stocks for the duration of 2026 so that I can get an accurate test.
It is also a matter of discipline for me. Since, it's a challenge for me not to go after strong stocks. The momentum is not as nice with QQQ/TQQQ (vs lots of the stocks I trade). That being said with stocks I need to trade smaller and my focus is less concentrated, I miss trades and I am always rushing to flip through charts before the close. There's a lot more emotion to keep in check and dopamine to keep capped , many transactions . TQQQ allows me to concentrate account quickly , reduces my trades significantly and will probably be easier on my eyes.
Also, trading stocks, some days, you have the momentum.. but it dies before you can get a minimum scalp , so you shouldn't really put on more than 1-2 trades . With TQQQ/QQQ this isn't a problem .
Anyways , pros and cons . Lets see what the results yield as the year progresses .
Look forward to looking back on this when Santa comes .
 Long
Long
Short 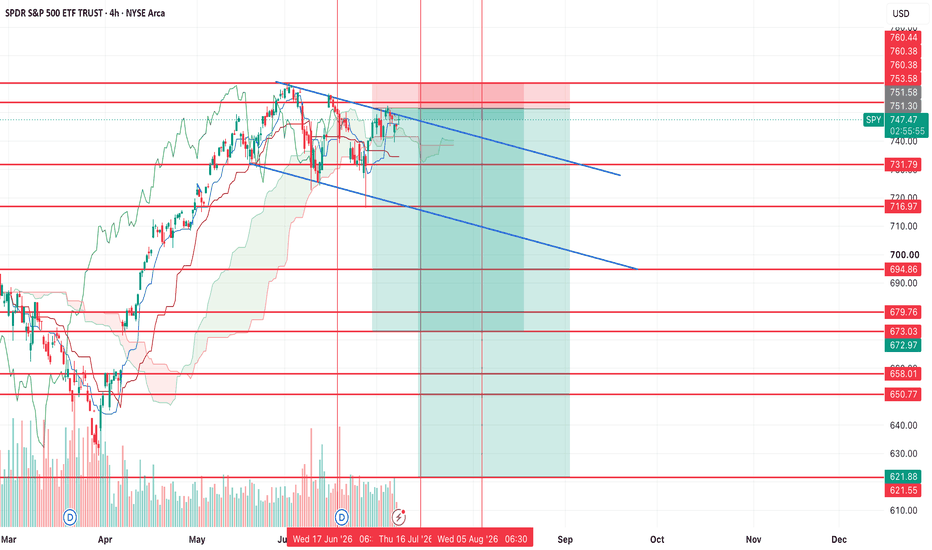
Long 
Short 
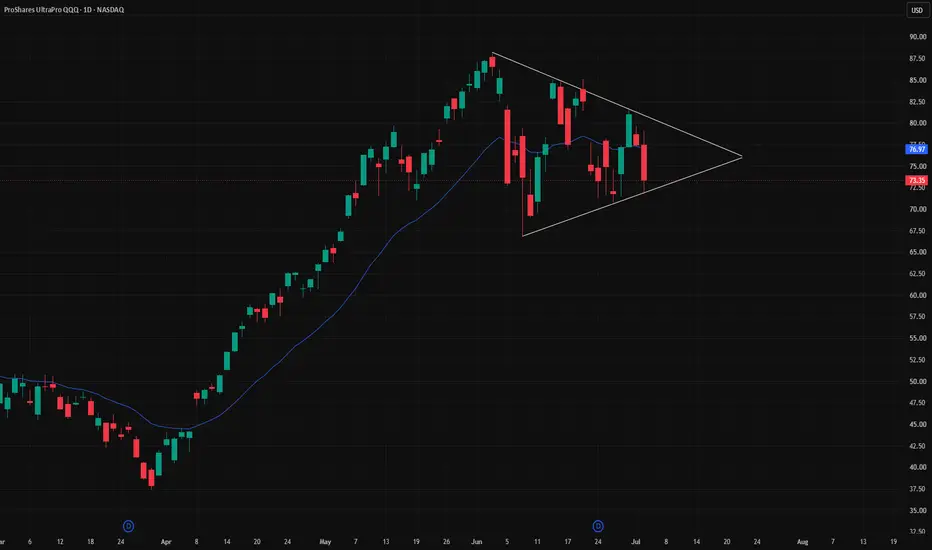
Market Summer Volatility Leads to OpportunityThe market recently pushed to new highs in June and is now undergoing what I would describe as a correction in time, with price consolidating in a choppy, sideways range rather than experiencing a meaningful decline. This type of price action often serves to reset sentiment and momentum while allowing moving averages and other technical indicators to catch up with price.
I've seen many traders calling this a local top, while others believe the current structure resembles a diamond or triangle pattern that is setting up for a significant breakout—or breakdown. While those scenarios are certainly possible, I believe it's important to consider the broader market context rather than focusing solely on the pattern itself.
From a seasonal perspective, July has historically been one of the stronger months for equities. Looking at long-term market statistics, the Nasdaq has typically delivered positive returns during July, with an average gain of approximately 2%. Although seasonality should never be used in isolation, it can provide a valuable tailwind when combined with a favorable technical setup.
The scenario I currently favour is a brief fake-out that traps both buyers and sellers on the wrong side of the market before the primary trend resumes. A pullback toward the Anchored VWAP from the March low would represent a healthy retracement within the broader uptrend while providing an area where institutional buying interest could emerge. This level also aligns closely with the Nasdaq's most recent swing low established in early June, creating a compelling area of technical confluence.
From an Elliott Wave perspective, the current consolidation also has the characteristics of a combination correction. Rather than correcting primarily through price, the market appears to be correcting through both time and structure, frustrating participants with prolonged sideways movement before potentially continuing the larger impulsive trend. This type of correction often creates uncertainty, which is precisely why false breakouts and breakdowns become increasingly common as the pattern matures.
Overall, I believe this pullback could present an attractive opportunity to establish a long position in the Nasdaq if the scenario unfolds as expected. For traders using TQQQ, a stop-loss of approximately 10%—roughly equivalent to a 3% move in the Nasdaq offers a reasonable level of risk. If the correction completes and the market rotates back toward its all-time highs during the summer months, the setup could offer a favorable risk-to-reward profile, with upside potential in the range of 20–30% on TQQQ.
 Long
Long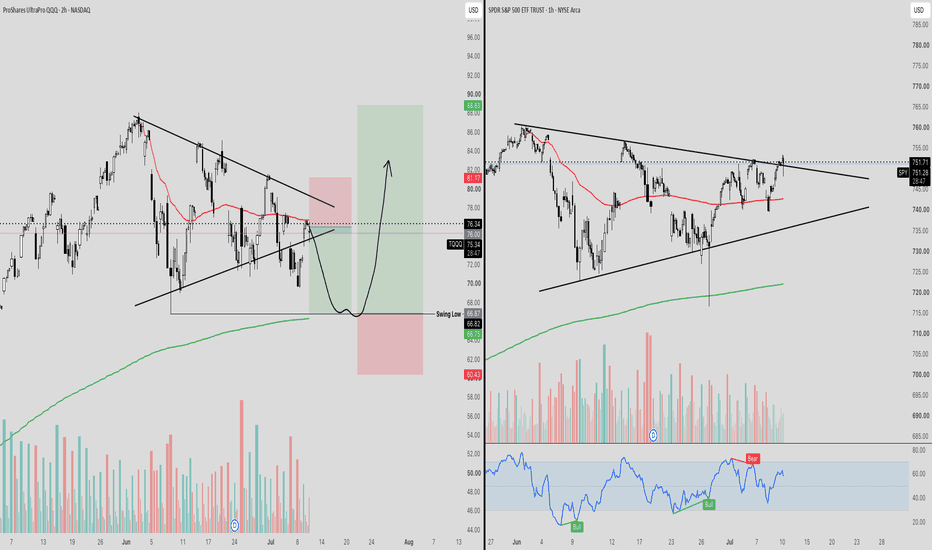
SMH (D) — semis correct while the index holds upNASDAQ:SMH
The semiconductor fund comes into this session with a close at 568.92 and a drop of 8.62% over the last ten sessions, though what matters is not the fall itself but what it contrasts with. The sector is down 15.32% from its all-time high at 671.83 while the S&P 500 trades barely 1% below its ceiling and its equal weight version printed highs this very week. Money is not leaving the market, it is leaving the chips. On the daily timeframe price has lost the EMA 5 (587.25), the EMA 9 (594.35), the EMA 20 (602.32) and the EMA 50 (581.09), yet it keeps a wide margin over the EMA 100 (530.46) and the EMA 200 (460.44). Momentum follows the damage. The MACD works in a bearish cross with its main line (-3.25) below its signal (3.39) and a negative histogram, and the TRIX confirms the shift with its fast line (-0.4977) under the slow one (-0.2855). The short stochastics have collapsed, with the Stoch 14 at 22.16 and the Stoch 5 at 35.26, while the RSI 2 prints oversold (13.23) and the RSI 14 sits in a low neutral zone (43.29). Flow is what weighs most. The daily A/D already has its fast line (17.30) below the slow one (34.25) with a negative histogram, and volume has grown on every leg of the decline, which describes orderly distribution rather than panic.
Monthly Analysis. On the larger timeframe nothing is broken, and that is the starting point of the thesis. Price holds above the entire moving average stack, with the EMA 9 (492.09), the EMA 20 (396.89) and the EMA 50 (282.42) far below the current close, after a rise of 138.61% in fourteen months. The monthly MACD keeps its main line (95.08) over its signal (67.50) with a clearly positive histogram, and the TRIX holds its fast line (7.62) above the slow one (5.53). The warning comes from exhaustion. All four stochastics remain stacked in extreme overbought territory, with the Stoch 89 at 92.89 and the Stoch 14 at 89.93, while the RSI 14 (73.26) works in overbought ground and the RSI 2 has printed a bearish cross inside that zone. The monthly A/D stays in high accumulation, with the fast line (97.09) still above the slow one (95.12). This is the frame that turns the drop into a purge of excess rather than a change of cycle.
Weekly Analysis. The intermediate timeframe is where the turn shows. Price has lost the EMA 5 (593.63) and the EMA 9 (584.44), but keeps a cushion close to 6% over the EMA 20 (535.24), with the stack still ordered upward above the EMA 50 (442.69). The weekly MACD hangs on by a thread, with its main line (59.93) barely over its signal (59.55) and a histogram of 0.3855 fading away. The TRIX has already crossed down, with the fast line (1.20) under the slow one (2.29). The stochastics describe the moment precisely, because the Stoch 89 remains high (83.86) while the Stoch 5 has collapsed to 28.13, meaning a larger frame still loaded and a short term already purged. The weekly A/D has turned, with the fast line (77.93) below the slow one (83.72), although still at high accumulation levels. The picture is that of a correction that started from the top and has not reached the support that matters yet.
SMH tracks the semiconductor sector through the companies that design and manufacture the chips underpinning artificial intelligence infrastructure, with heavy concentration in the biggest names of the industry. That concentration explains both the 138% rise of the last fourteen months and the violence of the current cut. A sector that prices years of growth in advance needs every quarter to confirm the expectation, and any doubt about the pace of data centre investment is paid here before anywhere else. What this week's data says is that the market is not fleeing risk but reordering where it takes it, because the equal weight S&P prints highs while the chips correct. For the technical thesis what matters is whether that rotation stops at the first structural support or drags the sector down to the long averages.
Key levels:
- Immediate resistance: 581 (daily EMA 50)
- Intermediate resistance: 594-602 (daily EMAs 9 and 20)
- Major resistance: 634-640 (July ceiling)
- All-time high: 671.83 (trend reference)
- Immediate support: 564 (low of the month)
- Intermediate support: 548 (monthly EMA 5)
- Structural support: 530-535 (daily EMA 100 and weekly EMA 20)
- Primary support: 492 (monthly EMA 9)
Setup Rating — 3/5 ⭐⭐⭐⭒⭒ (Healthy correction inside a larger trend still intact, but with no floor signal yet and short and medium-term flow already turned to distribution)
✅ Positive factors:
- Monthly structure intact, with price above the entire moving average stack
- Monthly A/D in high accumulation, with the fast line still above the slow one
- Cushion close to 6% over the weekly EMA 20, the average that has held the trend
- Support confluence at 530-535, with the daily EMA 100 and the weekly EMA 20 together
- Weekly Stoch 5 already purged (28.13) after months of extreme readings
- Daily RSI 2 in oversold (13.23), common around technical reaction zones
⚠️ Cautions:
- Daily and weekly A/D turned, with the fast line below the slow one on both frames
- Rising volume on every leg of the fall, typical of orderly distribution
- Extreme monthly overbought, with all four stochastics above 85
- Close below the whole block of short daily averages, still without a reaction
👍 As long as the 530 to 535 zone holds on closes, the fall remains a purge of the monthly overbought inside a larger trend that is still alive. Reclaiming the daily EMA 50 (581) would be the first sign that selling pressure is easing, and above 602 the sector would have the block of short averages back in its favour, with the July ceiling between 634 and 640 as the next reference. A lateral consolidation of several weeks between 548 and 602 that cools the monthly frame without losing the structural support would be the healthiest outcome for the trend.
👎 Losing 530 on a weekly close would break the confluence of the daily EMA 100 with the weekly EMA 20 and leave the sector without references down to the 492 of the monthly EMA 9. In that scenario the rotation would stop being a sector matter and become a problem of market leadership, and the question would be whether the rest of the sectors hold the indices up or end up following the chips. It would not be an invalidation of the larger trend, which would need to lose the weekly EMA 20 in a sustained way, but it would force us to call the vertical phase over and count on months of base building.
Which sector do you think the money leaving the chips is rotating into? 👇
ITA : iShares U.S. Aerospace & Defense ETF IdeaThe defense sector has been in a steady structural advance for years, and price is now resting inside a zone of interest formed at the highs. Above it, three institutional areas sit stacked like floors of a building that has not been visited yet. Below, two support zones wait in silence, one shallow, one deep.
Scenario 1: the current zone holds. Price consolidates, builds energy, and begins the staircase climb, reacting at each overhead area, pulling back, and continuing. Trend continuation in its purest form.
Scenario 2: the zone fails first. Price rotates down into the shallow support area, the kind of reset long-term trends use to shake out weak hands before the real move.
Scenario 2a: from that reset, demand steps back in and the staircase resumes, this time with cleaner fuel underneath it.
Scenario 3: the shallow zone breaks. Then the deeper area becomes the destination, and the structural conversation changes entirely.
On a quarterly chart, patience is not a virtue. It is the entire strategy. The zones are drawn.
The path will reveal itself one candle at a time, and each candle takes three months.
Hidden in plain sight. EQC.
Like, Follow, Boost, Join, Thank You!
Financial Disclaimer: This post is not financial advice. I am not your financial advisor, your life coach, or your legally responsible adult. Always do your own research and never trade based solely on internet comedy. SPY Is Sliding Toward 740.44, Its Own Line In The Sand.SPY Is Sliding Toward 740.44, Its Own Line In The Sand.
SPY rejected 755.66 for a third time and has been sliding since, closing near 750 and softening in premarket toward 745, heading for the 740.44 shakeout-versus-turn line. The structure is split: the daily is still bull with a 232-bar bull print standing, but the hourly has flipped to bear and is extended to the downside. This is the same 740.44 flagged all week - the level that separates a healthy shakeout inside the uptrend from a real turn. This is the one name where a break carries an edge, so a decisive reaction at 740.44 in either direction is the event. Neutral.
Resistance: 748.00 - first level to reclaim
Key resistance: 751.00 - then the 755.66 ceiling
Current price: 745 (premarket)
Support: 740.44 - the shakeout-vs-turn line
Key support: 739.34 - the prior swept low
Structural floor: 736.50-736.87 - deeper support
Two paths from here:
740.44 holds and the daily bull reasserts. With a 232-bar bull print still standing, a bounce off 740.44 that reclaims 748 says the pullback was a shakeout inside the uptrend and the ceiling comes back into view. This is where a long lean would set up if it confirms.
740.44 breaks and the daily rolls over. A decisive loss of 740.44 would be the first real crack in the daily bull structure, opening 736 and below. That flips the leanable setup to the short side.
Three rejections at the ceiling have SPY testing the floor of its two-week range. 740.44 is the line: a bounce that reclaims 748 keeps the daily bull alive, a close below 740.44 is the first genuine break of it. Watching the reaction, not front-running it.
Built with SYNTHESIS v3.3 | SOM / ACE / IMP / SYNTHESIS
Study, not financial advice.