Research 03.11.2026🌏 Markets:
AMEX:SPY -1.10 -0.15%(pre/m)
NASDAQ:QQQ +1.92 +0.28%(pre/m)
🆕 Economic News:
Wall St futures mixed on US midterm election day as Apple and Palantir fall after earnings and oil rebounds on US-Iran tensions
10:00 USA – JOLTs Job Openings
10:00 USA – Factory Orders
14:00 USA – Total Vehicle Sales
Earnings before the open: NYSE:SYY , NYSE:DD , NYSE:SU , NYSE:APO
Earnings after the close: NASDAQ:AMD , NASDAQ:AMGN , NYSE:ANET , NASDAQ:BKNG , NYSE:XYZ , NYSE:AI
ETF market
SPY Has Closed Under 758.68 Twice.Last read: Neither path fired - SPY closed Monday at 752.10, between 750.36 and 758.68, after a rally to 763.86 faded; it was the second straight close under the October 23 low, and Friday's 756.15 target traded again while 749.60 still has not.
SPY Has Closed Under 758.68 Twice.
SPY is at 751.30 before the open, a little under Monday's 752.10 close and resting on Friday's 750.36 low, which it dipped six cents under in premarket. Monday's rally reached 763.86 - above 758.68 and within 0.10 of
TQQQ: Setting Up To Bounce?Sure it is ladies and gentlemen, TQQQ is about to complete its 4hrs and Daily TFs Bearish Cycles in a couple of trading sessions more and a new Bullish cycle will start to go and fill the gap down printed a couple a days ago, so get those Long bets ready to fire.
Play it right.....................Play it safe......................Play it The Numberfive Way.
Boost.......................Follow........................Share..................Comment.
IWM: Partial Inverse Head And Shoulders PatternThe iShares Russell 2000 ETF (IWM) closed its most recent trading session at $279.14, down a marginal 0.07%. This follows a broader multi week technical consolidation where small caps pulled back roughly 5.6% over the past month due to climbing Treasury yields and hawkish Federal Reserve expectations.
Technical outlook:
IWM is fluctuating on a sell momentum. The ETF has been trending on a downward pathway of lower lows and highs, in regard to the structure. Presently, we can spot a formation I
$SPY & $SPX — Levels for Tuesday, November 3, 2026🔮 AMEX:SPY & SP:SPX — Levels for Tuesday, November 3, 2026
📊 Key U.S. Economic Data (ET)
10:00 AM | JOLTS Job Openings | Forecast: 7.15M | Previous: 7.08M
All Day | Congressional Elections
⚠️ For informational purposes only. Not financial advice.
📌 #JOLTS #Employment #Elections #SPY #SPX
QQQ / POSSIBLE SUBWAVE 2 OF WAVE 3 PLAYING OUT / VIX BOUNCENot financial advice or a recommendation.
QQQ retested the overhead gap this morning.
I am watching to see if this Subwave 2 gets an ABC up, or simply falls at the gap retest.
If so, perhaps we fill the gap at another time.
The VIX bouncing off its previous wedge's upper rail could indicate the end of Subwave 2.
Not guaranteed to run here, but something to watch as I hold my short.
Be careful out there.
Could we have seen this coming?SPY + VIX: Preparing for a Potential Selloff
The conditions marked on this chart could have helped traders prepare for downside, even without knowing the exact timing or size of the move.
• SPY was forming lower highs: Rallies were failing below previous peaks, showing weakening price structure.
• SPY’s bearish 8/21 EMA cross on October 22: This added evidence of weakening short-term momentum.
• VIX was strengthening: Its bullish 8/21 EMA cross on October 14, followed by higher lows, provide
Two pays on Nov 2: QQQ TREND, AVGO BounceThe morning board called it chop: Friday's flush, a pre-market bounce that had already faded, and every overnight cross spent. The plan was narrow — fresh dip, fresh cross, no chasing. Two entries fit it. Four names were stood aside on the rules, and one of those passes became the day's best lesson.
QQQ — TREND, traded (+100%)
The print came at the morning flush low, 694.05 (day low 693.93), with the cross confirming out of the cool-down. The Nov02 697c paid +100% as QQQ ran into the 699–700 su
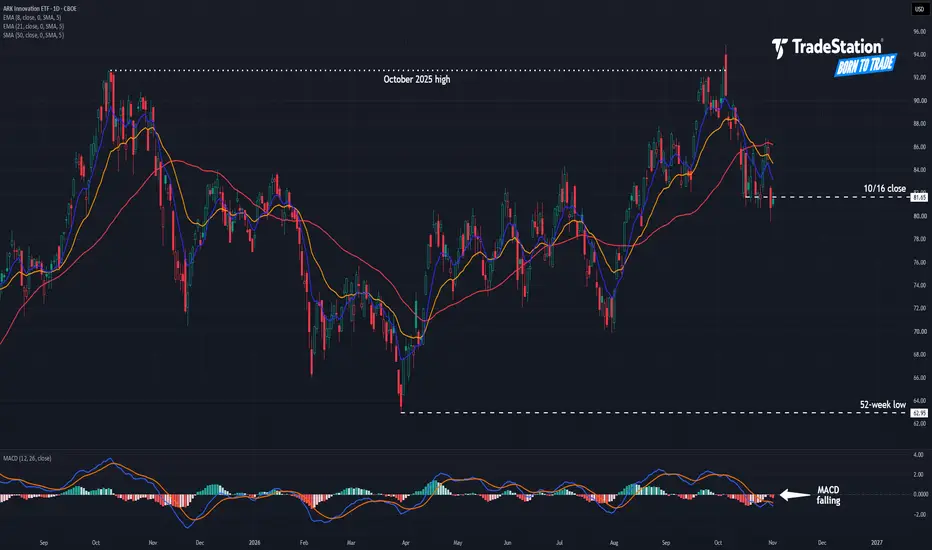
ARK Innovation: Is Support Breaking?The ARK Innovation ETF rallied sharply in August and September, but now it could be going the other way.
The first pattern on today’s chart is the October 2025 high of $92.65. The fund tried unsuccessfully to cross that level early last month. It quickly dropped from the high, potentially confirming a bearish reversal.
Second, ARKK had a weekly close at $81.65 on October 16. It probed below that level several times in the following sessions while managing to close above. However, it decisively
QQQM — HoldQQQM (QQQM) — Hold 45/100
Positive analyst ratings and a draft average target of $330.28 imply 16.16% upside, but weak momentum and incomplete financial data limit conviction. At the 2026-11-01 close of $284.34, price remains below its shorter-term moving averages while holding above the SMA200: support is intact, but a recovery is unconfirmed.
WHY
- TipRanks StrongBuy and Zacks Rank 1 support the bullish case, but the Zacks scale is unexplained and the source targets do not establish a consis
SOXL ▼ SHORT · Fade the bounce 81.5 / 84 → 76▸ WHY: semis got flushed Friday - SOXL -25%, INTC had its worst day in 40+ years, big tech dragged everything. this morning's pop is a bounce with no news behind it. I'd rather sell it than buy it
▸ LEVELS: 84 Friday high · 77.05 Friday close · 70.2 Friday low
▸ PLAN A: starting short around 81.5 premarket, adding 84 if it squeezes into Friday's high
▸ PLAN B: if it rolls over under VWAP after the open, 77 comes first
🎯 TARGET 76 ✕ STOP 87
⚠ RISKS: ISM at 10:00. 3x ETF - moves fast both way
$MID & $IWM: Rotation Breadth Quietly Building. TINA, That You?While mega cap tech continues to struggle under heavy distribution, small and mid caps are telling a very different story on the daily chart. TINA, that you?
The S&P MidCap 400 index:
SP:MID on the left has carved out a solid base over the past several weeks. Notice the volume signature during this consolidation: sell volume drying up, and price is comfortably holding above local structural support while short term moving averages begin to flatten and curl. When price stops going down on decl
$SOXX: Don't Let The 4 PM Spike Fool YouBroader Downtrend Picture
Semis remain locked inside a clear, broad macro downtrend. Extending the descending trendlines out from the summer highs shows the structural reality: textbook lower highs and lower lows across the board.
Heavy Distribution
June and July marked heavy distribution. While the tape has seen some light spot buying recently, sustained sell volume continues to control the tape. Over the past two weeks, the most aggressive, wide range volume bars have landed strictly on the
Research 02.11.2026🌏 Markets:
AMEX:SPY +2.78 +0.37%(pre/m)
NASDAQ:QQQ +4.50 +0.65%(pre/m)
🆕 Economic News:
Wall St futures rise as oil slumps on signs Trump may give Iran diplomacy more time and tech rebounds after October's AI-led selloff; Marvell agrees to buy Lumentum
10:00 USA – ISM Manufacturing PMI
10:00 USA – Construction Spending
11:15 USA – Fed Goolsbee Speech
15:00 USA – Treasury Refunding Financing Estimates
Earnings before the open: NYSE:PEG , NYSE:CNA
Earnings after the close:
The Catch-22 and Where We Are HeadingLast week was a wild week in the market. Several big companies reported and in between them GOOG, AMZN, and INTC managed scaring the market. On the previous market dip, there was an outflow from QQQ but that it should have been seen as an opportunity to load up. Purely from a technical analysis perspective, it can be concluded that we experienced a correction dip by the end of July. It proved to be the right call to suggest to invest. For those who bought the dip, the bounce was for more th
QQQ ▼ SHORT · Lost 700 · 697 / 700 / 703 → 690 / 685 / 680▸ WHY: AMZN missed and is burning cash on capex, INTC guided Q4 way under the street and says the PC slump runs into 2027. chips got dumped in Asia overnight and QQQ is gapping -2.4% under 700. on the daily 700 held 4 times since July - now it's gone, and that floor should act as a ceiling
▸ LEVELS: 715.34 yesterday's close · 700 heavy puts / daily floor (lost) · 686.76 Jul 17 low · 661.14 Jul 29 low
▸ PLAN: I'm scaling in, not going all in at once
- tier 1: short here, ~697 premarket
- tier 2
QQQ Lost 700. Week Ahead: 680 or Reclaim?What happened
Big tech earnings week and the market didn't like it. QQQ lost 700 on Friday, flushed to 683.45 and closed 690.79. SPY held 750 and closed 755.82. Semis got hit hardest after Intel cut its guide. Oil added about 15% in October on Iran war fears - WTI is back near $100 this morning as talks with Qatar's mediators continue. Bounces into resistance got sold all week, breakouts kept failing.
Levels that matter
QQQ: 700-704 was support, now it's resistance. Below - 680-683, the late Ju
XEG: The Next Buying Opportunity Could Be LowerXEG has had an impressive run, but buying right below resistance might not be the best move.
The Canadian energy ETF is now trading around $31.52, just below a key resistance level at $31.59.
After such a strong rally, I wouldn't be surprised to see a pullback before the next move higher.
Here's what I'm watching.
🔵 Scenario 1: A Pullback to $27.42
If XEG starts losing momentum around $31.59, the first area I'm watching is $27.42.
This level has played an important role in previous pric
QQQ: Fear spiked again. Dip or sell-off? (backtest since 2000)QQQ fell 3.5% on Friday to 690.49, about 9% below its Oct 6 closing high. My free Market Fear Meter printed a new FEAR SPIKE, the fourth one this month. VIX closed at 19.42.
The question everyone is asking: is this a dip, or the start of something bigger? I don't know, and nobody does. But I can show what my rules say right now and what history says about this setup.
The reading (Friday close)
My free Risk-Off Ladder tracks 3 warnings and steps aside only when 2 are on:
1. VIX in its top 20% o