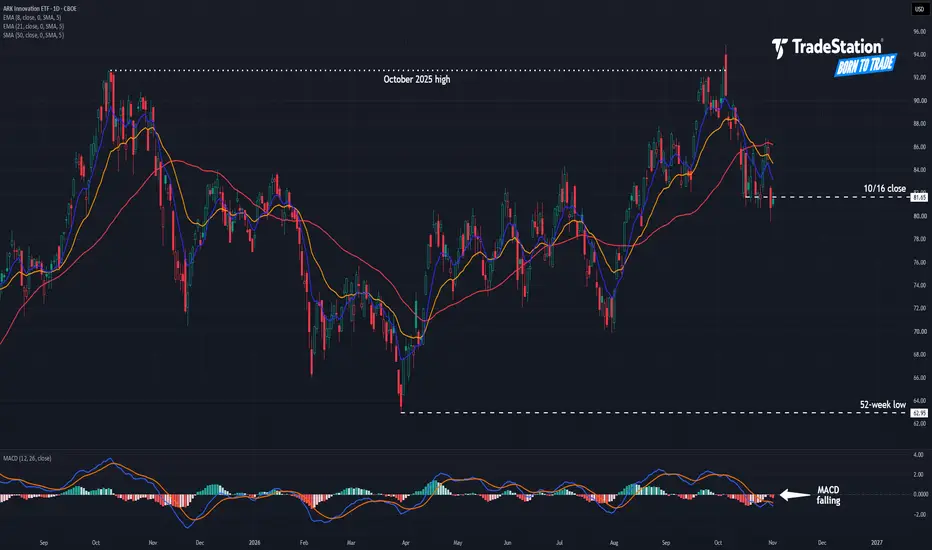
ARK Innovation: Is Support Breaking?The ARK Innovation ETF rallied sharply in August and September, but now it could be going the other way.
The first pattern on today’s chart is the October 2025 high of $92.65. The fund tried unsuccessfully to cross that level early last month. It quickly dropped from the high, potentially confirming a bearish reversal.
Second, ARKK had a weekly close at $81.65 on October 16. It probed below that level several times in the following sessions while managing to close above. However, it decisively
ETF market
QQQM — HoldQQQM (QQQM) — Hold 45/100
Positive analyst ratings and a draft average target of $330.28 imply 16.16% upside, but weak momentum and incomplete financial data limit conviction. At the 2026-11-01 close of $284.34, price remains below its shorter-term moving averages while holding above the SMA200: support is intact, but a recovery is unconfirmed.
WHY
- TipRanks StrongBuy and Zacks Rank 1 support the bullish case, but the Zacks scale is unexplained and the source targets do not establish a consis
SOXL ▼ SHORT · Fade the bounce 81.5 / 84 → 76▸ WHY: semis got flushed Friday - SOXL -25%, INTC had its worst day in 40+ years, big tech dragged everything. this morning's pop is a bounce with no news behind it. I'd rather sell it than buy it
▸ LEVELS: 84 Friday high · 77.05 Friday close · 70.2 Friday low
▸ PLAN A: starting short around 81.5 premarket, adding 84 if it squeezes into Friday's high
▸ PLAN B: if it rolls over under VWAP after the open, 77 comes first
🎯 TARGET 76 ✕ STOP 87
⚠ RISKS: ISM at 10:00. 3x ETF - moves fast both way
$MID & $IWM: Rotation Breadth Quietly Building. TINA, That You?While mega cap tech continues to struggle under heavy distribution, small and mid caps are telling a very different story on the daily chart. TINA, that you?
The S&P MidCap 400 index:
SP:MID on the left has carved out a solid base over the past several weeks. Notice the volume signature during this consolidation: sell volume drying up, and price is comfortably holding above local structural support while short term moving averages begin to flatten and curl. When price stops going down on decl
$SOXX: Don't Let The 4 PM Spike Fool YouBroader Downtrend Picture
Semis remain locked inside a clear, broad macro downtrend. Extending the descending trendlines out from the summer highs shows the structural reality: textbook lower highs and lower lows across the board.
Heavy Distribution
June and July marked heavy distribution. While the tape has seen some light spot buying recently, sustained sell volume continues to control the tape. Over the past two weeks, the most aggressive, wide range volume bars have landed strictly on the
Research 02.11.2026🌏 Markets:
AMEX:SPY +2.78 +0.37%(pre/m)
NASDAQ:QQQ +4.50 +0.65%(pre/m)
🆕 Economic News:
Wall St futures rise as oil slumps on signs Trump may give Iran diplomacy more time and tech rebounds after October's AI-led selloff; Marvell agrees to buy Lumentum
10:00 USA – ISM Manufacturing PMI
10:00 USA – Construction Spending
11:15 USA – Fed Goolsbee Speech
15:00 USA – Treasury Refunding Financing Estimates
Earnings before the open: NYSE:PEG , NYSE:CNA
Earnings after the close:
The Catch-22 and Where We Are HeadingLast week was a wild week in the market. Several big companies reported and in between them GOOG, AMZN, and INTC managed scaring the market. On the previous market dip, there was an outflow from QQQ but that it should have been seen as an opportunity to load up. Purely from a technical analysis perspective, it can be concluded that we experienced a correction dip by the end of July. It proved to be the right call to suggest to invest. For those who bought the dip, the bounce was for more th
QQQ ▼ SHORT · Lost 700 · 697 / 700 / 703 → 690 / 685 / 680▸ WHY: AMZN missed and is burning cash on capex, INTC guided Q4 way under the street and says the PC slump runs into 2027. chips got dumped in Asia overnight and QQQ is gapping -2.4% under 700. on the daily 700 held 4 times since July - now it's gone, and that floor should act as a ceiling
▸ LEVELS: 715.34 yesterday's close · 700 heavy puts / daily floor (lost) · 686.76 Jul 17 low · 661.14 Jul 29 low
▸ PLAN: I'm scaling in, not going all in at once
- tier 1: short here, ~697 premarket
- tier 2
QQQ Lost 700. Week Ahead: 680 or Reclaim?What happened
Big tech earnings week and the market didn't like it. QQQ lost 700 on Friday, flushed to 683.45 and closed 690.79. SPY held 750 and closed 755.82. Semis got hit hardest after Intel cut its guide. Oil added about 15% in October on Iran war fears - WTI is back near $100 this morning as talks with Qatar's mediators continue. Bounces into resistance got sold all week, breakouts kept failing.
Levels that matter
QQQ: 700-704 was support, now it's resistance. Below - 680-683, the late Ju
XEG: The Next Buying Opportunity Could Be LowerXEG has had an impressive run, but buying right below resistance might not be the best move.
The Canadian energy ETF is now trading around $31.52, just below a key resistance level at $31.59.
After such a strong rally, I wouldn't be surprised to see a pullback before the next move higher.
Here's what I'm watching.
🔵 Scenario 1: A Pullback to $27.42
If XEG starts losing momentum around $31.59, the first area I'm watching is $27.42.
This level has played an important role in previous pric
QQQ: Fear spiked again. Dip or sell-off? (backtest since 2000)QQQ fell 3.5% on Friday to 690.49, about 9% below its Oct 6 closing high. My free Market Fear Meter printed a new FEAR SPIKE, the fourth one this month. VIX closed at 19.42.
The question everyone is asking: is this a dip, or the start of something bigger? I don't know, and nobody does. But I can show what my rules say right now and what history says about this setup.
The reading (Friday close)
My free Risk-Off Ladder tracks 3 warnings and steps aside only when 2 are on:
1. VIX in its top 20% o
SPY Weekly Outlook | November 2–6, 2026Can SPY Reclaim 760, or Will 750 Face Another Test?
SPY is recovering from 750.36, but the daily chart remains under pressure. I’m watching 760–761 as the first decision area, with 765–767 as the bigger recovery test.
Catalysts
This week brings economic releases and election headlines. All times below are Pacific:
• Monday: ISM Manufacturing at 7:00 a.m.
• Tuesday: JOLTS job openings at 7:00 a.m.
• Wednesday: ISM Services at 7:00 a.m.
• Thursday: Productivity and labor costs at 5:30 a.m.
• F
Sunday Night Market Prep - Nov 1 2026All right, we’ve got a new month, an election, and plenty of opportunities for the market to keep us on our toes.
In Notable November, I discussed the potential for a recovery following the election. That’s still where I’m leaning as we head into this week: green first, yellow second, red last. I wouldn’t rule out plenty of sideways chop and indecision before we get a convincing move.
Futures opened roughly 0.2% higher this evening, so we’re starting with a little optimism. Let’s see whether t
XLE/XLB, two weeks: energy over materials. Graded Nov 13Two-week call, opened at Friday's close (Oct 30): the XLE/XLB ratio closes above 1.3276 on Nov 13. That number is not a technical level; it is where the ratio sat when the call went out (XLE 70.02, XLB 52.74).
Why: the model I keep the ledger for scores the 11 sectors every night. At the Oct 30 close it scored energy highest (+26; technology next at +23) and materials lowest (−18; financials −17, close to a tie). XLE and XLB are the nearest funds, not the same baskets: the model's sectors cover
SLV - a Comprehensive Institutional Analysis...my 4-Point Structural Analysis requires remaining on the sidelines until terminal liquidity harvest
Complex WXYXZ Correction:
Current price Action in AMEX:SLV is setting up the drop sequence toward Wave ((Z)). This complex Triple Combination / WXYXZ correction aligns directly with textbook Elliott Wave mechanics for deep commodity retracements.
Sub-wave Motive Alignment inside Wave (C) of ((Z)):
Price is completing Sub-wave 3 at the 52-Week Low / 200-Week EMA shelf. The current low-volu
QQQ: Long Signal with Entry/SL/TP
QQQ
- Classic bullish pattern
- Our team expects retracement
SUGGESTED TRADE:
Swing Trade
Buy QQQ
Entry -690.75
Stop -683.43
Take - 703.58
Our Risk - 1%
Start protection of your profits from lower levels
Disclosure: I am part of Trade Nation's Influencer program and receive a monthly fee for using their TradingView charts in my analysis.
❤️ Please, support our work with like & comment! ❤️
SPY Will Explode! BUY!
My dear subscribers,
SPY looks like it will make a good move, and here are the details:
The market is trading on 755.69 pivot level.
Bias - Bullish
Technical Indicators: Both Super Trend & Pivot HL indicate a highly probable Bullish continuation.
Target - 763.80
About Used Indicators:
The average true range (ATR) plays an important role in 'Supertrend' as the indicator uses ATR to calculate its value. The ATR indicator signals the degree of price volatility.
Disclosure: I am part of Tr
IWM: A Conditional Year-End RotationIWM is approaching a key test. Friday’s low came close to my $275.87 support area, and price finished above it at $279.33. I’ll watch the next couple of weeks to see whether buyers keep defending that zone, form a higher low, and build value above it. I also want to see IWM strengthen against SPY and participation improve across small caps; a bounce in IWM by itself would not be enough to confirm a broader rotation.
If those conditions develop, the next major test on my chart is $300.22. Accept
Notable November: Election Rebound or the Bears Take Control?October ended with sellers in control, leaving SPY near the bottom of the broader range we’ve been watching since August. November now presents an important test: can buyers defend that range and build a recovery, or will the late-October selling develop into a more meaningful breakdown?
SPY closed the regular session at $755.72 and continued trading around $757 after hours, which is reflected on my 4 hour chart. The broader boundaries remain approximately $750–$752 below and $783–$784 above. D