Long
Long
 Long
Long
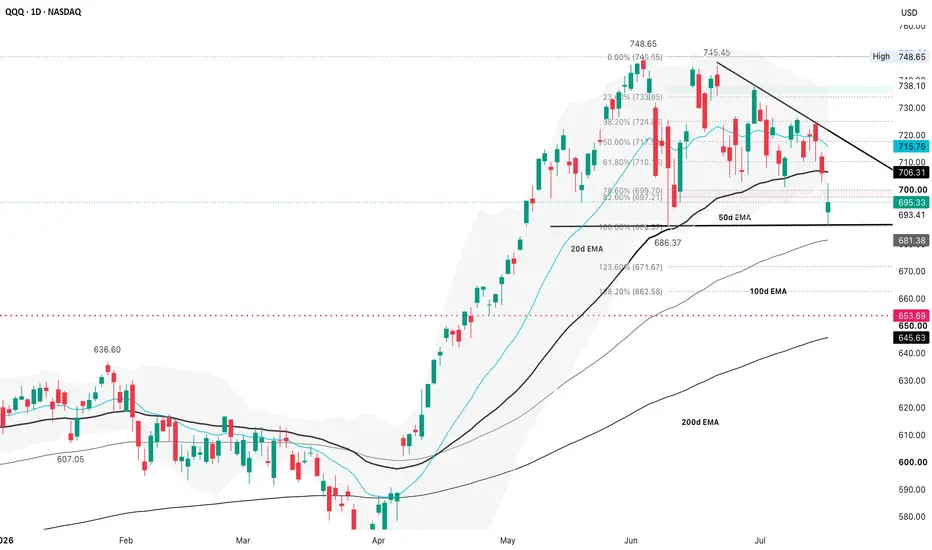
QQQ Elliott Wave Signals Double Correction Toward 684The short‑term Elliott Wave view on the Nasdaq 100 ETF (QQQ) shows that the instrument is correcting the cycle from the March 30, 2026 low. The decline from the June 3, 2026 all‑time high continues, with the extreme target zone defined by the 100%–161.8% Fibonacci extension. This area lies between $646 and $684 and represents the next logical support cluster within the ongoing correction.
From the June 16 high, the cycle has unfolded as a double three structure. Wave (w) ended at $697.86, followed by a counter‑trend rally in wave (x) that peaked at $726.40. The ETF then resumed lower in wave (y), which subdivides into another double three, highlighting the complexity of the correction.
Within wave (y), the decline from wave (x) produced wave w at $686.76. The subsequent rally in wave x ended at $705.80. The ETF has since turned lower again. A break beneath $686.76 is required to confirm that the correction is extending as a double sequence. Until then, the possibility of a more complex consolidation remains.
Near term, the pivot at $737.72 is critical. As long as this high remains intact, rallies are expected to fail in either three or seven swings. This reinforces the downside bias and favors continuation lower toward the $684 area, consistent with the projected Fibonacci extension zone.  Long
Long
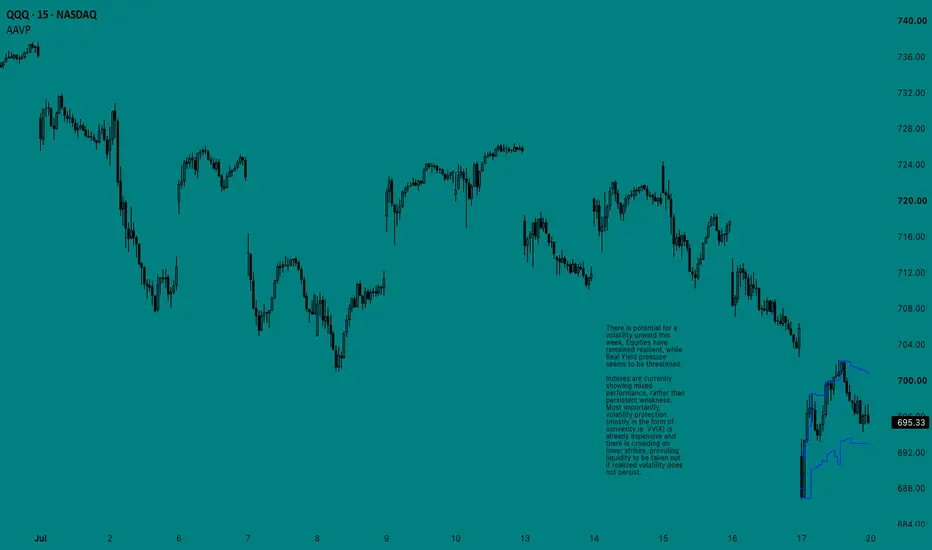
Fed blackout; AI-capex cluster, tariff sunset 7/24Four dated events inside five days carry the tape into the July 28-29 FOMC and the Fed is in blackout the whole week. USTR Section 301 determinations on Monday 7/20 (weakly sourced date, verify). The midweek after-close earnings cluster (TSLA, TXN, NOW and IBM's formal print Tuesday, GOOGL the Wednesday marquee) is the first live test of the AI-capex top read that fired on 7/17 across the semis and hyperscaler shorts.
The SOX closed the week -12.5% and over 20% off its late-June high, bear-market territory, after China's Moonshot open model. Section 122 sunsets 00:01 ET Friday 7/24, taking the US effective tariff rate from about 11% to about 8.2% absent a Congressional extension (no extension bill pending). Friday 9:45 the Flash PMIs land, composite consensus ~51.9 (July), June manufacturing 55.7 and services 51.3. Composite over 50 keeps the growth crack un-tripped and the higher-for-longer, no-cut regime intact.
On Saturday I posted the QQQ weekly-top call: QQQ closed the week -4.16% at 695.33, back under the first Warsh FOMC key level 731.62 (my median of the event range, the price that bakes in expectations plus reaction plus digested positioning around the regime-reset FOMC). Weekly signal projects five downside targets stacking to 468. Structure rhymes with the January 2022 top. Invalidation is a weekly close over 731.62. SPY closed under its Warsh line 745.41 too, so the AI-capex re-rate is broader than one index.
Energy stays the receipt: Brent through $90 on the Monday reopen on an open US-Iran shooting war around the Strait; gasoline long half booked and a runner on (products over crude); NWE diesel crack a record ~$60-66 on Russia's producer-inclusive export ban. Signals scorecard: BULL 4 / BEAR 3 / NEUTRAL 11, two factors past kill lines (P/E 26.7x over 25, Junk Spreads 2.71 under 3.0). VIX 18.4 is sub-20 into the tariff binary and the AI-capex cluster; own cheap optionality over the directional bet.
Best of luck!
Cheers,
Ivan Labrie. Short 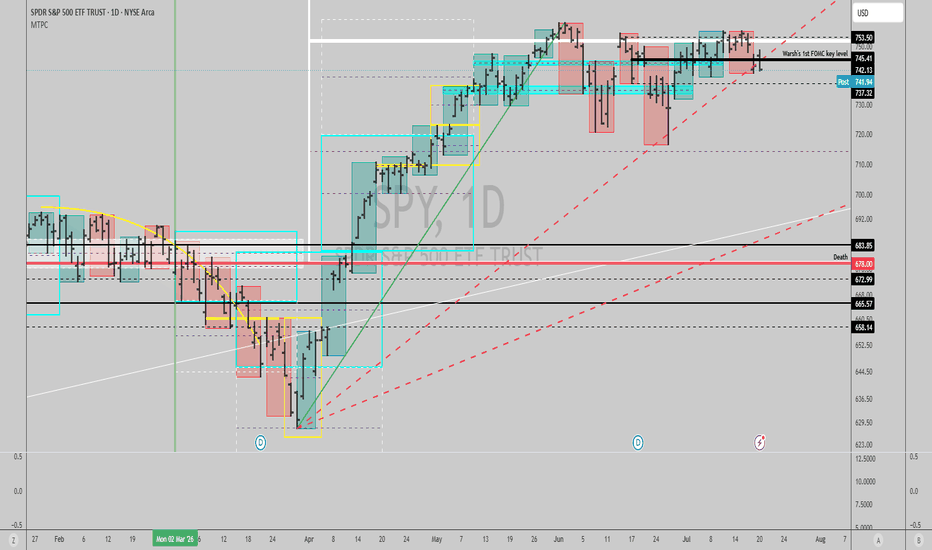
BITO - Forecasting a Huge Move SoonOne really important BTC ETF chart I want to lay out is BITO, ProShares 1x Bitcoin ETF. This ETF remains highly traded for short term tactical positioning, which is exactly why it is worth analyzing right now.
It appears active market participants are expecting a significant move for Bitcoin very soon, and that is showing up clearly in how they are positioning within this ETF.
You can see this through the rapidly increasing volume. For most of its life, BITO traded well under 100 million shares per week. Toward the end of 2025 that began ramping up above 100 million shares per week, and volume has since accelerated even further.
Last week, BITO recorded total volume of just under 2 billion shares! What makes this particularly notable is not just the size of the number, but the pattern behind it. Volume increased every single day that week without exception.
Monday, July 13: 277,275,900 shares
Tuesday, July 14: 407,703,000 shares
Wednesday, July 15: 496,250,000 shares
Thursday, July 16: 553,007,500 shares
Friday, July 17: 633,367,473 shares
Volume more than doubled from Monday to Friday alone, with each day building on the last.
This surge is likely tied directly to the speculation around a significant low being formed at $57,800 for Bitcoin. I want to outline a few of my recent ideas that support what BITO is currently signaling through this volume surge.
First, I outlined ProShares' 2x leveraged ETF market structure a couple weeks ago. That idea can be found here:
Even in that idea I noted slightly increasing volume at the time, but nowhere near what is currently being seen on BITO.
I also previously pointed out that IBIT's low was likely in. It may not yet be the full bear market low, but it has acted as a significant pivot low so far and should continue to hold that role for some time. Review that idea here:
For the broader BTC analysis supporting this thesis, view these ideas:
SPY Is One Point From The Level That Opens The Lean.SPY Is One Point From The Level That Opens The Lean.
SPY held 740.44 exactly as flagged and has bounced to 747.16 - one point under the 748 reclaim named on Friday as the trigger. The setup underneath has firmed considerably: conviction is top-quartile, the thesis is a long, structure is bull transitional, and the entry signal is forming. This is the one instrument where a confirmed break carries a real edge, and this is the closest the setup has come to actually triggering. It has not triggered yet. 748 is a reclaim on a close, not a poke. Neutral until it clears.
Resistance: 748.00 - the trigger level
Key resistance: 751.00, then the 755.66 ceiling
Current price: 747.16
Support: 745.00 - first support
Key support: 740.44 - the line that held
Structural floor: 739.34 - the swept low
Two paths from here:
748 clears and the long setup triggers. A confirmed reclaim with conviction already top-quartile completes the shakeout off 740.44 and puts 751 and the 755.66 ceiling back in play. This is the setup we have been waiting on for two weeks - and it needs the close, not the touch.
It stalls under 748 and retests the floor. Failing one point short of the trigger, with the ceiling untested and volatility extended, sends it back toward 745 and then 740.44. A second test of that floor would be weaker than the first.
SPY did everything asked of it - held the line, bounced, built the setup. It is now one point from the trigger. A confirmed reclaim of 748 is the first genuinely leanable event in two weeks. Short of that, it stays Neutral.
Built with SYNTHESIS v3.3 | SOM / ACE / IMP / SYNTHESIS
Study, not financial advice. Research 20.07.2026🌏 Markets:
AMEX:SPY +3.74 +0.50%(pre/m)
NASDAQ:QQQ +7.55 +1.09%(pre/m)
🆕 Economic News:
10:00 USA – Leading Index (June)
📈 Gap Ups
Reaction to earnings/guidance:
NASDAQ:DPZ NYSE:DX NYSE:AMC
Other news:
NASDAQ:HUT signs $9.8 billion AI data center lease, fully commercializes Texas campus
NYSE:ACHR and Anduril unveil autonomous aircraft platform for defense, commercial markets
NASDAQ:IREN Signs $2.8bn in New Customer Contracts with Leading AI Developers, Raises 2026 ARR Target to over $4bn
NYSE:BABA unveiled a preview version of its flagship Large Language Model (LLM) Qwen3.8 Max.
-- The announcement comes shortly after Chinese AI startup Moonshot AI unveiled Kimi K3, a 2.8-trillion-parameter AI model last week that it said could go head-to-head with leading U.S. AI systems.
-- According to Bloomberg, those specifications require far more memory capacity than earlier model generations
-- Memory stocks gain on new AI models launch momentu: NASDAQ:SKHY NASDAQ:SNDK NASDAQ:MU NASDAQ:WDC
-- Chinese stocks gain on AI momentum: NASDAQ:BIDU NASDAQ:JD
Brookfield and CPP Investments to Buy NYSE:LXP for $5.2 Billion in an all-cash deal
UBS projects the space economy’s TAM at $1.3TN by 2040 : NASDAQ:SPCX NASDAQ:RKLB NASDAQ:ASTS NASDAQ:LUNR
NASDAQ:ESLT Awarded Contracts from U.S. Customs and Border Protection Totaling Over $370 Million to Enhance U.S. National Security
NYSE:TSM sees long-term AI chip demand as Arizona investment expands to $265 billion
📉 Gap Downs
Reaction to earnings/guidance:
NASDAQ:RYAAY NYSE:HDB
Other news:
NASDAQ:GVH Signs Global Distribution Agreement with DramaBox, Expanding Commercial Distribution to Platform with Over 90 Million Registered Users
NYSE:BURL falling after hitting ATH on friday
‼️ Additional
Mediators have proposed a 10-day ceasefire in order to find ways to revive the temporary agreement between Iran and the US.
-- Mediators are proposing that Iran and the US return to the position that existed before July 9 — ISNA.
-- The US has carried out strikes against Iran for the ninth consecutive night. Iran continues to respond by striking US facilities in the region.
-- A major statement from the Houthis is expected today.
-- #Oil continues to rise: Brent > $90.
NASDAQ:SPCX said the next Starship test flight is scheduled for July 23.
Oracle’s NYSE:ORCL 5-year CDS, the cost of insuring against default on its debt, has hit a record high.
-- Concerns are growing over both the company’s aggressive cash spending and the future profitability of its AI investments, amid the release of Moonshot AI’s new Chinese AI model Kimi K3, which could compete with the largest US AI companies at a lower cost — BBG.
-- Last week, S&P Global Ratings downgraded Oracle to BBB-, just one notch above junk status.
🔁 Business Combination / SPAC Deal
NASDAQ:BXBL – BOXABL Inc.
Company develops modular building systems for affordable and fast-to-deploy housing. Its flagship product is the Casita, a 361-square-foot studio unit with kitchen, bathroom and utilities that can unfold on-site in under an hour. BOXABL also offers the smaller Baby Box and is developing stackable / connectable models for larger homes, townhomes and multifamily housing.
Trading Date: July 20, 2026
Key points:
Company has raised $230M+ from 50,000+ investors to date
Core thesis is affordable modular housing, faster construction and factory-built residential units
Main risk is execution: scaling manufacturing, permitting, customer adoption and housing-market cyclicality
Comparable public companies: SET:SKY , NASDAQ:CVCO , NYSE:BLDR , NYSE:IBP , NYSE:TOL , NYSE:LEN
📋 List of tickers involved:
NASDAQ:DPZ NYSE:DX NYSE:AMC NASDAQ:HUT NYSE:ACHR NASDAQ:IREN NYSE:BABA NASDAQ:SKHY NASDAQ:SNDK NASDAQ:MU NASDAQ:WDC NASDAQ:BIDU NASDAQ:JD NYSE:LXP NASDAQ:SPCX NASDAQ:RKLB NASDAQ:ASTS NASDAQ:LUNR NASDAQ:ESLT NYSE:TSM NASDAQ:RYAAY NYSE:HDB NASDAQ:GVH NYSE:BURL NYSE:ORCL NASDAQ:BXBL SET:SKY NASDAQ:CVCO NYSE:BLDR NYSE:IBP NYSE:TOL NYSE:LEN
Best regards – hi2morrow team.
SPY / SPX Weekly Outlook – Week 29 of 2026 (20-24 JUL)SPY / SPX WEEKLY MARKET OUTLOOK
UA CAPITAL RECAP 19.07 | WEEK 13–17 JUL
The execution throughout the week closely followed our published trading plans.
Monday and Tuesday, both SPY and QQQ Long Scenario 1 trades from the Weekly Market Outlook reached profitable outcomes.
Wednesday's updated Tactical Playbook generated new long opportunities in both SPY and QQQ, with both trades closing profitably.
No new trades were taken on Thursday.
Friday's Tactical Playbook successfully identified short opportunities in both SPY and QQQ. Both positions generated multiple partial profit targets and continue to hold small runner positions into next week.
Ahead of Tuesday's CPI release, we also opened VIX hedge positions on Monday afternoon and closed them Tuesday morning for approximately a 36% gain.
In total, seven options trades were executed throughout the week, and all seven finished as winners.
It was an exceptional week from both an execution and risk management perspective, resulting in a 100% winning record across every completed options trade.
(For reference, I have included last week's outlook on the right.)
Equities Play
Throughout the week we also continued building medium-term spot positions in selected companies through the UA CAPITAL Trading Desk.
To maintain disciplined risk management, new purchases were limited to only one-quarter of our available buying power, bringing our total deployed capital to approximately 50% of our intended allocation.
Our plan remains unchanged. We intend to continue gradually building these medium-term positions from attractive technical levels with an investment horizon extending into November and December 2026.
The specific names remain exclusive to the private Trading Desk, although our primary focus continues to be concentrated in the technology and semiconductor sectors.
This Week's Scenarios / Prediction
Risk Index
This oscillator reads macro conditions and converts them into a technical risk framework. It was developed internally at UA CAPITAL and remains the primary indicator I use for both short-term and long-term positioning decisions.
The Risk Index is currently signaling the potential for a short-term bounce. However, the broader short to medium-term environment continues to price in the possibility of another meaningful downside flush.
The long-term model remains firmly risk on, while the medium-term outlook continues to lean slightly bearish.
This combination typically creates elevated volatility, with both bulls and bears competing aggressively for control before a larger directional move eventually develops.
Given the potential for rapid acceleration in either direction and increasingly violent reversals, our focus this week will remain on aggressive profit-taking and disciplined risk management.
Scenarios / Strategies
Long Scenario 1
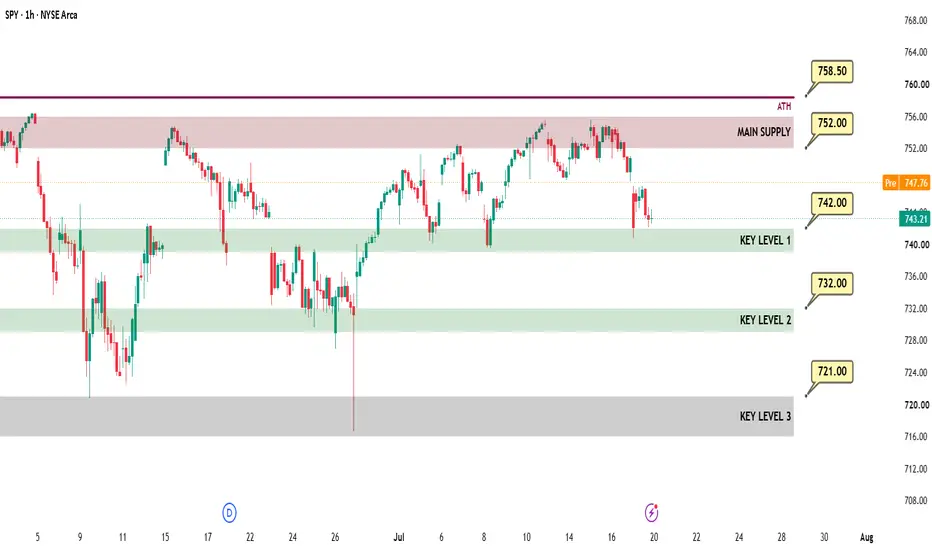
KEY Level 1 (742) This is the first major demand zone. If price reclaims this level with a confirmed 1-hour bullish candle close, long exposure can be considered.
Trigger: Price must test the level and produce a bullish 1-hour candle close back above the zone.
Targets: Take partial profits after every $1 advance.
Invalidation: 4-hour candle close below 739.
Long Scenario 2
KEY Level 2 (732)
This is the second major demand zone. If price reclaims this level with a confirmed 1-hour bullish candle close, long exposure can be considered.
Trigger: Price must test the level and produce a bullish 1-hour candle close back above the zone.
Targets: Take partial profits after every $1 advance.
Invalidation: 4-hour candle close below 729.
Long Scenario 3
KEY Level 3 (724) This is the third major demand zone. If price reclaims this level with a confirmed 1-hour bullish candle close, long exposure can be considered.
Trigger: Price must test the level and produce a bullish 1-hour candle close back above the zone.
Targets: Take partial profits after every $1 advance.
Invalidation: Daily candle close below 721.
Short Scenario
Main Supply (752) This area represents the primary supply zone and the upper boundary of the current trading range. A confirmed rejection from this level could provide a tactical short opportunity.
Trigger: Retest of the zone followed by a 1-hour bearish rejection candle.
Targets: Take partial profits after every $1 decline.
Invalidation: 4-hour candle close above 757.
Position Management Rules
1. Entry model: 1-hour candle close above/below the designated level.
2. Take profits in stages because market reversals can happen quickly.
3. After the first profit target is reached, move all remaining stop losses to breakeven and convert the trade into a risk-free position.
4. A reaction from the level must be confirmed. We do not predict price. We react to price.
5. Every scenario has its own invalidation level. Read them carefully before entering a trade.
6. All charts use RTH (Regular Trading Hours). ETH candles may produce inaccurate confirmation signals.
Notice: Starting a fresh, fully transparent track record for SPY, QQQ, and core equities here on TradingView. Going forward, all daily market updates, Tactical SPY/SPX - QQQ outlooks, institutional research, weekly outlooks, and mid-week market updates will be documented and tracked consistently.
This analysis is for educational purposes only and reflects my personal opinion. It is not financial advice.
 Long
Long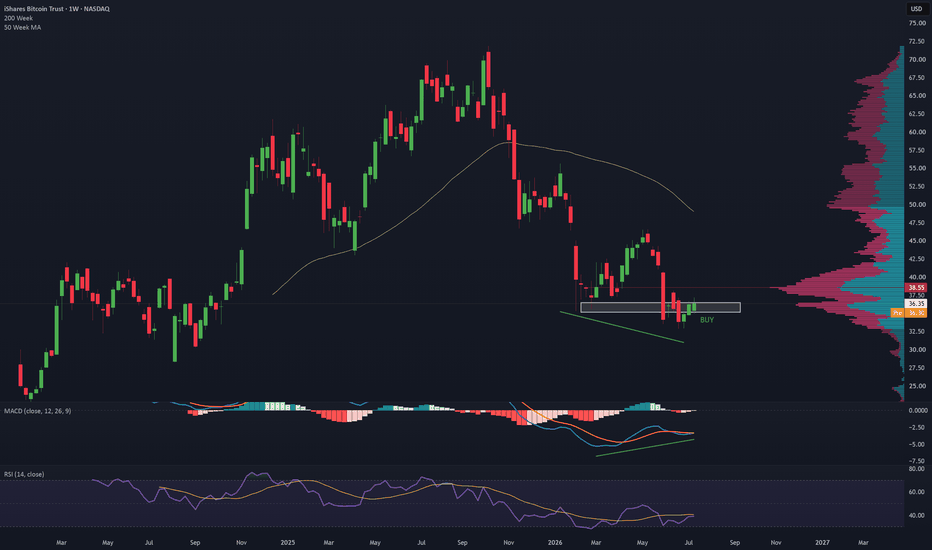
Long 
Weekly Bias — 20 JulyThe picture is more balanced when we take a step back from NASDAQ:QQQ alone, when we look at intermarket leadership, volatility, dispersion & breadth
Bullish (65%)
Short-term trend is corrective
This a correction rather than a new bear leg (~65–70%)
Deeper correction below NASDAQ:QQQ $686 (~30–35%)
Normally, if yields are falling while NASDAQ:QQQ is correcting, I'd expect the correction to become more technical/positioning-driven than macro-driven
VIX at 18.8 deserves respect, but not fear
Below the March spike
Still below the 20–22 level where corrections often accelerate
Front-month futures remain orderly
Volatility is elevated, but we're not seeing panic
COR1M has risen sharply over the last week
Means options traders increasingly expect stocks to move together rather than idiosyncratically
Usually associated with macro hedging, ETF hedging & index selling
It's a yellow flag, not necessarily a red one
DSPX is still trending higher
Higher dispersion means stock selection is still mattering
If dispersion were collapsing while correlation exploded, I'd worry much more about broad index liquidation
Instead, dispersion suggests there's still differentiation underneath the surface
VXN/VIX ratio remains elevated
The options market is demanding relatively more protection for NDX than for the SPX
NASDAQ:QQQ weakest, AMEX:SPY stronger & AMEX:IWM relatively resilient
It's another sign this is concentrated in growth rather than broad market panic
The NDX/NDXE ratio is rolling over
Mega-cap component of NDX has been underperforming the equal-weight version
This is healthy in one sense because it suggests leadership is broadening rather than narrowing
It's also one reason why AMEX:SPY & AMEX:IWM have been holding up better than NASDAQ:QQQ
The NDFI panel has weakened materially
One of the more bearish breadth signals since it tells me fewer stocks are participating in the rally
It's not a collapse, but it's another indication that internal momentum has cooled
NASDAQ:SMH is still outperforming NASDAQ:QQQ over the larger trend, although that leadership has moderated
As long as semis remain relatively strong, it's difficult to make a strong structural bear case for NDX
Software ( CBOE:IGV ) has been underperforming for months
NDX/SPX has been falling
Again, money rotating away from mega-cap growth
AMEX:SPY remains remarkably healthy
Even after Friday, well above major support around $738–$740
Doesn't look like an index beginning a major bear trend
AMEX:IWM continues to strengthen the "correction, not collapse" argument
It's holding $294–$295, above its major support near $290 rather than new relative lows
If institutions were aggressively de-risking, I'd expect AMEX:IWM to be underperforming
NASDAQ:QQQ remains the weakest
I still think Friday produced a legitimate sell-side liquidity sweep
However, the lack of a strong close back above $700 means it hasn't been validated as a successful bear trap
Intermarket analysis suggest IV is elevated & RV is likely to stay above average, but unless NASDAQ:QQQ loses $686, I still expect RV over the next several sessions to fall short of the extreme front-end premium that was priced before expiration
Bullish
NASDAQ:QQQ holds $693–$695
AMEX:SPY stays above $740
AMEX:IWM holds $293–$294
VIX fails to break 20
NASDAQ:QQQ reclaims $700, then $706
Would make Friday look increasingly like a successful liquidity sweep within a larger continuation pattern
Bearish
NASDAQ:QQQ closes below $693
AMEX:SPY loses $738
AMEX:IWM loses $290
VIX pushes above 20–21
COR1M continues to spike while breadth deteriorates further
Combination would materially increase the probability of a move toward $686 & if that level fails, the next technical support would likely be the 100d EMA near $665
NASDAQ:QQQ by itself looks cautious, but the intermarket evidence is notably less bearish
Falling yields are supportive
AMEX:SPY & AMEX:IWM continue to show relative resilience
Semis are still outperforming the broader market the larger trend
Volatility is elevated, but not exhibiting panic characteristics
The main concern is breadth, which has weakened & NDX leadership, which has narrowed
I believe the market is closer to the end of a correction rather than the beginning of a sustained bear trend given the broader evidence doesn't support a high-conviction bearish outlook, but the bulls need to prove it this week & reclaim $700–$706 on NASDAQ:QQQ Long