QQQ: Fear spiked again. Dip or sell-off? (backtest since 2000)QQQ fell 3.5% on Friday to 690.49, about 9% below its Oct 6 closing high. My free Market Fear Meter printed a new FEAR SPIKE, the fourth one this month. VIX closed at 19.42.
The question everyone is asking: is this a dip, or the start of something bigger? I don't know, and nobody does. But I can show what my rules say right now and what history says about this setup.
The reading (Friday close)
My free Risk-Off Ladder tracks 3 warnings and steps aside only when 2 are on:
1. VIX in its top 20% o
ETF market
SPY Weekly Outlook | November 2–6, 2026Can SPY Reclaim 760, or Will 750 Face Another Test?
SPY is recovering from 750.36, but the daily chart remains under pressure. I’m watching 760–761 as the first decision area, with 765–767 as the bigger recovery test.
Catalysts
This week brings economic releases and election headlines. All times below are Pacific:
• Monday: ISM Manufacturing at 7:00 a.m.
• Tuesday: JOLTS job openings at 7:00 a.m.
• Wednesday: ISM Services at 7:00 a.m.
• Thursday: Productivity and labor costs at 5:30 a.m.
• F
Sunday Night Market Prep - Nov 1 2026All right, we’ve got a new month, an election, and plenty of opportunities for the market to keep us on our toes.
In Notable November, I discussed the potential for a recovery following the election. That’s still where I’m leaning as we head into this week: green first, yellow second, red last. I wouldn’t rule out plenty of sideways chop and indecision before we get a convincing move.
Futures opened roughly 0.2% higher this evening, so we’re starting with a little optimism. Let’s see whether t
XLE/XLB, two weeks: energy over materials. Graded Nov 13Two-week call, opened at Friday's close (Oct 30): the XLE/XLB ratio closes above 1.3276 on Nov 13. That number is not a technical level; it is where the ratio sat when the call went out (XLE 70.02, XLB 52.74).
Why: the model I keep the ledger for scores the 11 sectors every night. At the Oct 30 close it scored energy highest (+26; technology next at +23) and materials lowest (−18; financials −17, close to a tie). XLE and XLB are the nearest funds, not the same baskets: the model's sectors cover
SLV - a Comprehensive Institutional Analysis...my 4-Point Structural Analysis requires remaining on the sidelines until terminal liquidity harvest
Complex WXYXZ Correction:
Current price Action in AMEX:SLV is setting up the drop sequence toward Wave ((Z)). This complex Triple Combination / WXYXZ correction aligns directly with textbook Elliott Wave mechanics for deep commodity retracements.
Sub-wave Motive Alignment inside Wave (C) of ((Z)):
Price is completing Sub-wave 3 at the 52-Week Low / 200-Week EMA shelf. The current low-volu
QQQ: Long Signal with Entry/SL/TP
QQQ
- Classic bullish pattern
- Our team expects retracement
SUGGESTED TRADE:
Swing Trade
Buy QQQ
Entry -690.75
Stop -683.43
Take - 703.58
Our Risk - 1%
Start protection of your profits from lower levels
Disclosure: I am part of Trade Nation's Influencer program and receive a monthly fee for using their TradingView charts in my analysis.
❤️ Please, support our work with like & comment! ❤️
SPY Will Explode! BUY!
My dear subscribers,
SPY looks like it will make a good move, and here are the details:
The market is trading on 755.69 pivot level.
Bias - Bullish
Technical Indicators: Both Super Trend & Pivot HL indicate a highly probable Bullish continuation.
Target - 763.80
About Used Indicators:
The average true range (ATR) plays an important role in 'Supertrend' as the indicator uses ATR to calculate its value. The ATR indicator signals the degree of price volatility.
Disclosure: I am part of Tr
IWM: A Conditional Year-End RotationIWM is approaching a key test. Friday’s low came close to my $275.87 support area, and price finished above it at $279.33. I’ll watch the next couple of weeks to see whether buyers keep defending that zone, form a higher low, and build value above it. I also want to see IWM strengthen against SPY and participation improve across small caps; a bounce in IWM by itself would not be enough to confirm a broader rotation.
If those conditions develop, the next major test on my chart is $300.22. Accept
Notable November: Election Rebound or the Bears Take Control?October ended with sellers in control, leaving SPY near the bottom of the broader range we’ve been watching since August. November now presents an important test: can buyers defend that range and build a recovery, or will the late-October selling develop into a more meaningful breakdown?
SPY closed the regular session at $755.72 and continued trading around $757 after hours, which is reflected on my 4 hour chart. The broader boundaries remain approximately $750–$752 below and $783–$784 above. D
QQQ daily: 701 broke — lagging SPY stillQQQ vs the Oct 6 peak and the 701 support we flagged.
From the Oct 6 close (759.66) QQQ was already down hard into late October. Oct 23 low was 701.16. On Oct 30 QQQ closed 690.49 after a low of 683.45 (TradingView daily bars). That is a daily close under 701.
If/then:
- No longs while daily closes stay under 701.
- 683.45 is the fresh reference low. A close under that continues the selling.
- First repair sign would be a daily close back over 701, then 725.
Context: SPY also broke its 759 fl
SPY daily: 759 floor broke — watching 750SPY daily range update.
Oct levels that held twice: Oct 1 low 758.79 and Oct 23 low 758.68. Oct 6 high 781.62 was the ceiling. Those levels are stale now.
On Oct 30 SPY closed 755.72 after a low of 750.36 (TradingView daily bars). That is a daily close under the 759 floor we were watching.
If/then:
- A daily close back over 759 would repair the break. Until then, treat prior range support as resistance.
- 750.36 is the fresh reference low. A close under that keeps pressure on.
- Stand aside o
QQQ POSSIBLE SUBWAVE RALLY IN NEXT COUPLE DAYS W/IN DOWNWAVE 3Still bearish for me.
VIX was up over 10% in a single day, so I am looking for a potential subwave pop here soon, followed by more downside.
On the daily, QQQ has a potential bullish hammer candle.
On the weekly, QQQ has a potential bullish inverted hammer.
Both of these would need to be confirmed before I can say for sure.
There is a gap overhead. This gap does coincide with the golden pocket when you take a fibonacci retracement off the last leg down (assuming this wave down ends aroun
SMH: Two Years of Price, Earnings and Sales GrowthHas the semiconductor rally been matched by growth in the underlying businesses? This chart compares cumulative SMH share-price growth with estimated trailing 12-month earnings and sales per fund unit, all rebased to 100 on 30 September 2024.
Through 29 October 2026:
• Yellow: SMH price +128.8%
• Purple: estimated earnings per fund unit +215.9%
• Teal: estimated sales per fund unit +66.8%
The earnings and sales figures are reconstructed from the underlying companies and dated fund holdings, ad
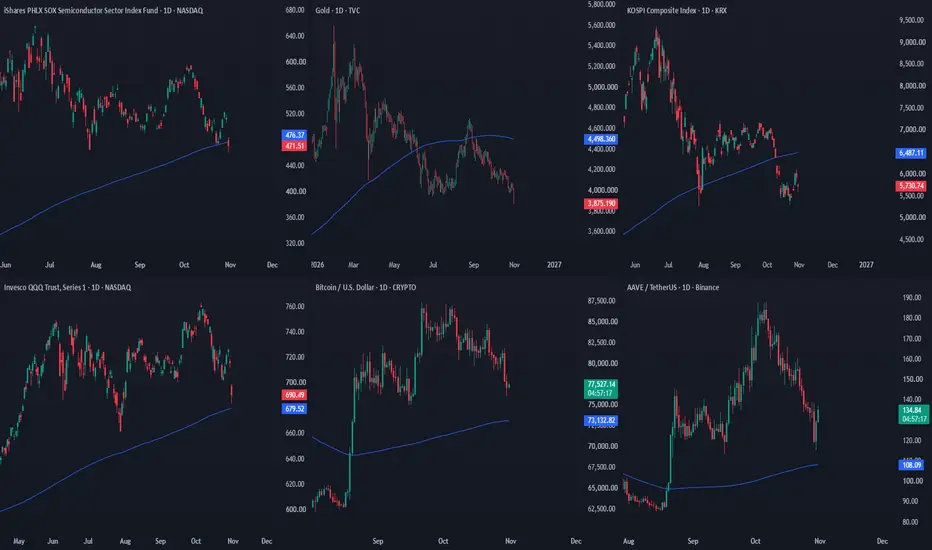
Weekly Market Review📉 SOXX: -8.24% on Friday
First weekly close below its 200-day SMA since June 2025. Semiconductor weakness is becoming increasingly difficult to ignore.
📉 QQQ: -3.50% on Friday
Still holding above its 200-day SMA, but Friday's selloff was significant. Another week of underperformance versus the S&P 500.
🇰🇷 KOSPI: -3.48% on Friday
Third consecutive week of underperformance versus the S&P 500 and third consecutive weekly close below its 200-day SMA.
🥇 GOLD: -3.61% on Friday
Negative price action
SPY: Expecting Bullish Movement! Here is Why:
Remember that we can not, and should not impose our will on the market but rather listen to its whims and make profit by following it. And thus shall be done today on the SPY pair which is likely to be pushed up by the bulls so we will buy!
Disclosure: I am part of Trade Nation's Influencer program and receive a monthly fee for using their TradingView charts in my analysis.
❤️ Please, support our work with like & comment! ❤️
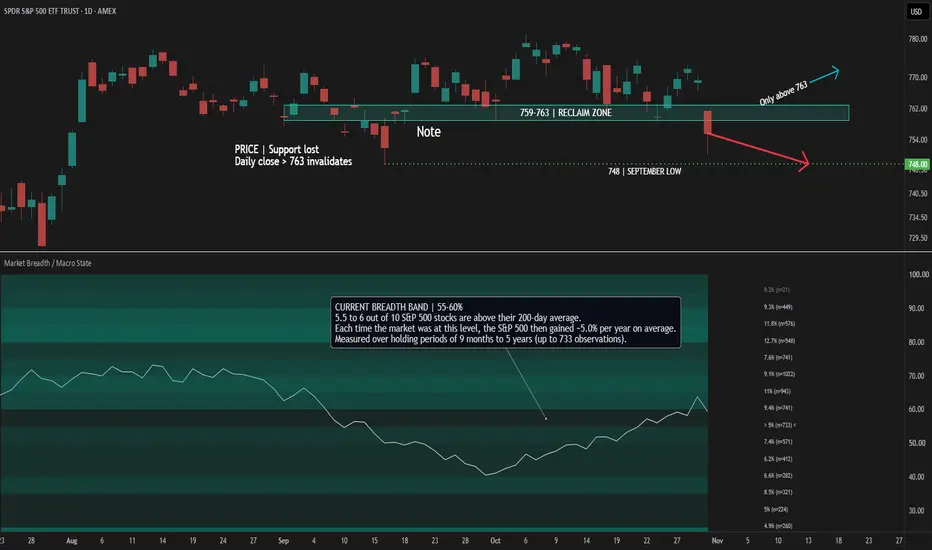
SPY Breaks Support: Breadth Signals CautionSPY has broken below 759-763. But the key message in the lower panel is not simply that breadth has recovered. It is the historical return backdrop associated with its current level.
THE CURRENT READING
Breadth is in the 55-60% band. Under the current settings, this band shows an annualized forward-return estimate of approximately 5.0%, with up to 733 historical observations per horizon. The neighboring 60-65% band shows 9.4% under the same settings.
This illustrates why a rising breadth curv
How confirmed A-B-C Fib extensions work: Active vs InvalidatedThis is a walk-through of how one auto Fibonacci extension tool decides what to draw, using SPY on the 1-hour chart as the worked example. It shows the Auto Fib Extension - Confirmed A-B-C study at default settings, with the daily layer switched off so only two layers are visible: the chart's own 1-hour layer and the 4-hour layer.
Step 1: find an A-B-C from confirmed pivots
A, B and C are swing points the study only accepts once they are confirmed: a pivot needs 5 bars after it on its own timef
SOXX is in a downtrendThe major trendline is broken, but the price is testing 200 day SMA right now and there is a positive divergence on RSI indicator. I think the downtrend will continue after a bounce. I don't want to buy it - I think it's safer to sell the rip instead. The first target os 0.5 fib. The downtrend will probably continue all the way to 0.618 fib to close the gap.
$SPY looks to recover in the short termIf SPY holds $750–$744 and buyers return, I would watch for:
1. Reclaiming $761.33.
2. Breaking $766.94.
3. Testing $772.43.
4. Eventually retesting $781.62.
Election uncertainty could create short-term volatility, but historical patterns favor a recovery after the election. These historical averages are not guarantees, particularly given current technology-sector valuation concerns.
I believe SPY has a reasonable chance to retest $781.62 in November, but Friday's unusually heavy selling means
QQQ at 721.25 stuck under 727.95, does 701.16 hold?This is the ETF chart most traders watch, so the levels here are QQQ prices, not the index. QQQ closed Tuesday at 721.25, a two-day bounce from the 701.16 low on 23 Oct. It is under its 20-day (733.18) and 50-day (725.26) averages, and it is still well under the 762.86 high from 6 Oct, about 5.5% lower. The bounce has not yet cleared the 727.95 high from 21 Oct, which is the lower high that matters. It is over its 200-day average at 678.23 and its 20-week average at 718.64, so the bigger picture