The Yield Curve: A Forex Trader’s Early Warning SystemTradingView added the Yield Curves tab (found at the bottom right of your chart) to their UI last Year and constantly improved upon it. At first glance, it looks like a tool just for bond traders. But even though I am not a bond trader (yet), I started wondering: Can we use this as an early indicator for Forex trading?
The short answer is YES . While Forex traders usually watch price action and news, bond yields often move before the news hits the screen. In this write-up, I will show you how to use this "hidden" signal to stay one step ahead of the market.
First things first: How to Recreate My Charts
If you want to track this yourself on TradingView, search for these two symbols:
- US10Y - US02Y: This shows the "Spread" the gap between long and short rates.
- FRED:DFF: This shows the actual daily interest rate set by the Federal Reserve.
By overlaying these, you can see exactly when the bond market (the Spread) moved before the Fed (the Rate).
The Basics: What is a Bond Yield? (The Seesaw Rule)
To understand the chart, you only need to know Bond prices and yields move like a seesaw.
- When traders buy bonds: The price goes up, and the yield goes down.
- When traders sell bonds: The price goes down, and the yield goes up.
Why do we care? Yields represent the "market's opinion" on interest rates. If yields are falling, the market is betting that the Fed will cut interest rates soon. If yields are rising, the market expects rates to stay high. Because interest rates drive currency value, the yield curve is the ultimate indicator of what "Smart Money" is doing before the news goes public.
The Simple Math (The "Seesaw")
Bond yields and bond prices move on a seesaw. When one goes up, the other must go down because the interest payment (the "coupon") is fixed.
Think of a bond as a fixed contract that never changes. If you own a bond that pays exactly $50 a year, that $50 is locked in.
- Scenario A: You buy a bond for $1,000 that pays $50 interest. Your yield is 5% ($50 / 1,000).
- Scenario B: (Low CPI): Suddenly, a low inflation (CPI) report comes out. Investors get excited because they think the Fed will cut interest rates soon. They rush to buy your bond. Because everyone wants it, the price of your bond rises to $1,100.
The Result: The bond still only pays that fixed $50. But because the new buyer paid $1,100 for it, their yield is now only 4.5% ($50 / 1,100).
Simple English: You are paying more money (higher price) to get the same fixed reward. Therefore, your percentage of profit (yield) goes down.
Summary so far:
Low CPI: The market anticipates lower interest rates in the future.
The Action: Traders rush to lock in today's higher rates by buying bonds.
The Result: Bond prices go up.
The Math: Higher price for the same interest = Lower Yield.
This is why you will see the US10Y yield drop on your TradingView chart the second a "cool" inflation report hits the news.
Setting the Scene: The "Early Indicator" Theory
In a healthy economy, a 10-year bond should pay more than a 2-year bond. Why? Because lending money for 10 years is riskier than lending it for 2 years. This is a "Normal" curve.
An Inverted Curve happens when the 2-year yield is higher than the 10-year yield. This is the market’s way of saying: "We think the Fed has pushed rates too high for the 'Now,' and they will be forced to cut them in the 'Future' to save the economy."
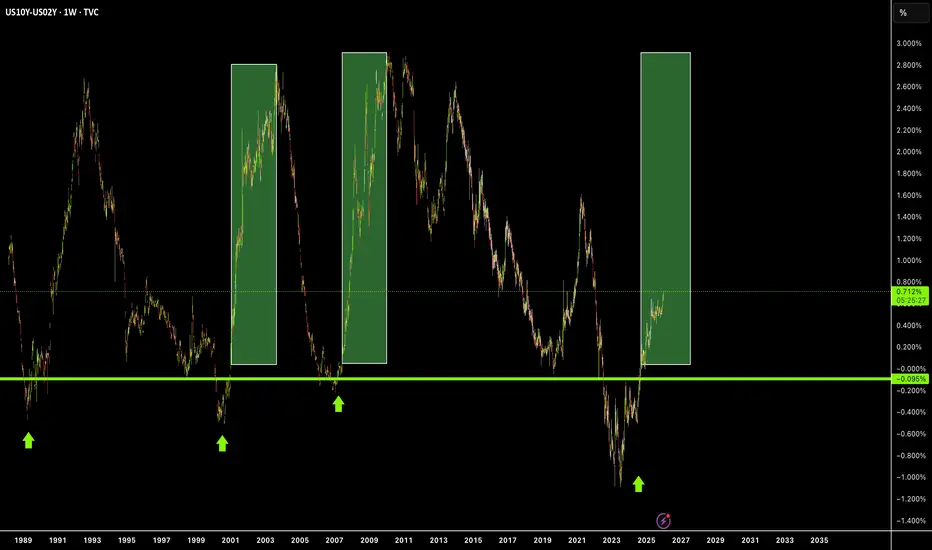
The Timeline: 2019 to Today (Context to the Chart Above)
1. Aug. 2019: Pre-Covid Jitters The spread touches 0. The US-China trade war was slowing global growth. The bond market warned of a slowdown months before the pandemic.
2. Mar. 2020: Pandemic Shock The Fed cuts rates to 0.1%. The spread spikes as the market expects a massive recovery.
3. Mar. 2021: The "Transitory" Trap Inflation starts rising. The Fed says it’s temporary and keeps rates at 0.1%, but the spread starts falling. The bond market knew the Fed was wrong and that rate hikes were coming.
4. Mar. 2022: The Pivot The Fed finally hikes rates. The "Cheap Money" era ends. The 2-year yield spikes to keep up with the Fed.
5. Jun. 2022: Inflation Spike (KEY EVENT) (9.1%) Inflation hits a 40-year high. This is the "Panic Point." Investors realize the Fed must hike aggressively to break inflation.
6. Jul. 2022: The Great Inversion The spread falls below 0. The market signals a recession is coming. For the first time since 2008, the market decided that the "Now" was more risky than the "Future.”
7. Jul. 2023: The Bottom (KEY EVENT) (Soft Landing Bet) The spread hits its lowest point (-1.08%). Inflation drops to 3%, but jobs stay strong. The market starts betting that we might avoid a crash. The spread begins to rise.
8. 2022–2024: The Long Wait The longest inversion in history (26 months). The economy was "immune" to high rates because of 3% mortgages and corporate cash.
9. Sep. 6, 2024: The Un-Inversion (KEY EVENT) (Soft Landing Confirmed) The Golden Signal. The curve turns positive. This wasn't because of a crash, but because inflation was defeated. The bond market confirmed the Soft Landing 12 days before the Fed’s first 0.50% cut.
10. Jan. 2026: Normalization We are here today. The spread is stable at +0.68%. The Fed rate is 3.50%. The curve is healthy again.
The Takeaway
The Rule: The bond market represents "Smart Money."
The Signal: A rising spread usually means the market expects rate cuts or economic strength.
For Forex: If the spread rises before the Fed cuts, it’s an early signal to look for Dollar weakness.
The next time you see the US10Y - US02Y line making a big move on your chart, don't wait for the Fed meeting. The bond market has already made its decision. If the spread is rising, the market is "pricing in" a weaker dollar or a rate cut. As Forex traders, that is our cue to look for setups.
Think of it this way: The spread is a "Confidence Meter."
Falling Spread: "We are worried the Fed is hiking too much."
Rising Spread: "We are excited the Fed is finally cutting rates to help the economy."
*** Congratulations for making it this far! Let me know in the comments if you use or plan to use these early indicators.  Education
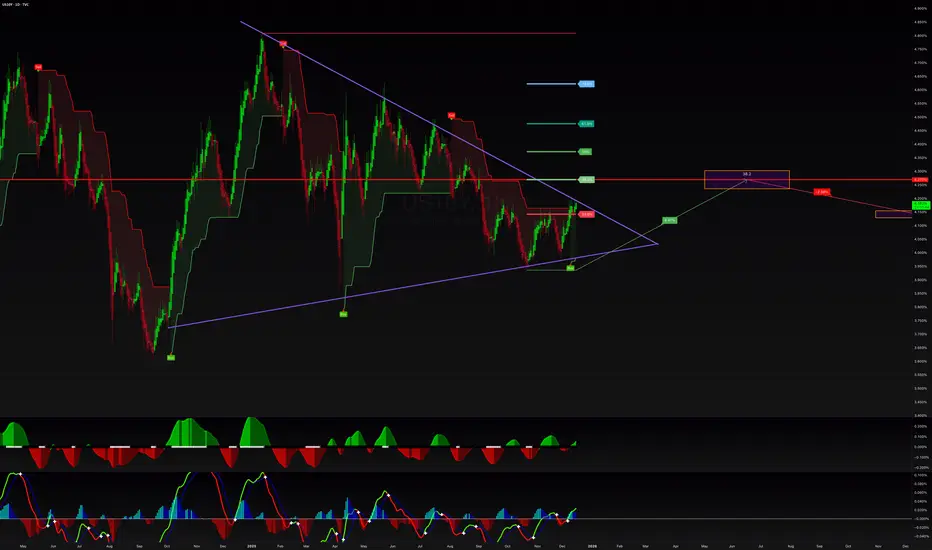
US 10‑Year Yield: Quiet… but waking up?The range may look dull, but there are signs of life. The 10‑year has broken above its short‑term downtrend from June, yet it’s still capped by the September high at 4.20% and the 200‑day MA around 4.23%.
Price has now pushed above the Ichimoku cloud, with the lagging line following — a subtle but meaningful shift ahead of NFP and rising geopolitical tensions.
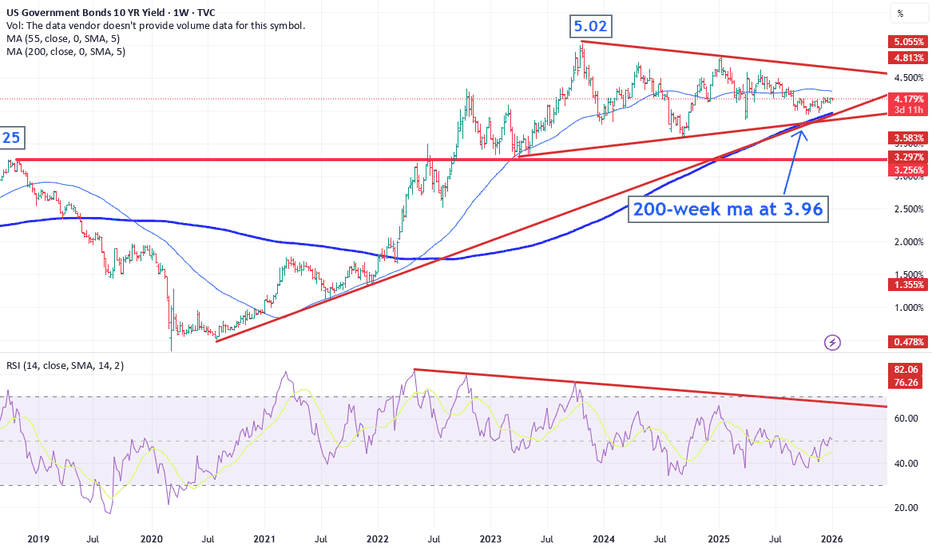
On the weekly chart, strong support from the 2020 uptrend and the 200‑week MA at 3.96% keeps the structure intact. A break above 4.24% could open the path toward the long‑term channel top near 4.61%.
One to keep firmly on the radar.
Disclaimer:
The information posted on Trading View is for informative purposes and is not intended to constitute advice in any form, including but not limited to investment, accounting, tax, legal or regulatory advice. The information therefore has no regard to the specific investment objectives, financial situation or particular needs of any specific recipient. Opinions expressed are our current opinions as of the date appearing on Trading View only. All illustrations, forecasts or hypothetical data are for illustrative purposes only. The Society of Technical Analysts Ltd does not make representation that the information provided is appropriate for use in all jurisdictions or by all Investors or other potential Investors. Parties are therefore responsible for compliance with applicable local laws and regulations. The Society of Technical Analysts will not be held liable for any loss or damage resulting directly or indirectly from the use of any information on this site.
can the us10y double in 2026?gm,
this is a very contrarian idea.
---
imagine the weather app says calm skies.
yet outside, the trees are bending hard.
that’s what a us10y doubling from ~4% to ~8% during rate cuts would feel like.
---
if the us10y doubled from 4% to 8% while rates were being cut, it would mean the bond market has completely lost trust in the fed. policy says ease, markets say danger. when that gap opens, risk assets usually fall first.
---
lets talk structure for a moment, cause i don't really care about the reason why this happens.
---
structurally speaking, from the covid lows, the us10y put in a bullish nest, and ever since that bullish nest, it's been expanding upward. if my count here is correct, the us10y would be in a bullish 4th wave, a bull flag of sorts, preparing for 1 final leg up.
if that leg up does come, it won't be a grind, it'll be complete capitulation of a portion of the banking system. 8% is my target, but it could double that if shtf.
---
🎯 = 8%+ Long 
US 10Y TREASURY: Tests 4,20% ahead of jobs dataThe first trading session in 2026 reflected Fed policy uncertainty and thin volume on US Treasury markets. The 10Y Treasury yield held steady near 4,15% up to 4,20%as thin holiday trading left yields relatively flat. Investors are digesting fed policy expectations, including pricing in multiple potential rate cuts this year and watching upcoming economic data that could influence the path of interest rates. The market's focus remains on the Fed's outlook and labor data, with the 10Y yield lingering close to recent multi-week highs as traders balance inflation and growth signals.
For the moment the level of 4,20% remains the strong resistance level. In a week ahead US jobs data and Non-farm payrolls are scheduled to be posted, which might bring back some volatility. Whether the level of 4,20% will be finally broken to the upside, is to be seen, based on posted labor data and expectations of Fed's further rate cuts. In case that 4,20% withholds the pressure, a short term reversal might come, with the next support level around 4,10% and final at 4,0% within the higher time frame.
Long 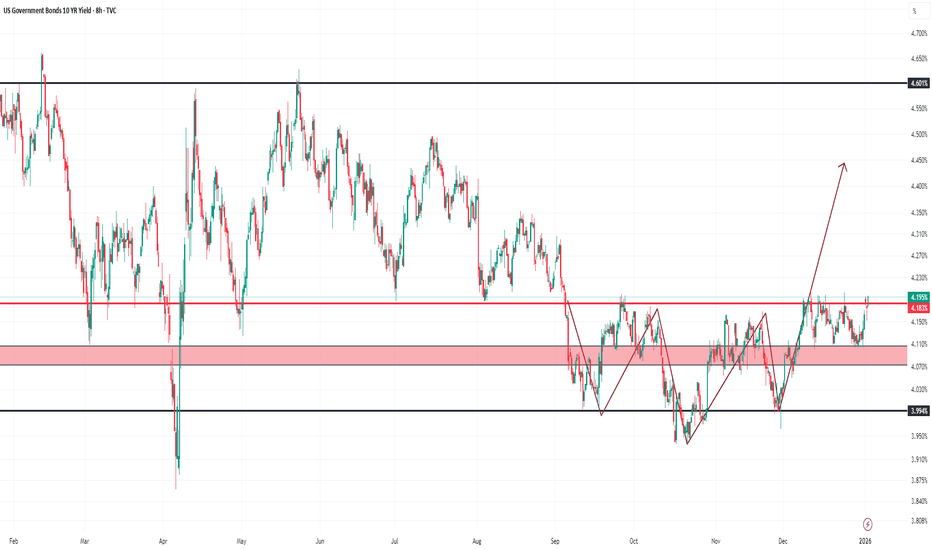
Long 
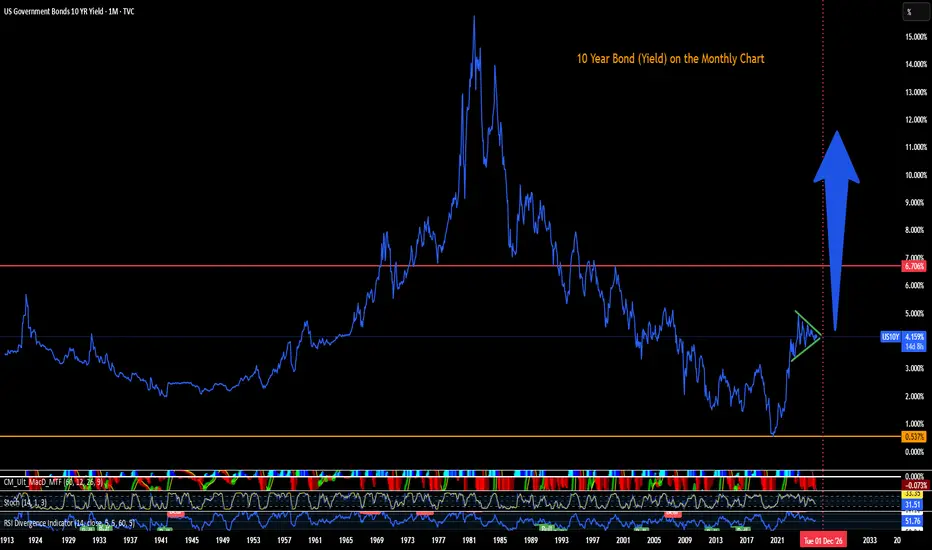
US10Y Expected rising yields can turn stocks bearish in 2026.The U.S. Government Bonds 10YR Yield (US10Y) has been consolidating since 2023 within a Triangle pattern, while the stock markets had one of their strongest Bull Cycles in recent history. Before than in 2022, the US10Y rose aggressively, while stocks took the opposite turn, having a Bear Cycle.
With the US10Y under a Higher Highs uptrend since 2017, while also turning its multi-decade Resistance of the 1M MA200 (orange trend-line) into Support, the long-term trend has long shifted to bullish. And as the market approaches the 1M MA50 (blue trend-line)for the first time since March 2022, it will be tested as the trend's Support.
As long as it holds, we expect the US10Y to start another yearly rally, potentially causing a new Bear Cycle on the stock markets.
---
** Please LIKE 👍, FOLLOW ✅, SHARE 🙌 and COMMENT ✍ if you enjoy this idea! Also share your ideas and charts in the comments section below! This is best way to keep it relevant, support us, keep the content here free and allow the idea to reach as many people as possible. **
---
💸💸💸💸💸💸
👇 👇 👇 👇 👇 👇 Long 
US10Y10Y Treasury Outlook – Structural Demand for Higher Yields (2026 Thesis)
This idea is based on a macro-structural view, not short-term noise.
My thesis is that 10-Year Treasury yields may trend higher into 2026, driven by sustained capital requirements tied to national-priority investments, not temporary inflation spikes.
The United States faces long-horizon funding needs in:
• Military modernization and defense technology
• AI infrastructure (chips, data centers, cyber systems)
• Electrical grid expansion, security, and redundancy
These are non-discretionary expenditures tied to national security and competitiveness. To fund them at scale, the US must continue attracting global capital, which historically requires competitive long-term yields.
From a market perspective:
• Higher 10Y yields reprice risk assets
• Favor capital-disciplined and cash-flow-strong sectors
• Pressure leverage-dependent and speculative assets
This setup suggests a structural bid for yields, even during periods of short-term rate cuts or economic softness.
⚠️ This is not a short-term trade call, but a positioning framework for medium- to long-term market structure. US 10Y TREASURY: relaxing Holiday weekDespite the Christmas holiday and non-working day, US Treasury markets continued to trade in a mixed manner. During this period of time, currently important macro data are not posted, in which sense; the market is searching the catalyst for moves in one or another direction. During the previous week, the 10Y Treasury yields tested the 4,2% current resistance level, however, swiftly turned toward the downside where 4,1% support was tested. Yields are closing the week at 4,13%.
The week ahead brings the end of the 2025 trading year, and a New-year holiday as well as another non-working day. Usually this is the period of the year when market participants on the Western markets are taking some time-off the trading floor. In this sense, there should be expected one calm week, where yields will most probably oscillate around current levels.
Global Economic Indicators & Macro Data Trading1. Understanding Global Economic Indicators
Economic indicators are statistical measures that reflect the overall health and direction of an economy. They are broadly categorized into leading, coincident, and lagging indicators.
Leading indicators signal future economic activity. Examples include Purchasing Managers’ Index (PMI), consumer confidence, building permits, and yield curves.
Coincident indicators move in line with the economy, such as GDP growth, industrial production, and employment levels.
Lagging indicators confirm trends after they occur, including unemployment rate, corporate profits, and inflation persistence.
Macro traders prioritize leading and coincident indicators because markets are forward-looking and tend to price expectations rather than past data.
2. Key Global Macro Indicators
a) Gross Domestic Product (GDP)
GDP measures the total value of goods and services produced in an economy. Strong GDP growth generally supports equity markets, strengthens the domestic currency, and raises interest rate expectations. Weak or contracting GDP signals economic slowdown, often boosting bonds and safe-haven assets like gold.
Traders focus not only on headline GDP but also on its composition—consumption, investment, government spending, and net exports—to assess sustainability.
b) Inflation Indicators
Inflation data such as Consumer Price Index (CPI), Producer Price Index (PPI), and Core Inflation are among the most market-moving indicators globally. Inflation directly influences central bank policy.
Rising inflation tends to push interest rates higher, strengthening currencies and pressuring equities.
Falling inflation or deflation expectations support bonds and growth stocks.
Macro traders closely analyze month-on-month trends, base effects, and inflation expectations embedded in bond markets.
c) Employment Data
Employment indicators like Non-Farm Payrolls (NFP), unemployment rate, labor force participation, and wage growth reflect economic momentum and consumer strength.
Strong job growth supports equities but may trigger tighter monetary policy. Weak employment data raises recession fears, benefiting bonds and defensive sectors.
3. Central Bank and Monetary Policy Data
Central banks are the most powerful drivers of macro markets. Interest rate decisions, policy statements, meeting minutes, and forward guidance significantly impact asset prices.
Interest Rates: Higher rates strengthen currencies and hurt interest-sensitive sectors.
Quantitative Easing (QE) / Tightening (QT): Liquidity injections support risk assets, while liquidity withdrawal increases volatility.
Forward Guidance: Markets often move more on what central banks say about the future than on the actual rate decision.
Macro data trading heavily revolves around predicting central bank responses to inflation and growth indicators.
4. Bond Yields and Yield Curves
Government bond yields reflect growth and inflation expectations. The yield curve—difference between short-term and long-term yields—is a crucial macro signal.
Normal curve: Indicates healthy growth expectations.
Inverted curve: Often precedes recessions and equity market corrections.
Traders monitor U.S. Treasury yields, German Bunds, and Japanese Government Bonds as global benchmarks influencing capital allocation.
5. Currency and Balance of Payments Data
Currencies respond strongly to macro data. Key indicators include:
Trade balance and current account data
Capital flows and foreign investment
Interest rate differentials
A strong economic outlook and higher interest rates attract foreign capital, strengthening the currency. Macro traders use economic data to build currency pair strategies, especially in USD, EUR, JPY, GBP, and emerging market currencies.
6. Commodity and Global Demand Indicators
Commodities are highly sensitive to macro data. Industrial metals like copper reflect global growth, while oil responds to economic activity and geopolitical factors. Agricultural commodities react to weather, supply chains, and demand trends.
China’s GDP, PMI, and industrial data are especially important, as China is a major consumer of global commodities. Macro traders often use commodity prices as leading indicators of inflation and economic cycles.
7. Geopolitical and Global Risk Indicators
Macro trading is not limited to economic numbers alone. Geopolitical events, trade policies, sanctions, wars, and global health crises significantly influence markets.
Risk indicators such as:
Volatility indices (VIX)
Credit spreads
Emerging market bond spreads
help traders assess global risk sentiment. During risk-off periods, capital typically flows into safe havens like the U.S. dollar, government bonds, gold, and defensive equities.
8. Macro Data Trading Strategies
a) Event-Driven Trading
Traders position ahead of major data releases like CPI, GDP, or central bank meetings. High-frequency and institutional traders exploit short-term volatility around announcements.
b) Trend and Cycle Trading
Macro traders align positions with economic cycles—growth, slowdown, recession, and recovery—allocating capital accordingly across asset classes.
c) Relative Value and Spread Trades
Comparing macro data between countries allows traders to take relative positions, such as long one currency and short another, based on growth and rate differentials.
d) Asset Allocation Shifts
Long-term investors use macro indicators to rebalance portfolios between equities, bonds, commodities, and cash as economic conditions evolve.
9. Challenges in Macro Data Trading
Macro trading is complex and probabilistic. Key challenges include:
Data revisions that change economic narratives
Market expectations already priced in before data release
Conflicting indicators sending mixed signals
Central bank intervention distorting natural market responses
Successful macro traders focus on expectations vs. actual data, not just whether numbers are good or bad.
10. Importance of Context and Risk Management
Macro data does not operate in isolation. Inflation data during a recession has a different impact than inflation during an expansion. Similarly, strong GDP growth may be negative for markets if it leads to aggressive rate hikes.
Risk management is critical due to high volatility around macro events. Position sizing, diversification, and scenario analysis are essential tools for macro traders.
Conclusion
Global economic indicators and macro data trading form the foundation of modern financial markets. From GDP and inflation to employment, central bank policy, and geopolitical risk, macro data shapes investor behavior across asset classes. Markets are forward-looking and driven by expectations, making interpretation and context more important than raw numbers. Successful macro traders combine economic analysis, market psychology, and disciplined risk management to navigate cycles, volatility, and uncertainty. In a world where global events instantly transmit across markets, mastering macro indicators is no longer optional—it is essential for sustainable trading and investment success. Education 
US 10Y TREASURY: Narrow trading ahead of HolidaysThe US job market, inflation data and University of Michigan inflation expectations were shaping investors sentiment on a Treasury bond market during the previous week. The jobs market remains relatively slow, with an increased unemployment rate to 4,6% in November. On the other hand, inflation in November stood at 2,7%, below market expectations. University of Michigan next year inflation expectations are further decreased. Investors were weightening whether this could be an indication of a potential further rate cut by the Fed in 2026?
The US 10Y Treasury benchmark reached the highest weekly level at 4,19%, but closed the week lower, at 4,15%. Still, the lowest weekly level was reached on Thursday, at 4,10%. The week ahead marks the start of the Holiday season in the Western markets. This is usually the period of the year where the volatility remains relatively low. In this sense, it could be expected that 10Y yields will continue to move in a relatively short range, probably between 4,18% and 4,12%. Note that US markets are closed on December 25th, so no trading on this day.
Long 
 Long
Long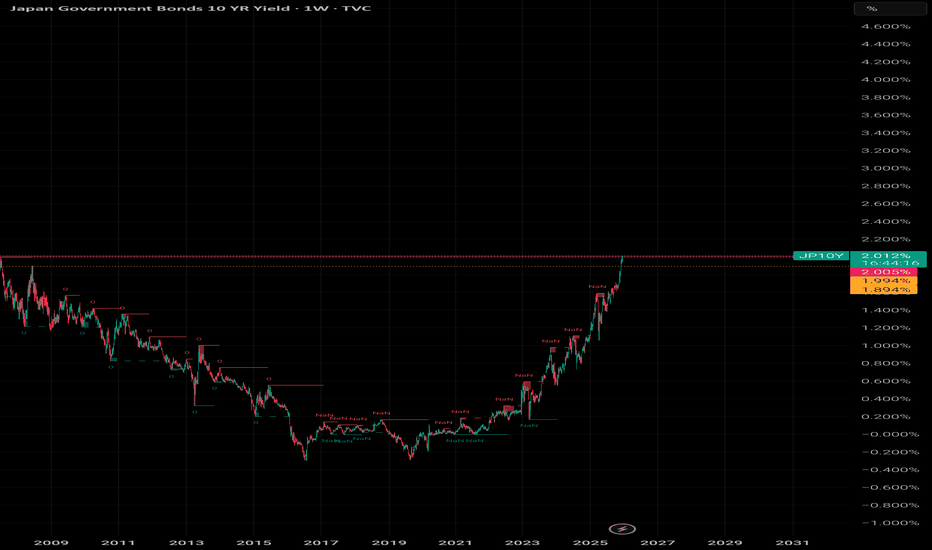
Long 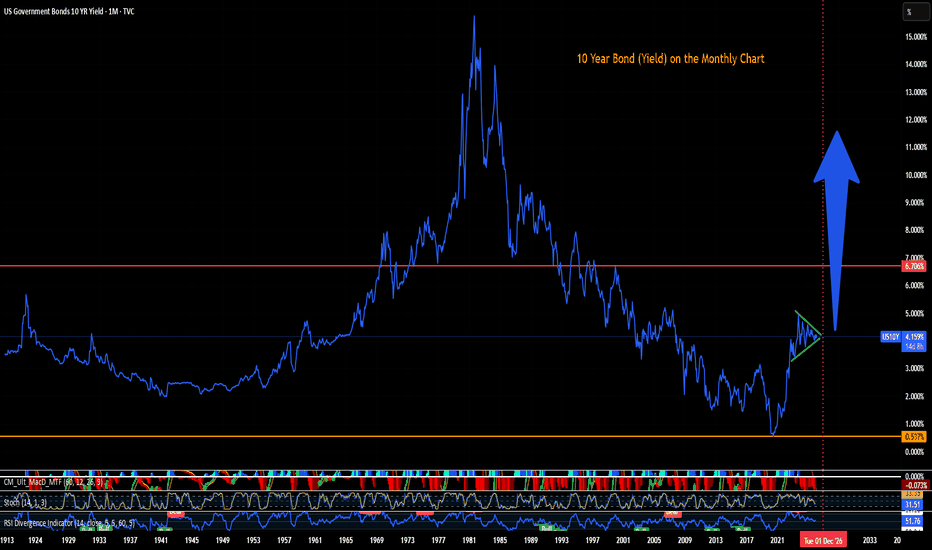
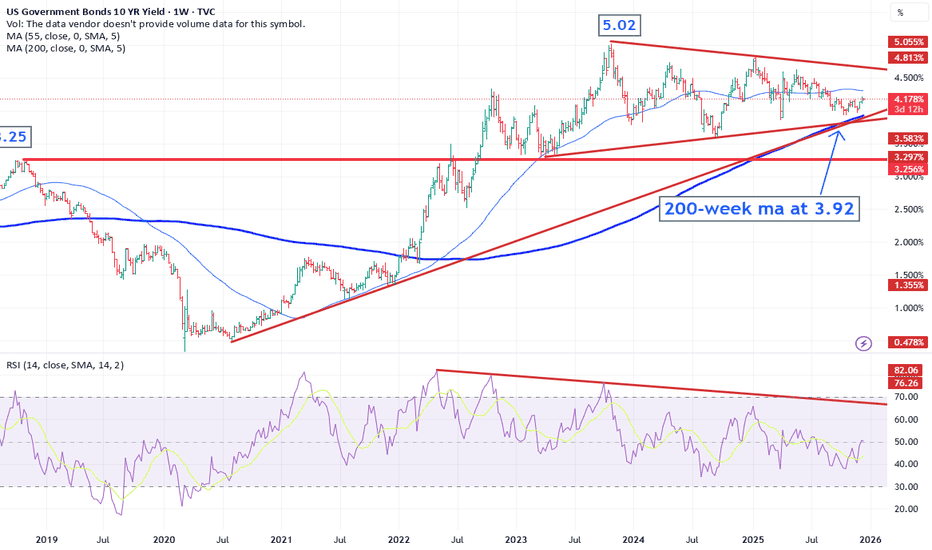
US 10Y TREASURY: Testing 4,2%The Fed decreased interest rates by 25 basis points as it was expected. The economic outlook remains modestly positive, with risks on both inflation and jobs. The Fed does not perceive that the inflation would return to targeted 2% during next year. That could be a short summary of the latest FOMC meeting, held last week. The 10Y Treasury benchmark yield traded higher, despite a short drop toward the 4,1%. Friday brought another shift back to 4,19%, after Chicago Federal reserve President Austan Goolsbee noted that the Fed should not lower interest rates further, after three cuts since September. This was not in alliance with market expectations, as investors are pricing at least two rate cuts during 2026.
The market is currently testing the 4,2% 10Y yields. It could be expected that this trend will continue also during the week ahead. On the other hand some modest relaxation in yields is also probable, but only till the level of 4,15%. At this moment, investors are trying to assess the course of monetary actions during next year, in which sense, some volatility might prevail.
Long