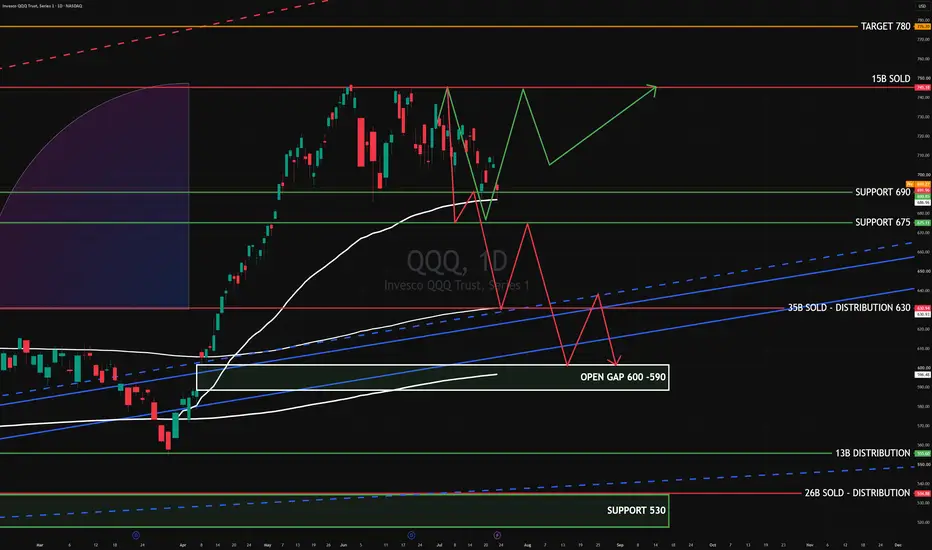
QQQ JUL 2026QQQ is testing the 690 support zone after rejecting from the 745 institutional distribution area, where approximately $15B in selling was identified.
The 690–675 range is the key absorption zone. Holding this area keeps the broader bullish structure intact, but buyers must reclaim 705–710 to confirm renewed momentum.
Bullish targets:
705–710
720–725
745
780 after a confirmed breakout above 745
Bearish targets:
675
630 institutional distribution
600–590 open gap if 630 fails
555–535 on a deeper correction
Bias: Neutral-to-bullish above 675. A daily close below 675 would shift control toward sellers and expose 630.
ETF market
SPY Without The Crash Box: Where We Should Be Today
Today SPY sits at $740. Without the crash box, we'd be at $2,988. That's not a fantasy projection. It's the natural compounding trajectory of a market that was never interrupted by collective panic. The belief channel, drawn from proven historical growth, puts our ceiling nearly 4x higher than where we actually are.
I can't even fit where we should be on this screen. Let that sink in.
The math of fear:
Every crash box created a debt spiral that took longer to recover from than the bubble took to form. The 2008 crash wiped 57% in 18 months. The recovery took 5.5 years just to get back to zero. That's not a correction, that's a generation of compounding deleted. Then COVID did it again. Each time, the market clawed back eventually, because growth is inevitable. But it clawed back to where it already should have been years earlier, not to where it would have been without the interruption.
The purple fan on this chart shows the compounding divergence. The longer we allow crash boxes to form, the wider the gap gets. It's exponential. We're not falling slightly behind. We're falling catastrophically behind.
What this actually cost:
Look at the wedge list. Economic Waste. Brutal Interest. Hello Benefits Goodbye Jobs. Kiss Retirement Goodbye. Can't Pay the Bills. Struggling Business. Every one of those wedges is a real consequence lived by real people because the market chose fear over investigation.
I'll make this personal. I'm a Chartered construction professional (MCIOB) with innovative solutions to complex problems, including energy infrastructure ideas that would have had me collaborating with people like Elon Musk by now. Instead, my construction business collapsed because fear-driven interest rate policy made it impossible for local authorities to pay SME contractors on time. I'm now fighting insolvency courts and chasing redundancy payments instead of building the future. My ideas didn't fail. The economy failed my ideas.
I should be innovating. Instead I'm fighting for justice because this system doesn't support good businesses in the SME sector. It punishes them for existing during a crash box.
This actually makes me sad and angry. Not for myself. For all of us. For every business that closed, every retirement that evaporated, every innovation that got shelved, every person who was told "the market conditions aren't right" when the only thing that wasn't right was our collective psychology.
$2,988. That's where we'd be today if we'd chosen belief over fear. Standards over panic. Investigation over contempt. Governance over chaos.
We're $2,248 per share behind where we should be. Multiply that across every pension fund, every retirement account, every small investor who was told the market always recovers. It does recover. But it recovers to where it should have been a decade ago, never to where it should be now.
The economy will grow because it must. Our survival in a growing population demands it. The only question is whether we keep paying the price for fear or whether we finally break the cycle.
I dare us to sort this.
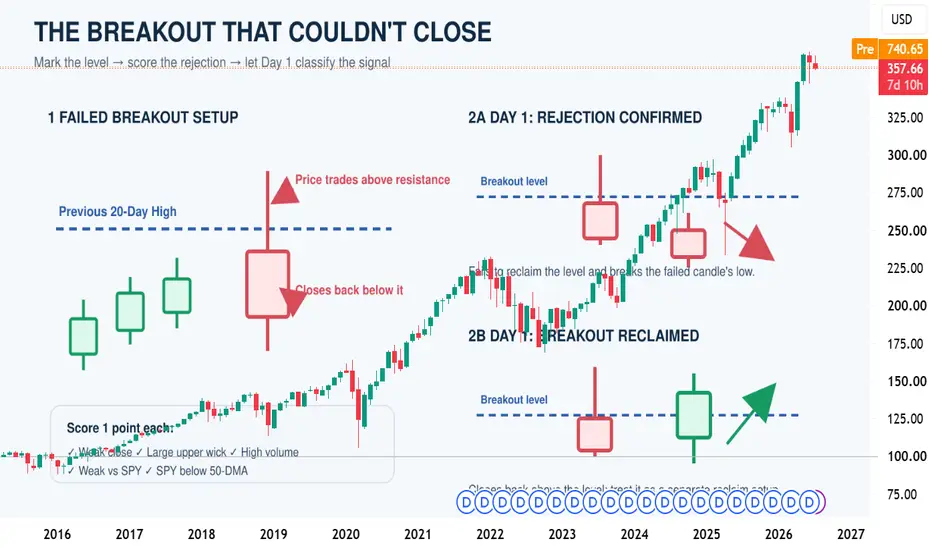
The Breakout That Couldn’t CloseA Simple Five-Point Framework for Studying Failed Breakouts
Not every move above resistance becomes a successful breakout.
Sometimes, price trades above an important level during the session but fails to hold it and closes back below. This may indicate that buyers were unable to maintain control.
However, one failed candle is not enough. We need a consistent method to separate meaningful rejection from ordinary market noise.
𝗜𝗗𝗘𝗡𝗧𝗜𝗙𝗬𝗜𝗡𝗚 𝗧𝗛𝗘 𝗦𝗘𝗧𝗨𝗣
First, mark the highest price reached during the previous 20 completed daily candles.
A failed-breakout candidate appears when:
• Today’s high moves above the previous 20-day high.
• Today’s close finishes back below that level.
Do not include the current candle when calculating the previous 20-day high. Always wait for the daily candle to close before evaluating the setup.
𝗧𝗛𝗘 𝗙𝗜𝗩𝗘-𝗣𝗢𝗜𝗡𝗧 𝗖𝗛𝗘𝗖𝗞
Give the setup one point for each condition.
𝟭. 𝗪𝗲𝗮𝗸 𝗖𝗹𝗼𝘀𝗶𝗻𝗴 𝗣𝗼𝘀𝗶𝘁𝗶𝗼𝗻
The candle closes in the lower half of its daily range. This suggests that sellers gained control before the session ended.
𝟮. 𝗟𝗮𝗿𝗴𝗲 𝗨𝗽𝗽𝗲𝗿 𝗪𝗶𝗰𝗸
The upper wick is at least one-third of the candle’s total range. It shows that price reached higher levels but could not remain there.
𝟯. 𝗛𝗶𝗴𝗵 𝗩𝗼𝗹𝘂𝗺𝗲
The day’s volume is at least 1.5 times the average volume of the previous 20 sessions.
Higher volume makes the rejection more meaningful because more market participation was involved.
𝟰. 𝗪𝗲𝗮𝗸𝗻𝗲𝘀𝘀 𝗥𝗲𝗹𝗮𝘁𝗶𝘃𝗲 𝘁𝗼 𝗦𝗣𝗬
The stock’s 20-day return is lower than SPY’s return over the same period.
A stock already underperforming the broader market may have less support behind its breakout attempt.
𝟱. 𝗪𝗲𝗮𝗸 𝗠𝗮𝗿𝗸𝗲𝘁 𝗘𝗻𝘃𝗶𝗿𝗼𝗻𝗺𝗲𝗻𝘁
SPY is trading below its 50-day moving average.
A failed breakout may carry more weight when the overall market environment is weak.
𝗛𝗢𝗪 𝗧𝗢 𝗥𝗘𝗔𝗗 𝗧𝗛𝗘 𝗦𝗖𝗢𝗥𝗘
🔴 0–1 points: Weak evidence. It may simply be market noise.
🟡 2–3 points: Mixed evidence. Wait for more information.
🟢 4–5 points: Strong rejection candidate. Observe the next completed daily candle.
The score is not a prediction or an automatic trade signal. Its purpose is to organize the available evidence consistently.
𝗔𝗣𝗣𝗟𝗬𝗜𝗡𝗚 𝗧𝗛𝗘 𝗙𝗥𝗔𝗠𝗘𝗪𝗢𝗥𝗞 𝗢𝗡 𝗧𝗥𝗔𝗗𝗜𝗡𝗚𝗩𝗜𝗘𝗪
1. Open the stock’s chart.
2. Select the 1D timeframe and Candles chart type.
3. Add the Volume indicator.
4. Add a 50-period Simple Moving Average.
5. Add SPY through “Compare or Add Symbol.”
6. Examine the previous 20 completed daily candles.
7. Mark their highest high with a horizontal line.
8. Wait for the current daily candle to close.
9. Check the five conditions and record the score.
𝗖𝗛𝗔𝗥𝗧 𝗟𝗔𝗕𝗘𝗟𝗦
🔵 Blue line: Previous 20-day high
🔴 Red marker: Failed-breakout candidate
⚠️ Yellow marker: Unresolved outcome
✅ Green marker: Confirmed outcome
𝗪𝗛𝗔𝗧 𝗛𝗔𝗣𝗣𝗘𝗡𝗦 𝗢𝗡 𝗗𝗔𝗬 𝟭?
🔴 𝗥𝗘𝗝𝗘𝗖𝗧𝗜𝗢𝗡 𝗖𝗢𝗡𝗙𝗜𝗥𝗠𝗘𝗗
The rejection is confirmed when Day 1:
• Fails to close back above the breakout level.
• Closes below the low of the failed-breakout candle.
Both conditions should be satisfied before classifying the setup as a confirmed rejection.
🟢 𝗕𝗥𝗘𝗔𝗞𝗢𝗨𝗧 𝗥𝗘𝗖𝗟𝗔𝗜𝗠𝗘𝗗
The breakout is reclaimed when Day 1:
• Closes back above the breakout level.
• Closes in the upper half of its daily range.
A reclaim should be recorded as a separate setup instead of being treated as a confirmed failed breakout.
⚠️ 𝗨𝗡𝗥𝗘𝗦𝗢𝗟𝗩𝗘𝗗
If neither classification is satisfied, mark the setup as unresolved.
Do not force every chart into a bullish or bearish conclusion. Sometimes the correct decision is to wait for more information.
𝗧𝗘𝗦𝗧𝗜𝗡𝗚 𝗧𝗛𝗘 𝗙𝗥𝗔𝗠𝗘𝗪𝗢𝗥𝗞 𝗪𝗜𝗧𝗛 𝗕𝗔𝗥 𝗥𝗘𝗣𝗟𝗔𝗬
Before drawing conclusions, test the framework on historical data.
1. Open TradingView’s Bar Replay.
2. Select an earlier date.
3. Move forward one daily candle at a time.
4. Keep future candles hidden.
5. Record the Day 0 score.
6. Record the Day 1 classification.
7. Measure the return after one, three and five sessions.
8. Repeat the process for at least 50 historical examples.
𝗦𝗜𝗠𝗣𝗟𝗘 𝗥𝗘𝗖𝗢𝗥𝗗 𝗙𝗢𝗥𝗠𝗔𝗧
Date: May 10
Symbol: XYZ
Five-Point Score: 4
Day 1 Result: Rejection Confirmed
Day 3 Return: −2.1%
Day 5 Return: −3.4%
𝗔𝗩𝗢𝗜𝗗 𝗦𝗘𝗟𝗘𝗖𝗧𝗜𝗢𝗡 𝗕𝗜𝗔𝗦
Do not select only famous or obvious failed breakouts.
Use a fixed list of stocks and a fixed historical period. Record every setup that meets the original definition, including weak and unresolved examples.
The framework becomes interesting only if high-scoring setups produce consistently different results from low-scoring setups.
𝗙𝗜𝗡𝗔𝗟 𝗣𝗥𝗢𝗖𝗘𝗦𝗦
Mark the level → Wait for the close → Calculate the score → Classify Day 1 → Record the results
A useful market framework should not depend on one attractive chart. It should use clear definitions, repeatable rules and enough historical observations to show whether the idea deserves further research.
𝗗𝗜𝗦𝗖𝗟𝗔𝗜𝗠𝗘𝗥
This material is provided for educational and research purposes only. It is not financial advice or a guaranteed trading strategy. Test the framework with Bar Replay or paper trading before considering any real-money decision.
QQQ: Diamond formation in play; 8% move down next?The QQQ might just have confirms the diamond formation which is sending major warning signals :
QQQ recently broke below the diamond formation towards 693$ , went back up to retest 708$ and now is back down. This is sending a signal : confirmation of the diamond pattern and a potential move lower.
Looking at possible targets by taking the high of the diamond pattern to the low , this takes us to the 636$ , an 8% move down. This level happens to coincide with the 50% and 618% of the entire move that happened since late march.
Is this the start of the big AI bubble burst or is this just a minor retracement before reaching new highs?
Let me know what you guys think below
Hope you liked today’s analysis , make sure to follow for more.
The Psychology Behind the Crash Box: Fear Creates the GeometryThis is the 2003-2013 cycle mapped through the emotional lens of the average market participant. Every crash box has a psychological fingerprint. This is what it looks like.
The sequence:
The market moves along untouched. Confidence is high. Nobody questions it. Then innovation arrives (early internet, smartphones, emerging tech) and a bubble forms. Participants reap the benefits. But doubt creeps in: "I'm in old tech." "What's real and what's hype?" Saturation sets in. Nobody knows what to invest in anymore.
Then the break.
Professional money separates from the herd. Pros limit losses, manage risk, even profit on the way down. The general population withdraws entirely through fear of the unknown. "We were told it was safe. Year on year increases. What happened?"
The Eye Opening Wedge forms at the bottom. This is where the crash box is born. Smart money re-enters while retail is frozen. The divergence between those two groups is the crash box geometry. The angle of recovery is set by how quickly confidence returns.
The critical insight: Crash box angles change with increased population participation and accelerating innovation cycles. Each crash is steeper but shorter. The geometry compresses because the world moves faster. This intersects directly with the Cube Cosmos Published Crash Box Idea on the current SPY setup.
But stay tuned. In the next part, I ask the question nobody else does: what if this doesn't need to happen again? What if the crash box is not a market law, but a failure of collective psychology? What did this actually cost us, and what would the timeline look like had we chosen differently?
The alternative version of events follows.
I dare us to break the cycle, back then even the smart money needed to relearn strategy and widen their fields of view.
They entered again because the knew one thing.
The economy will grow, because it must!!
Our very survival in a growing population depends on it.
Personally, i want us to catch up with where we should be by now.
If we were not so distracted cleaning up the mess fear and doubt, even contempt prior to investigation presents, where do you think the SPY value would be sitting at today?
Psychology birthed this cycle, Psychology can change its destiny!!!
Crash Box Continued By Cube CosmosTracking the Crash Box from birth to present.
The ascending wedge that formed between 2009-2019 marked the beginning of the tech and AI bubble. This is where the crash box geometry was born. From the post-GFC recovery low, a wedge expansion opened up as new money flooded into emerging tech: cloud, mobile, early machine learning. The market transitioned from cautious recovery into structural overconfidence.
Notice how the crash box angles aren't arbitrary. They steepen proportionally with population growth, market participation, and innovation waves. The lower boundary (red fan) tracks the floor of each correction. The upper boundary (cyan channel) tracks the ceiling of each euphoric push. As more capital enters the system, the geometry compresses: steeper rallies, sharper corrections, faster recoveries.
The wedge annotated here shows the inflection point where the secular trend shifted from linear growth into exponential acceleration. That's the birth of the current cycle. Everything since has been operating inside this expanding geometry.
What's critical: price is now pressing against the $480 horizontal (the orange secular level) from above on the channel projection. This level acted as theoretical resistance for over a decade. It's now support. If a crash box activates and price revisits this zone, it represents a full reversion to the pre-acceleration trend.
Follow the Cube Cosmos Published Crash Box Idea for where this geometry projects next.
Time cycle theory on SPY by CUBE CosmosI've mapped time-cycle verticals across every major turning point since 2017. The intervals are consistent. Each crash was preceded by a "false bull" phase where price accelerated above the median line, sentiment peaked, and late buyers committed at the worst possible moment.
What I'm seeing now:
Price is pressing against the upper channel boundary at ~738. Brent crude just broke $100, 10Y yield at 4.70%, negative gamma regime confirmed, mega-cap earnings disappointing. The market has entered the same compression zone that preceded the 2020 and 2022 crash boxes.
The thesis:
The time cycle projects one more euphoric push higher before the next crash box activates. This is the distribution phase. The rally from here is not opportunity, it's the final rotation from smart money to retail. When the next vertical hits, the geometry repeats.
Invalidation: Sustained breakout above the upper cyan channel on expanding volume and breadth. If that holds for 3+ weekly closes, the cycle has broken.
This is Part 1. Follow for the crash box geometry and projected levels in Part 2.
The SPX confirmed the break down, but the QQQ hasn't yet!In this video I cover with my subscribers the SPX chart we have been studying and per our rules the SPX finally confirmed the break down but what's interesting is that the QQQ's have not yet confirmed the break down of the wedge pattern. Does it confirm tomorrow or these upcoming days? That is what I'm currently watching our for. There is evidence that the QQQ's may have one more move up based on other charts we have been looking at such as NVDA that has an inverse head and shoulders, mind you it has not triggered yet but the pattern is there and could be giving us bread crumbs of just one more move up before the next leg lower and have a bigger correction soon in the markets. A lot of semis have been beaten down and have not yet hade a big enough bounce and are also showing signs of one more bounce for then to petter out and go lower.
If you liked the video and are interested for more content like this consider subscribing for trade Ideas and I also go over trades that I take on and study. leave a comment and boost, what are your thoughts?
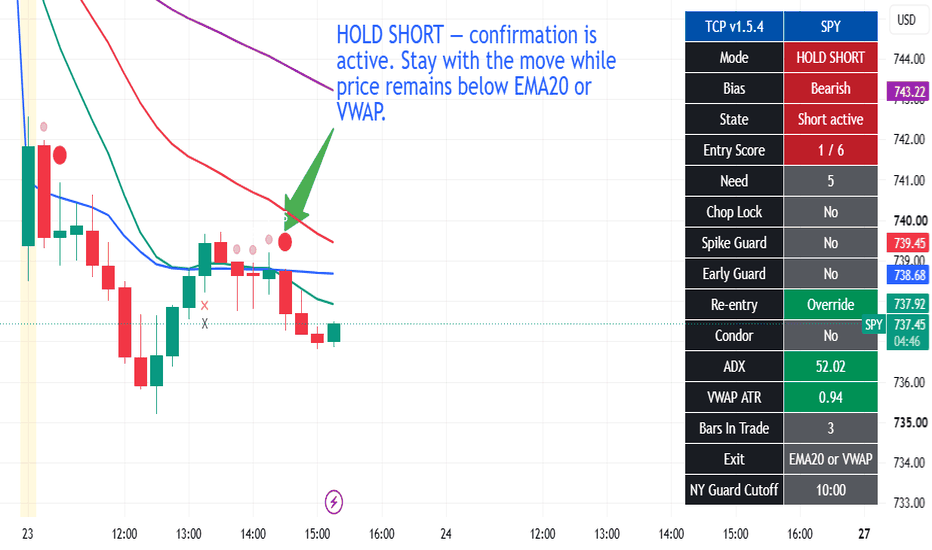
HOW-TO: Stay With the Clean TrendSPY — 15-minute chart
This chart shows a clean HOLD SHORT example using The Confirmation Project.
Price remained below VWAP and the fast moving averages while the dashboard showed:
• HOLD SHORT
• Bearish bias
• Short active
• Entry Score at confirmation level
• Bars In Trade: 3
The lesson is to wait for confirmation, then stay with the move while price continues to remain below EMA20 or VWAP.
This helps the trader avoid exiting too early during a clean directional move, while still respecting the script’s exit guidance if the trend begins to fail.
This is an educational decision-support example, not a recommendation to buy or sell SPY.
QQQ | Q3 2026 | Day ChartInvesco QQQ Trust, Series 1 ||
MARKET-BEATING SCORE = 8/10
Dividend yield (indicated)
0.43%
-----------------------------------
PEGY 0.90 — fairly valued.
EPS growth 36.0% — above-market.
Revenue growing 11.5% YoY — steady.
Gross margin 62.5% — strong moat.
FCF margin 28.4% — real cash generation.
D/E 0.45 — conservative leverage.
-----------------------------------
•
The fund is heavily concentrated in the 'Magnificent Seven' tech stocks, making it the primary vehicle for investors seeking exposure to AI and digital innovation.
•
QQQ has historically outperformed the S&P 500 over long horizons, notably turning a $10,000 investment at inception into over $125,000 by 2025.
•
The trust maintains a low expense ratio of 0.20%, making it a highly cost-effective way to gain exposure to large-cap growth stocks.
-----------------------------------
Multiple Time-Frame Analysis; Color Code | Strength favors the higher timeframe.
Yearly timeframe = black
Monthly timeframe = pink
weekly = grey
daily = red
4hr = orange
1hr = yellow
15min = blue
5min = green if they are shown. (Level visibility on intervals is set to timeframe the level was found on and below to keep chart view organized.)
** Candle Science explained **
A Range = two or more consecutive color candles.
There are two types of ranges - accumulation and distribution. **A single candle is a range on a lower timeframe. *Find the range and define its, creation dates, prices, and risk parameters. A range is broken down into 4 candle, which create 6 levels that define the range and illustrate market structure.
Focus only on the first and last candle of each range. The last candle of each type of range has two levels - see FS & Inv. FS Candles below.
DISTRIBUTION RANGES DEFINED:
When price is above a distribution range, these candles/levels act as support.
(BS) BACKSIDE Candle - First distribution candle in a distribution range. Expectation = strong reaction to price. long wicks reaching to or away from level. high angle accumulation trends, f.v,g's
(FS) FrontSide Candle - Last distribution candle in a distribution range. Expectation = reversal, create a low angle accumulation trend. The top of Distribution candles are used as support. The bottom of the FrontSide candle is the SwingLow of the range. The FS candle wants to protect the SwingLow. When/if Price Action closes below the SwingLow, the level is invalidated. Find another range to trade.
ACCUMULATION RANGES DEFINED: When price is below an accumulation range, these candles/levels act as resistance.
INVERSE BACKSIDE (Inv.BS) - First Accumulation candle in an accumulation range. Expectation. = strong reaction to price. long wicks reaching to or away from level. Creates high angle distribution trends, f.v.g, protects the Inv.FS candle
INVERSE FRONTSIDE (Inv.FS) - Last accumulation candle in an accumulation range. Expectation = reversal, create a low angle distribution trend. The bottom of Accumulation candles are used as resistance.
The top of the Inv.FrontSide candle is the SwingHigh of the range. The Inv.FS candle wants to protect the SwingHigh. When/if Price Action closes above the SwingHigh, the level is invalidated. Find another range to trade.
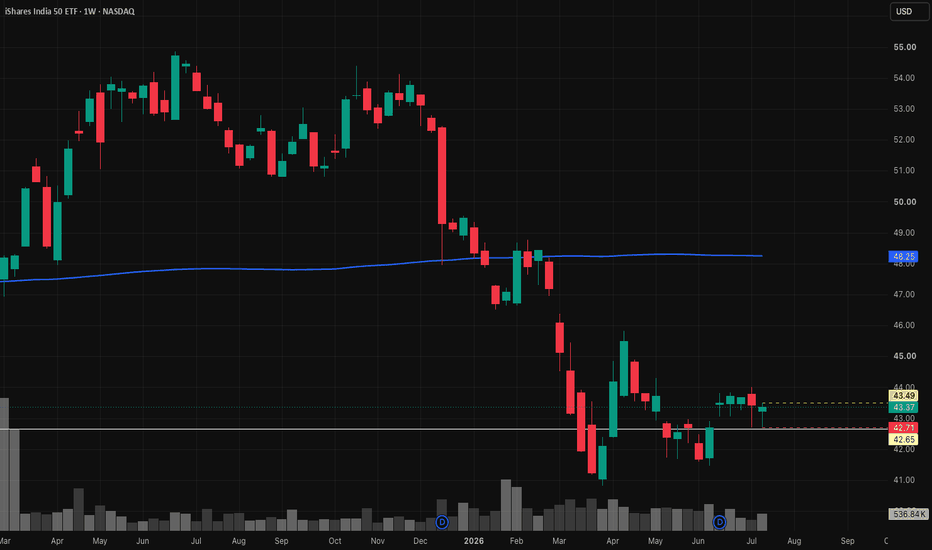
INDY | The time to go long has come- Timeframe: Weekly
- Trade type: Buy stop order
- Price: 43.49
- Take Profit: Open
- Stop Loss: 42.71 (-1.80 %)
Idea: Long on a breakout above last week's high - bullish momentum continuation.
Entry: Buy stop above last week’s high.
Stop-loss: Below the low of the same candle.
If the weekly candle closes below this level, the trade is invalidated.
Take Profit: Trailing stop following the lows of new weekly candles.
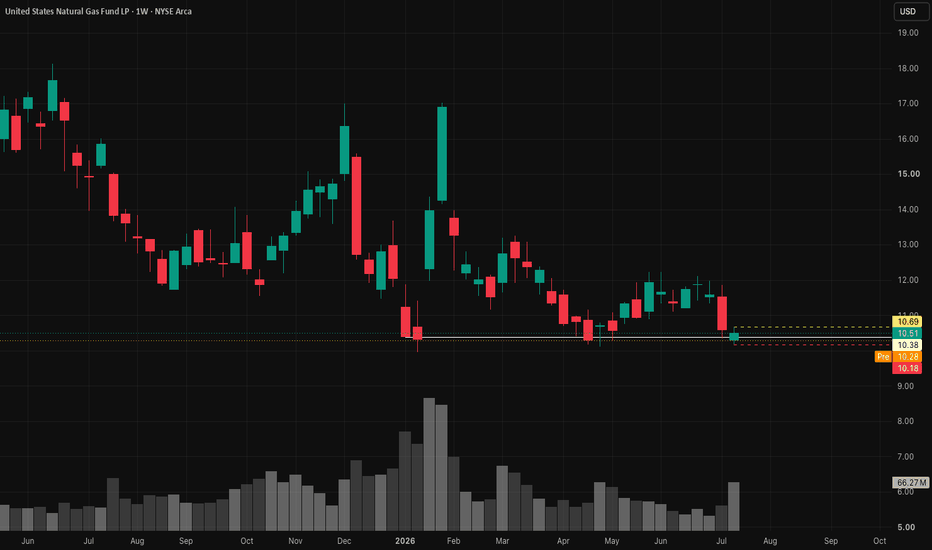
UNG | The time to go long has come- Timeframe: Weekly
- Trade type: Buy stop order
- Price: 10.69
- Take Profit: Open
- Stop Loss: 10.18 (-4.70 %)
Idea: Long on a breakout above last week's high - bullish momentum continuation.
Entry: Buy stop above last week’s high.
Stop-loss: Below the low of the same candle.
If the weekly candle closes below this level, the trade is invalidated.
Take Profit: Trailing stop following the lows of new weekly candles.
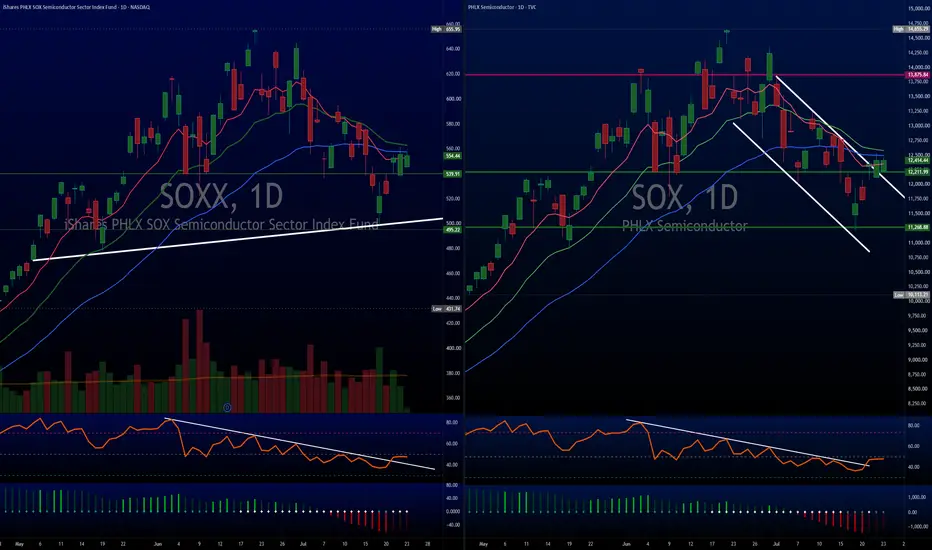
$SOXX Attempting a ComebackOptions Expiration Distortion
Volume is key. It’s a metric we give a lot of attention to.
We see a massive volume spike on Friday the 17th. However, it’s a classic quarterly/monthly options expiration noise. Relying on it as pure institutional accumulation is risky when market makers were just rebalancing and rolling delta exposure.
Volume Divergence
The lightened volume bars over the last few sessions after the 17th show buyers aren't aggressively pushing this bounce. It looks more like a low volume drift back toward moving averages than a decisive trend reversal.
Resistance & RSI
Price is attempting to reclaim the short term moving averages, for 3 days now! The RSI downtrend line break is technically intact, but it lacks slope and momentum. A sideways drift in price can artificially break a sharp RSI trendline without actual buying strength.
Conclusion
Limbo. This can go either way…
XLI | Continued growth ETF- Timeframe: Weekly
- Trade type: Buy stop order
- Price: 182.51
- Take Profit: Open
- Stop Loss: 177.60 (-2.70 %)
Idea: Long on a breakout above last week's high - bullish momentum continuation.
Entry: Buy stop above last week’s high.
Stop-loss: Below the low of the same candle.
If the weekly candle closes below this level, the trade is invalidated.
Take Profit: Trailing stop following the lows of new weekly candles.
SPY Is Back In The Middle Of Its Range.SPY Is Back In The Middle Of Its Range.
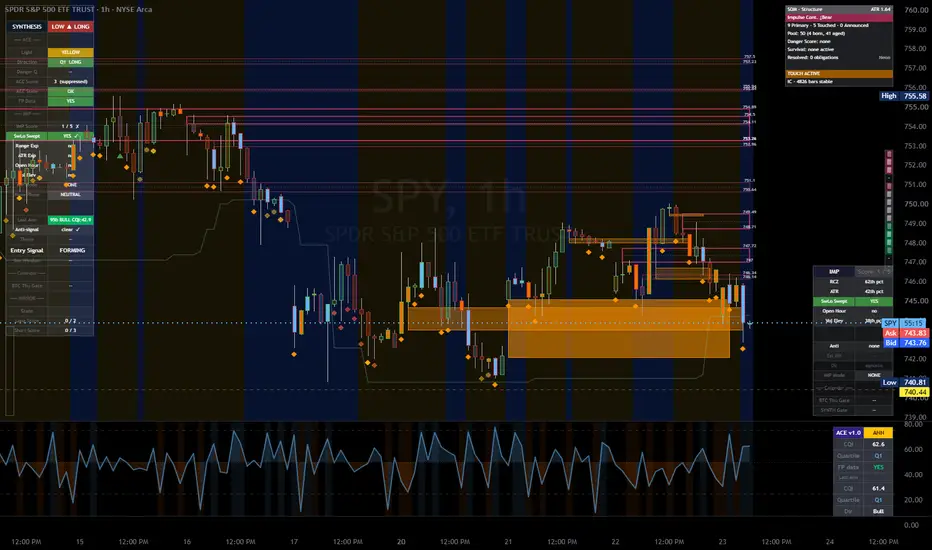
After the fourth failure at 748, SPY has faded to 743.53 and swept a low - right back into the middle of the range it has held for over a week. The structure is the same as it has been: a bull thesis with top-quartile conviction on the hourly, entry forming, but no ability to close above 748 and no reason to break 740.44 either. The swept low is the one new wrinkle - a liquidity grab near the bottom of the range can precede a bounce. But nothing has triggered. Range between 740.44 and 748, still. Neutral.
Resistance: 747.72 - first level back
Key resistance: 748.00 - the trigger, unbroken in four tries
Current price: 743.53
Support: 740.81 - the swept low
Key support: 740.44 - the range floor
Structural floor: 736.87 - deeper support
Two paths from here:
The swept low bounces and takes another run at 748. If the grab near 740 holds and conviction pushes price back up, this becomes a fifth attempt at the trigger - and each failed test theoretically clears sellers for the eventual break. Top-quartile conviction is still there for it.
The range floor finally gives. Four failures at the top can also mean the range is tired and resolves down. A loss of 740.44 on a close breaks the floor that has held all week and opens 736 and below. That would flip the leanable setup to the short side.
SPY is doing the same thing it has done all week - failing at 748, holding above 740.44, swept a low in between. Until one edge goes on a close, it is a range, and four failures at 748 keep the burden of proof on the bulls.
Built with SYNTHESIS v3.3 | SOM / ACE / IMP / SYNTHESIS
Study, not financial advice.
Research 23.07.2026🌏 Markets:
AMEX:SPY -4.04 -0.54%(pre/m)
NASDAQ:QQQ -5.08 -0.72%(pre/m)
🆕 Economic News:
08:30 USA – Chicago Fed National Activity Index
08:30 USA – Initial Jobless Claims
📈 Gap Ups
Reaction to earnings/guidance:
NYSE:ALLE $COC NYSE:AMBP NYSE:CLF NYSE:URI NASDAQ:ROP NYSE:NOW NYSE:WST NYSE:CX NYSE:WEX NYSE:LMT NYSE:TECK NYSE:DGX NYSE:TMO NYSE:RTX NASDAQ:POOL NASDAQ:CSX EURONEXT:TTE NASDAQ:HON NYSE:RELX NASDAQ:CMCSA NYSE:WCN NYSE:EQNR
Other news:
NYSE:SKM To Invest 750 Billion Won By 2030 To Launch Sk Hyper, Strengthen Ai Data Center Business
Wall Street brokerage Benchmark remains bullish on NASDAQ:HUT stock.
-- Needham lifts NASDAQ:HUT target to $145 after second Beacon Point AI lease.
Top memory stocks jumped in overnight trading late Wednesday after NASDAQ:GOOGL parent Alphabet, Inc. reported a sharp increase in quarterly capital expenditures and raised the forecast for the full year. : NASDAQ:MU NASDAQ:SKHY NASDAQ:WDC
Shares of AI infrastructure providers rose in the extended session as Alphabet's NASDAQ:GOOGL management indicated on the earnings call that the company would be utilizing third-party providers of computing power to ease constraints. : NASDAQ:NBIS NASDAQ:CRWV
Anthropic will buy a large number of AI chips from NASDAQ:AMD — WSJ.
-- NASDAQ:AMD will invest $5 billion in Anthropic.
📉 Gap Downs
Reaction to earnings/guidance:
NASDAQ:TSLA NASDAQ:GOOGL NYSE:IBM NASDAQ:TMUS NYSE:ROL NYSE:STM NYSE:MOH NYSE:DOV NASDAQ:QS NSE:INFY NASDAQ:MBLY NASDAQ:HBAN NASDAQ:AAL NYSE:BX NYSE:FCX NYSE:PCG IG:DOW
Other news:
NYSE:NVO Takes Rival NYSE:LLY to Court Over Weight-Loss Ad Claims
AI spending drove Alphabet NASDAQ:GOOGL to negative free cash flow in Q2 2026 for the first time in the company’s history — earnings report.
Trump’s Boeing NYSE:BA deal with China is under pressure — Politico.
NASDAQ:AMZN is cutting jobs in its AI division.
‼️ Additional
It is time to pass the CLARITY Act — Goldman CEO.
The number of newly registered Tesla NASDAQ:TSLA vehicles in the EU rose 72% in June — ACEA.
The EU approved the Warner Bros. NASDAQ:WBD and Paramount NASDAQ:PSKY merger.
NYSE:JNJ received FDA approval for a soft-tissue surgical robot.
The EU is prepared to introduce countermeasures against the US if tariffs are raised — Politico.
📋 List of tickers involved:
NYSE:ALLE $COC NYSE:AMBP NYSE:CLF NYSE:URI NASDAQ:ROP NYSE:NOW NYSE:WST NYSE:CX NYSE:WEX NYSE:LMT NYSE:TECK NYSE:DGX NYSE:TMO NYSE:RTX NASDAQ:POOL NASDAQ:CSX EURONEXT:TTE NASDAQ:HON NYSE:RELX NASDAQ:CMCSA NYSE:WCN NYSE:EQNR NYSE:SKM NASDAQ:HUT NASDAQ:GOOGL NASDAQ:MU NASDAQ:SKHY NASDAQ:WDC NASDAQ:NBIS NASDAQ:CRWV NASDAQ:AMD NASDAQ:TSLA NYSE:IBM NASDAQ:TMUS NYSE:ROL NYSE:STM NYSE:MOH NYSE:DOV NASDAQ:QS NSE:INFY NASDAQ:MBLY NASDAQ:HBAN NASDAQ:AAL NYSE:BX NYSE:FCX NYSE:PCG IG:DOW NYSE:NVO NYSE:LLY NYSE:BA NASDAQ:AMZN NASDAQ:WBD NASDAQ:PSKY NYSE:JNJ
Best regards – hi2morrow team.
XLU Bullish Divergence: Utilities Are Starting to Show StrengthXLU is showing improving momentum after forming a bullish divergence on the Stochastic Oscillator near the June low. More recently, price has held a higher low while Stochastic revisited a lower level—another constructive sign that selling pressure may be weakening.
Price is now testing the $45.60–$45.70 resistance area. A decisive close above this zone could confirm renewed strength and open the way for a continuation toward the previous swing highs. The rising trendline and the $44.40–$44.50 support area remain important for maintaining the current structure.
In the Sniper Alpha framework, we follow a sector-first, stock-second process:
Identify a sector showing improving price structure and momentum.
Screen individual stocks within that sector.
Focus on stocks building strong bases near resistance.
Wait for a confirmed breakout before considering an entry.
Define risk and manage the position with a structured stop plan.
Our screening has already identified several stocks within the Utilities sector showing constructive setups. However, a bullish divergence is an early signal—not confirmation by itself. The next step is to watch whether XLU can break and hold above resistance while the strongest individual names confirm the sector move.
For educational purposes only. This is not financial advice.
Chart Pattern Analysis Of NVDA
K4 failed to break up the neckline of a potential bullish head-shoulder pattern.
It seems that the market will consolidate around the support and then choose to break up or fall down.
If K5 is another long-green candle like K4,
It is likely that another bull run will start here.
If not,
It is likely that the market will fall to test the support for more times.
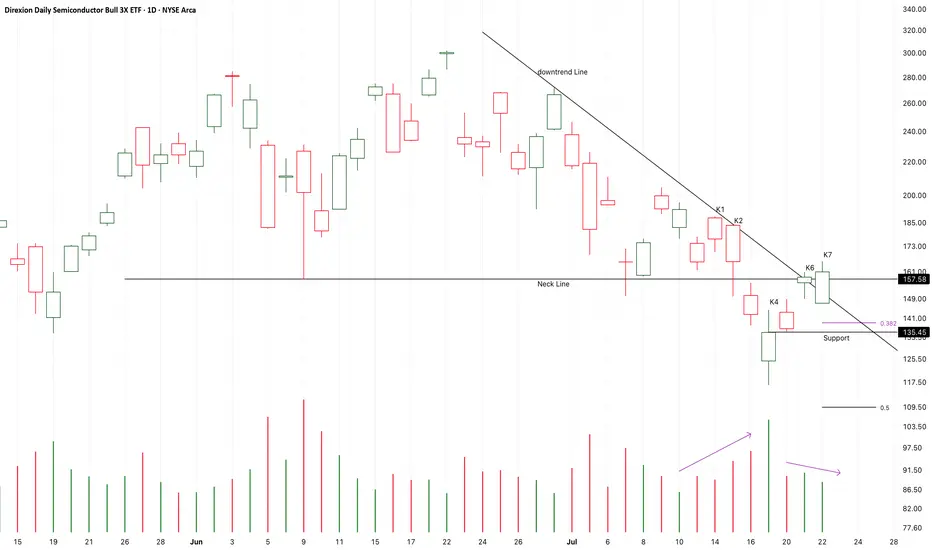
Chart Pattern Analysis of SOXL.
After the market breaking down the neck line of a potential bearish double top pattern,
K6 is a first test to the neck line,
K7 failed to close at lower price area.
It seems that the market will consolidate around the neckline,
And then, the market will choose to break up or expand down.
I am expecting a fake down of the market at K4.
I am still optimistic to the bullish market.
If the market successfully close upon K1 or successfully retest the support,
It is likely that another bull run will start here.
On the other hand,
If the following candles break down the support,
It is likely that another bull run will start here and accelerate.
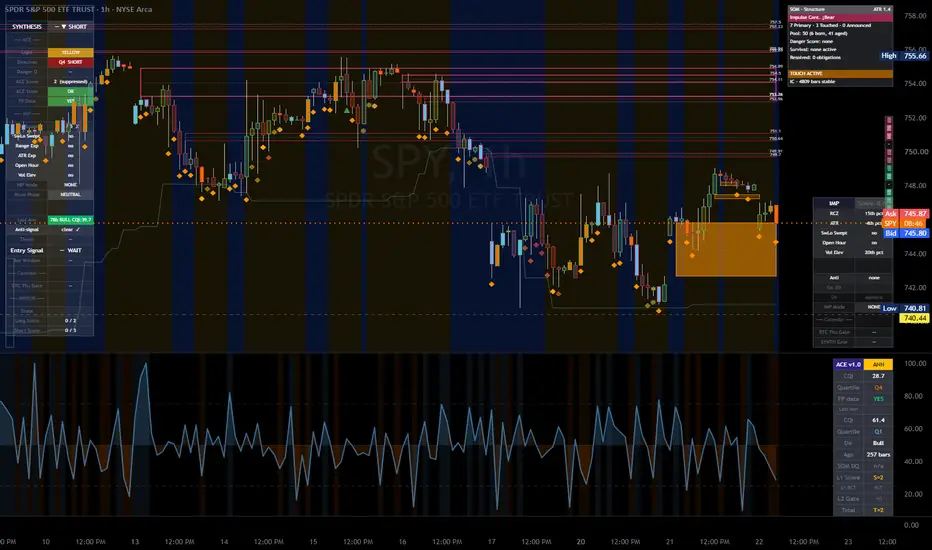
SPY Closed The Gap To 748 - Still No Break.SPY Closed The Gap To 748 - Still No Break.
SPY pushed up to the 748 area and is trading 746, the closest it has held to the trigger yet - but it still has not closed above it. The daily structure is bull with a 235-bar bull print standing and conviction firm, though the hourly cooled back to neutral on the approach. This is now the fourth run at 748 without a confirmed break through. The story has not changed: the level is the event, and the level has not gone. Until it closes above 748, the honest read stays a range between 740.44 and 748. Neutral.
Resistance: 748.00 - the trigger, still unbroken
Key resistance: 751.00, then the 755.66 ceiling
Current price: 746.16
Support: 744.00 - first support
Key support: 740.44 - the range floor
Structural floor: 739.34 - the swept low
Two paths from here:
748 closes above and the range resolves up. A confirmed break with the daily bull print standing opens 751 and the 755.66 ceiling, and it is the event that would finally earn a directional call on the one name where breaks carry an edge. It is one point away; it just has to close there.
748 caps it a fourth time. Four failures at the same level is a genuine ceiling, not noise. A rejection here sends price back toward 740.44, and the range that has held for over a week stays intact.
SPY has closed the distance to 748 but still has not closed through it. One point away is not the same as above. The range is the range until the level breaks on a close.
Built with SYNTHESIS v3.3 | SOM / ACE / IMP / SYNTHESIS
Study, not financial advice.