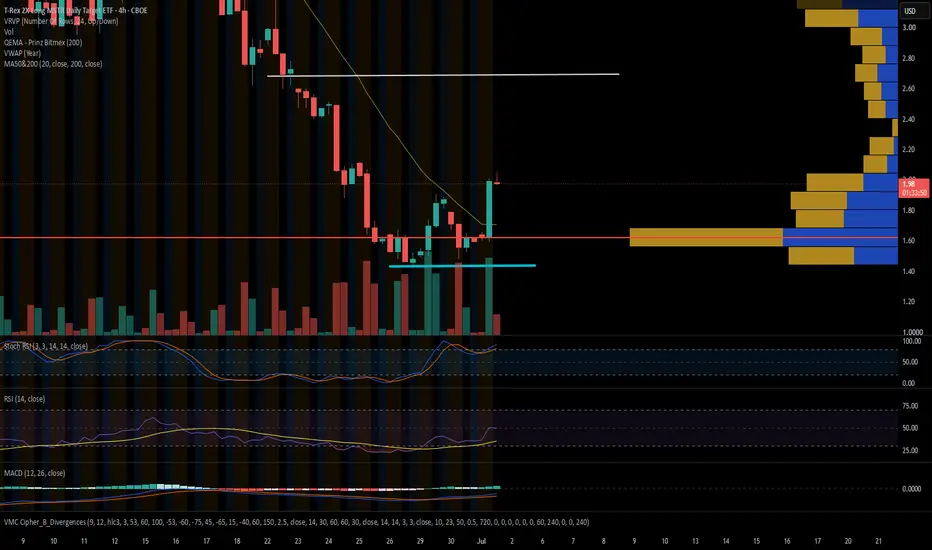
Long
Long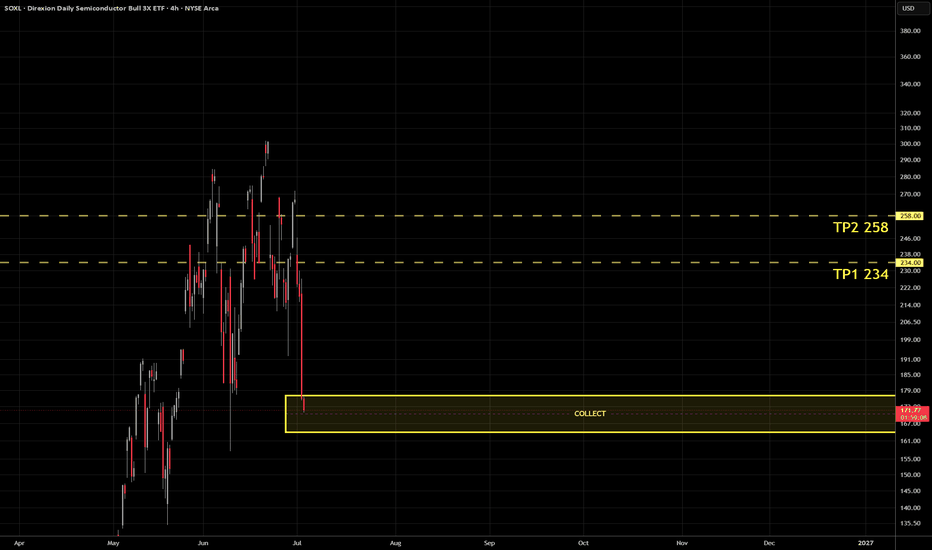
 Short
Short
Short 
Semiconductor Breakdown vs. $DJI StrengthThe Great Rotation Seems Real
The Call:
Semiconductor Weakness Playing Out
The alarm we sounded on the semiconductor sector is actively executing. Looking at the iShares Semiconductor ETF ( NASDAQ:SOXX ) on the daily chart, price action is heavily threatening its intermediate blue EMA support.
The Confirmation Bars:
Those three massive institutional distribution volume bars we flagged back in June were the real deal. They signaled that big funds were quietly hitting the exits while retail was buying the highs.
4 Hour Breakdown:
On the 4 hour chart, the fast EMAs (Exponential Moving Avgs > RED & GREEN) are on the verge of a definitive bearish crossover, and the TTM Squeeze momentum has flipped completely negative. If the daily green and blue moving averages give way, those lower structural gaps remain the primary target.
The Pivot:
Capital is Rotating, Not Fleeing
While the tech/chip sector is flushing, look at the Dow Jones Industrial Average ( TVC:DJI ) showing massive relative strength, trading up.
This stark divergence tells you everything you need to know about current market structure:
This is not a liquidity panic or a systemic market meltdown.
This is a textbook capital rotation out of heavily overextended, high beta tech names directly into cyclical, value, and defensive blue chips. Only issue might be $INTC.
Conclusion
The bearish divergence we caught on the NASDAQ:SOXX RSI and Chaikin Money Flow gave us the perfect heads up. Protect your tech capital, but don't short the entire market blindly money is simply changing addresses.
SPY: two clocks, one date (Time@Mode and the oil-earnings lag)GM gentlemen,
Near term this is constructive. AMEX:SPY has gone four weeks without a new low, the daily downtrend is dismantled, and a weekly uptrend triggers at 762.59 this week. SP:SPX is holding above the first Warsh FOMC key level.
June payrolls missed hard (57k, less than half of consensus), but the tape read it as a timing reprieve, not a pivot: the market still fully prices a Fed hike, it just slid from October to December, with wages firm and revisions up. So the near-term bias is constructive into the next Fed meeting, and the hawkish line holds behind it.
The catch is timing. My monthly Time@Mode read has room only into September. The overlay on this chart, an oil-to-earnings lag model, points at the same window from a completely different input: it reads oil's trailing 6-month move and projects the earnings impact two quarters later. A big surge becomes an earnings headwind on the index about six months on. The Hormuz supply shock that started in late February, landing into the thinnest inventory buffer on record, is exactly that kind of surge, and it lines up to paint a headwind around September.
Two independent variables, one date. So I read this bounce as a relief to trade with a leash, not a new bull leg. Base case: a correction or a top by September, as the oil-lag drag lands and the monthly clock runs out. The jobs miss just showed the Fed will not blink easily, a hike moved later but not away, so I do not expect a cut to cushion the second half.
Levels and structure:
762.59: the weekly uptrend trigger this week. Bias turns constructive above it.
First Warsh FOMC key level: the line that has capped the move. Holding above keeps the relief alive.
Monthly Time@Mode: room into September, then the timing expires.
Invalidation of the cautious lean: a sustained oil rollover that keeps the lag model from ever crossing into headwind, or a clean monthly breakout that resets the count. Short of that, I am watching for the September top.
Best of luck!
Cheers,
Ivan Labrie.
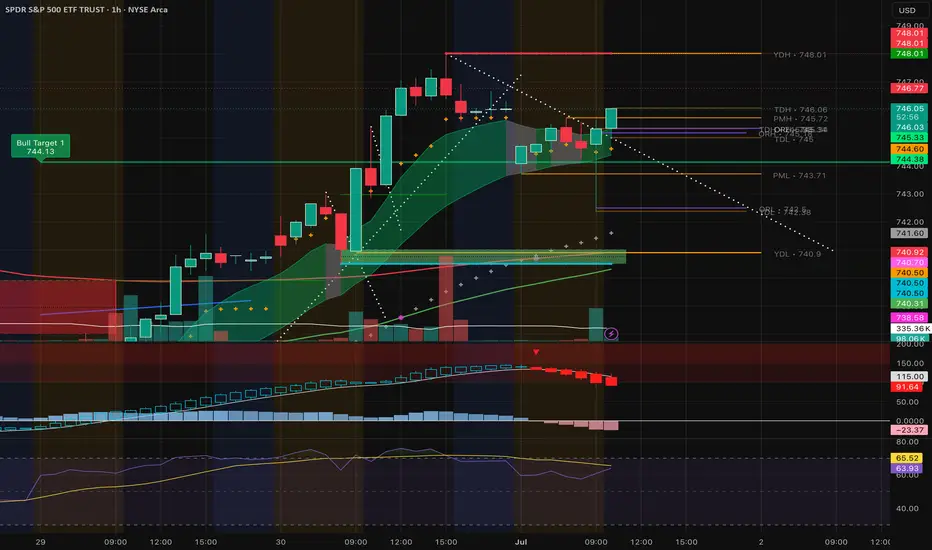
S&P 500 (SPY) Professional Market OutlookSPY (S&P 500 ETF) | Today's Intraday Trading Scenario
The SPY begins today's session at a technically important level, with price consolidating after recent volatility. The market remains in a short-term corrective phase, but buyers continue to defend key support, preventing a deeper decline. Today's price action is likely to be driven by whether SPY can reclaim immediate resistance or lose its current support zone.
Market Structure
The 1-hour trend remains neutral-to-bearish in the short term as lower highs continue to develop. However, selling momentum has slowed, suggesting that institutional participants are waiting for fresh catalysts before committing to the next directional move.
This creates an ideal environment for breakout traders rather than range traders.
Bullish Scenario 📈
If SPY successfully breaks above the immediate resistance with strong buying volume, short covering and momentum buying could fuel a fresh rally.
Bullish Confirmation
Strong candle close above resistance
Rising volume
Higher highs and higher lows on lower timeframes
Potential Targets
🎯 Target 1: 747
🎯 Target 2: 752
🎯 Target 3: 753
A sustained breakout would indicate that buyers have regained short-term control.
Bearish Scenario 📉
Failure to reclaim resistance followed by a breakdown below today's support could accelerate selling pressure.
Watch for:
Lower highs
Breakdown below intraday support
Increasing selling volume
Potential Targets
🎯 Target 1 : 743
🎯 Target 2 : 741
🎯 Target 3 : 739
If sellers dominate below support, momentum traders may continue to press the downside.
Trading Strategy
✅ Buy only after a confirmed breakout above resistance.
✅ Sell only after a confirmed breakdown below support.
❌ Avoid entering trades in the middle of the current range, where false breakouts and whipsaws are more likely.
Patience often delivers better risk-to-reward opportunities than trying to predict the market's next move.
Risk Management
Risk only 1–2% of trading capital per position.
Always define your stop-loss before entering a trade.
Allow price action—not emotions—to confirm your setup.
Protect profits by trailing stops once the trade moves in your favor.
Key Observation
Today's session is shaping up as a decision day rather than a trend day—until price decisively leaves its consolidation range. Traders should remain disciplined, wait for confirmation, and avoid forcing trades during low-conviction price action. Short 
SPY's Standoff Enters A Third Day. Nobody Has Blinked.SPY's Standoff Enters A Third Day. Nobody Has Blinked.
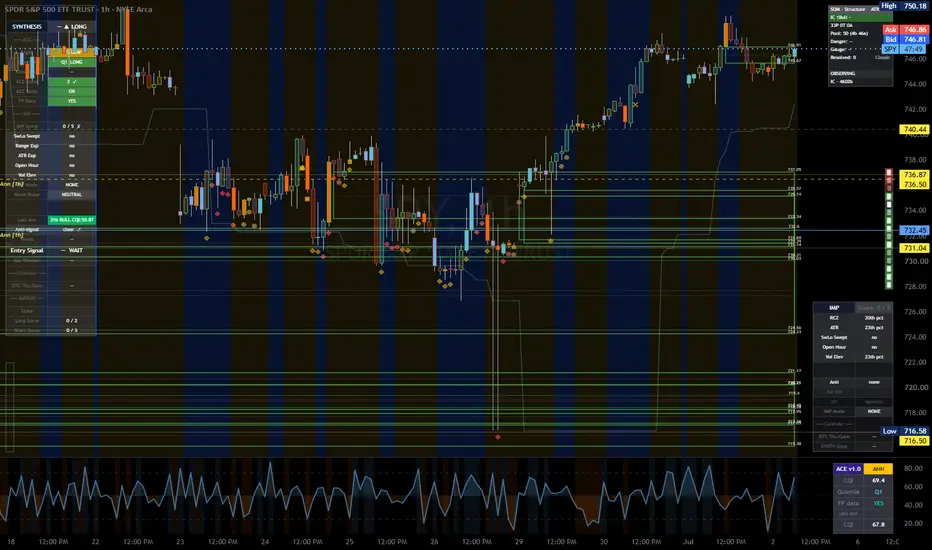
SPY is holding just under 746 for a third straight session, unable to break the 751 band overhead but refusing to sell off either. The daily has been signaling a downside move for three days now, with the setup loaded most of the way, yet the bullish anchor that has held for months still hasn't cracked. The near-term upward push that carried price into resistance is fading - the buyers have gone quiet. Price is pinned between a short that will not fire and a long that has run out of steam.
Resistance: 748-751.47 - the band that has capped three sessions
Key resistance: 756.68 - the cycle high
Current price: 746
Support: 740.44 - first shelf below
Key support: 736.50-732.45 - the recovery base
Structural floor: 716.50 - the operative low this cycle
Two paths from here:
The daily short finally fires. The downside setup is loaded at 3/5 with the swing low swept and range expanded, held back only by a 222-bar bull print that will not break - short score is still 0/3 after three sessions of pressure. If that print cracks and price loses 740.44, the 736.50-732.45 base is first, then 716. The estimated edge reads negative, the system's way of saying the loaded short still is not clean.
The band finally gives. A push through 751 with the bull anchor intact opens the 756 cycle high. But the near-term long read has already faded from a clean directional signal back to neutral, and volume sits at the 4th percentile - there is nothing behind a breakout attempt right now. Without buyers showing up, price stays pinned under the band.
Three sessions, same picture, each day a little more compressed - the short machinery holds at loaded, the bull print ages another bar without breaking, and price coils tighter under 751. Range compression at the 94th percentile says this does not stay quiet much longer. The direction it resolves is still the 222-bar print's call to make.
Built with SYNTHESIS v3.3 | SOM / ACE / IMP / SYNTHESIS
Study, not financial advice. Research 02.07.2026🌏 Markets:
AMEX:SPY +1.03 +0.14%(pre/m)
NASDAQ:QQQ +0.03 0.00%(pre/m)
🆕 Economic News:
08:30 USA – Non Farm Payrolls
08:30 USA – Unemployment Rate
08:30 USA – Initial Jobless Claims
08:30 USA – Average Hourly Earnings
10:00 USA – Factory Orders
📈 Gap Ups
Reaction to earnings/guidance:
Other news:
HOSE:HCM Announces NMPA Approval for ORPATHYS for the treatment of Gastric Cancer Patients with MET Amplification
FBI Director Kash Patel Amends Disclosure to Add NASDAQ:MSTR Stock Purchase
NYSE:CRCL upgrades:
-- Compass Point / Sell → Neutral / Price target $55
-- Susquehanna / Neutral / Price target $69
NYSE:NOW upgrade: Guggenheim/ Neutral → Buy / $125
CRYPTOCAP:BTC breaks above its 2-week downtrend and updates 6-day highs, reaching $61,200. NASDAQ:COIN NASDAQ:MSTR NYSE:BMNR
NASDAQ:HOOD Expands Into European Derivatives, Targets UK Crypto Market / Robinhood Claims It Just Broke An AI Guinness World Record
NASDAQ:ABVX Stock Eyes Over Six-Month High As Investors Double Down On Abivax's Lead Drug Bet
Wedbush Calls NASDAQ:AVAV and NASDAQ:KTOS Long-Term Winners In Defense Tech
NASDAQ:PLTR announced a new strategic initiative with Nvidia to build custom artificial-intelligence models for the U.S. government on Monday.
📉 Gap Downs
Reaction to earnings/guidance:
Other news:
NASDAQ:GOOGL lost a €4.1 billion antitrust court battle in the EU.
NASDAQ:OUST offering of 3,621,876 shares / price of $55.22 with total $200mln.
Memory chip stocks continued to drop in overnight trading after sharp declines on Wednesday as investors booked profits after the recent rally and institutional funds rebalanced their portfolios at the start of the year's second half. NASDAQ:MU NASDAQ:SNDK NASDAQ:STX NASDAQ:WDC AMEX:KORU CBOE:DRAM CBOE:RAM
NASDAQ:TEM : Gray Media and Blue Media, both related to CEO Eric Lefkofsky, sold a combined 166,250 Class A shares
NYSE:FPS Announces Pricing of Upsized Public Offering price of $49.00 per share. The offering consists of 43,650,000 shares with total $2.2bln
NASDAQ:IREN Announces $687M Stock Grants To Co-CEOs
NYSE:BABA to pay $600M to settle allegations it allowed illegal drug and equipment sales
‼️ Additional
Fed Chair Kevin Warsh refused to hint at a July rate hike at the ECB forum, but said inflation is “too high” — CNBC.
Goldman expects further S&P 500 growth in the second half of 2026 — BBG TV.
The US refused to extend the USMCA trade agreement with Canada and Mexico.
-- Trump had previously said that the free trade agreement between the US, Canada, and Mexico, signed in 2018, is expiring and that he is not interested in the document’s future.
Pentagon: The US has failed to properly focus on developing its defense industrial capacity for 30 years.
-- Hegseth previously said US military spending will reach a record $1.5 trillion in 2027.
-- Rubio said the US intends to increase defense spending to 5% of GDP.
-- Israel wants to give up US financial aid as early as this year — Netanyahu.
A round of indirect US-Iran talks will take place after the funeral of former Iranian Supreme Leader Ali Khamenei — Qatar Foreign Ministry.
OpenAI may give the Trump administration a 5% stake — FT.
🔀 Spin-Off
NASDAQ:MIDD – Middleby / Midera Food Processing
Middleby’s board formally approved the spin-off of its Food Processing business, Midera Food Processing. Midera will become an independent pure-play food processing technology company focused on equipment, automation and service solutions for protein, bakery and snack processing customers.
Parent Company: NASDAQ:MIDD – The Middleby Corporation
Spin-Off Company: Midera Food Processing, Inc.
Distribution Ratio: 1 Midera share for every 1 Middleby share
Record Date: June 26, 2026
Distribution Date: July 6, 2026
Expected Tax Treatment: tax-free for U.S. federal income tax purposes
Key point:
Middleby becomes more focused on commercial foodservice and kitchen solutions, while Midera becomes a standalone food processing automation and equipment business.
Comparable public companies: GETTEX:JBT , NYSE:ITW , NYSE:DOV , NSE:IEX , NYSE:SPXC , NASDAQ:MIDD
📋 List of tickers involved:
HCM NASDAQ:MSTR NYSE:CRCL NYSE:NOW CRYPTOCAP:BTC NASDAQ:COIN NYSE:BMNR NASDAQ:HOOD NASDAQ:ABVX NASDAQ:AVAV NASDAQ:KTOS NASDAQ:PLTR NASDAQ:NVDA NASDAQ:OUST NASDAQ:MU NASDAQ:SNDK NASDAQ:STX NASDAQ:WDC NASDAQ:TEM NYSE:FPS NASDAQ:IREN NYSE:BABA NASDAQ:MIDD GETTEX:JBT NYSE:ITW NYSE:DOV NSE:IEX NYSE:SPXC NASDAQ:GOOGL
Best regards – hi2morrow team.
$DBA — Six-Year Uptrend, EMA Pullback, Three Scale-Out TargetsAMEX:DBA , the Invesco DB Agriculture Fund, has been in a confirmed long-term uptrend since the 2020 pandemic low at $13.19. Current price $26.91. The 50-week EMA remains above the 200-week EMA at $24.45, confirming the long-term structural trend is intact.
The current technical condition
Price has pulled back from the 2025 high of $28.84 toward the 8 and 21 EMA cluster, which is currently providing weekly support in the $26.63 to $26.89 zone. The DeMarker on the weekly has been declining from elevated readings and is approaching the zone where previous buying pressure has resumed on this chart. It has not yet reached deeply oversold levels, which means the ideal entry window for the final tier is still developing.
The setup structure
Entry: first tier at current levels around $26.91, building toward additional tiers on further DeMarker decline toward oversold.
Stop: daily close below $25.09. Below this level the EMA support structure breaks and the short-term technical thesis is invalidated.
Target 1: $27.58 — first partial scale-out, approximately half the near-term ATR above current consolidation zone.
Target 2: $30.74 — second partial scale-out, prior resistance extension above the 2025 high of $28.84.
Target 3: $35.80 — full measured move target, approximately 50% of the weekly ATR move from the 200-week EMA base.
What to watch
The DeMarker confirmation is the key timing signal for additional tier entries. A DeMarker reading below 0.3 beginning to turn upward while price holds the weekly EMA support zone is the condition that would justify accelerating position building. Without that confirmation, additional tiers wait.
The 200-week EMA at $24.45 is the longer-term accumulation zone if price continues lower through the current support. The 50-week above the 200-week throughout any pullback to that level would maintain the structural long entry thesis.
A pullback to any EMA level is not automatically a buy. The DeMarker confirmation and the trend structure together define the entry, not the level alone.
Not financial advice. All levels are for analytical purposes only.  Long
Long
 Long
Long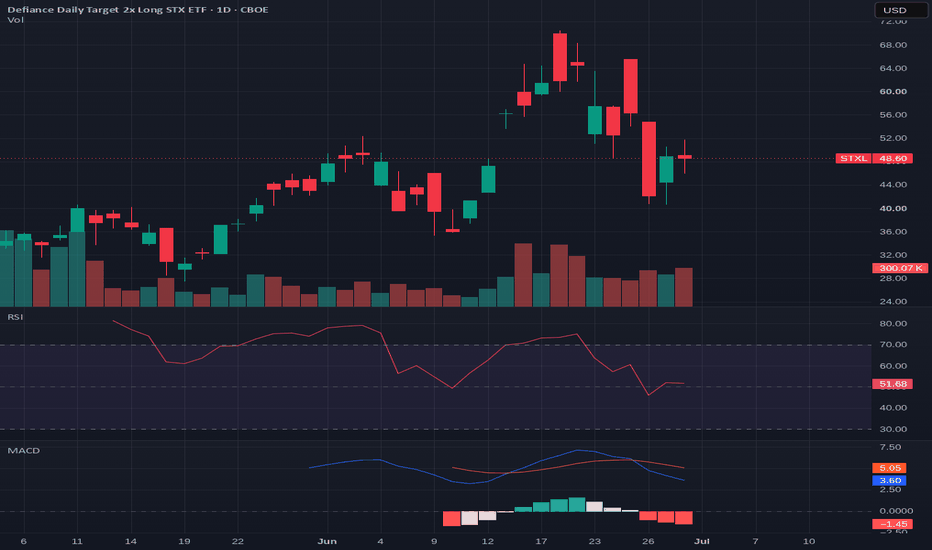
 Long
Long
 Long
Long
Long 
 Long
Long
Long 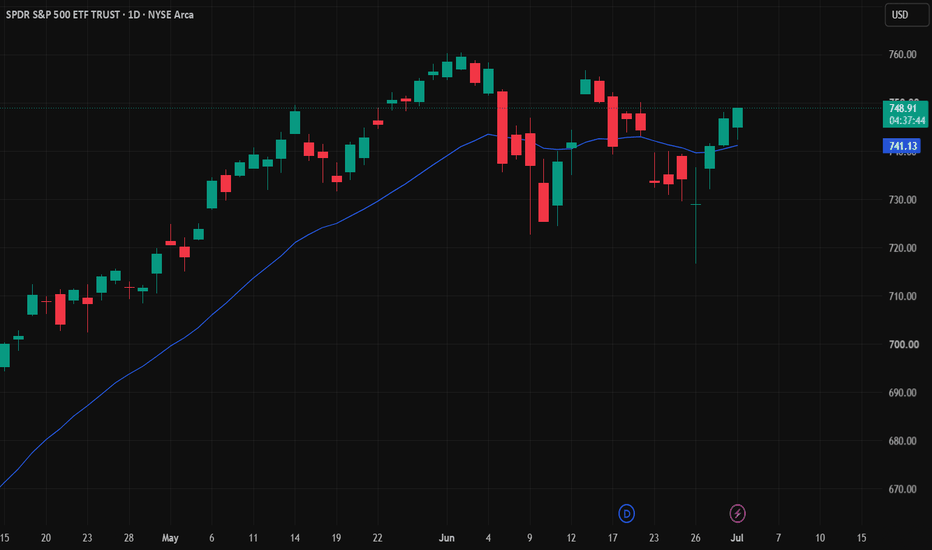
Short