Opening (Delta Hedge): EWZ Nov 27th 38/43/48/55 Iron Condor... for a 2.21 credit.
Comments: With my position net delta skewing badly short, my delta/theta ratio far over 1.0, and with negative extrinsic in the position, selling a net delta long skewed iron condor here to reduce directionality. (I've already done the obvious thing of rolling up the untested put side/inverting to collect additional credits and improve my call side break even).
Position delta/theta at -21.70/4.39.
I'm fine with remaining net delta short here (it is, after all at 52-we
ETF market
Opening: QQQ Nov 13th 708/718/2 x 800/805 Iron Condor... for a 3.36 credit
Comments: My weekly delta neutral iron condor in the broad market ETF (SPY, QQQ, IWM) with the highest IV.
Metrics:
Max Profit: 3.36
Max Loss/Buying Power Effect: 6.64
ROC at Max: 50.6%
ROC at 50% Max: 25.3%
ROC at 10% of the Width of the Widest Wing Take Profit: 15.1%
market breath is not great but index's are up I'm assuming these areas would be active today, a bit of a range of the top of all times or highest of all times and overall I guess the market breadth is not great but it is getting better and better. I think stuff is moving on assumption and news over the Iranian conflict. So you can see the marine transportation branch is seemingly very strong. Also the oil related, fuel related stocks are seemingly setting up for an breakout to the high or highest of the their own high. So overall these are
SPY Is Pressing The 779.37 August High Again.SPY Is Pressing The 779.37 August High Again.
SPY is trading near 779.10 premarket, just under the 779.37 August high. Friday traded to 779.42 and closed at 778.57, the second time in a week it has traded through that line without closing above it. The hourly structure is choppy with a bearish tilt, the hourly light is yellow and a high-sweep anti-signal is active. On the 4H the structure is impulse continuation to the upside, the light is green, and the last 4H announcement, from last Monday,
Research 12.10.2026🌏 Markets:
AMEX:SPY +0.29 +0.04%(pre/m)
NASDAQ:QQQ -1.18 -0.16%(pre/m)
🆕 Economic News:
Wall St futures little changed on Columbus Day as oil swings and investors look ahead to big banks' earnings and Wednesday's CPI
12:50 USA – Fed Hammack Speech
📈 Gap Ups
Other news:
NASDAQ:CCC jumps after Bloomberg reported that GTCR and Elliott are in advanced talks to acquire the company; a deal could be announced as soon as this week
NASDAQ:TRAX surges after positive top-line resu
SPY: $782 Breakout or CPI Trap? | Oct 12–16
SPY enters the week recovering toward its recent high, with inflation and earnings set to test the move. CPI arrives Wednesday, October 14, followed by PPI Thursday, both at 8:30 AM Eastern. JPM’s Tuesday report also provides an early read on earnings and economic conditions.
My focus is whether SPY can turn $780 into support and clear $781.62–$782. The recovery is constructive, but the overnight advance still needs regular-session confirmation.
Daily timeframe
The daily chart shows a strong
$QTUM Trading Near Apex of Symmetrical TriangleNASDAQ:QTUM continues to consolidate within a symmetrical triangle and is approaching the apex. Price remains compressed between rising support and descending resistance, suggesting a breakout may be approaching.
A confirmed breakout above the $158 resistance zone could open the door for a move toward the measured target near $204.
Until then, this remains a watch-and-wait setup as volatility continues to contract.
Not financial advice. Manage risk accordingly.
SPY Sunday Night Market Prep - October 12SPY enters the week near $778.57, with Friday’s recovery bringing price back toward an important decision area. My preference leans bullish, but a recovery into resistance still needs confirmation. Buyers have an opportunity to continue the advance. Now they need to show they can hold the ground they gain.
This week brings inflation data, bank earnings, semiconductor updates, and an ongoing energy and geopolitical backdrop that can change sentiment quickly. There are several ways this can unfol
Early Top Warning: Prepare To Protect Your Capital.My research suggests a major Rollover Top is likely to setup between Nov 20 and Dec 15.
My custom Index charts are designed to highlight unique conditions in the markets related to strength, trend direction, tops/bottoms, and more.
Right now, the EARLY TOPPING trigger is FIRING - telling me the markets are moving into an EARLY TOP WARNING.
That means we need to start protecting capital and paying very close attention to whether this TOP pattern continues.
I've created this video to try to
Spy updateLast time I did a spy idea I highlighted that Cyclicals, AMEX:IWM , TVC:DJI and TVC:NYA were about to correct via bearish broadening wedge..
Since then
TVC:DJI -6%
TVC:NYA ,-6%
AMEX:IWM -8%
AMEX:XLF - 8%
Now I think the opposite is about to happen and those stocks, indexes and sector will outperform over the next 2 years
TVC:DJI
Bounced off support, Closed back over 20ma , bullish daily candles
AMEX:IWM
Same structure, but didn't close back above 20ma YET
T
Oct till JanNot financial advice. This is how I read Martin Armstrong’s Socrates arrays and reversals for my own trading, and trading carries real risk of loss. The arrays come from screenshots taken Oct 9, 2026, and they update as each session closes... check them again before you act on any of this. The Pine Scripts are tools for marking a chart. They don’t place trades and they don’t replace your own work.
Can Consumer Confidence Predict S&P 500 Corrections?This chart compares the SPY (top panel) with the University of Michigan Consumer Sentiment Index, USCCI (bottom panel), from 1997 to 2026.
The chart uses a weekly timeframe to better identify market turning points. The vertical lines mark the beginning of S&P 500 corrections, while the green lines indicate market recoveries.
Is USCCI a leading, lagging, or contrarian indicator?
I analyzed monthly data from both series to assess their relationship and determine whether consumer confidence can
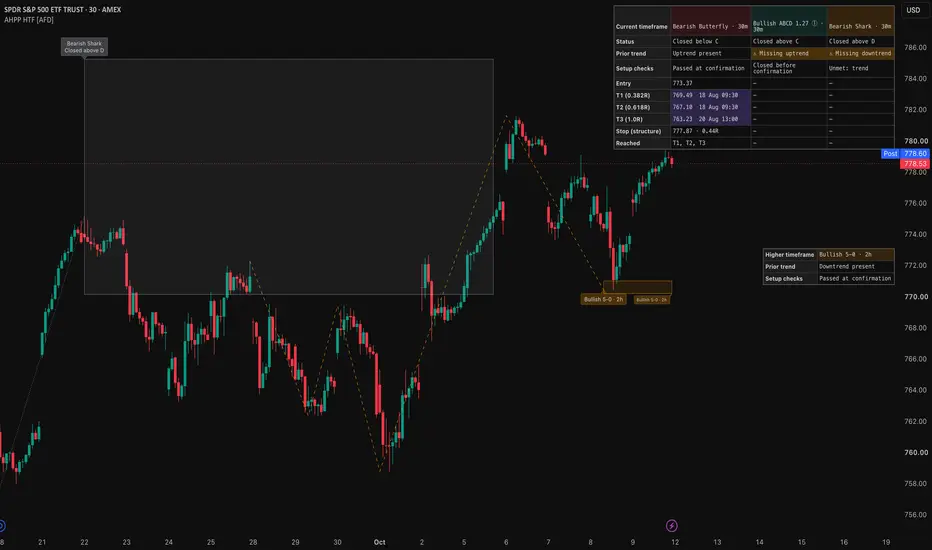
HOW-TO: See higher-timeframe harmonic patterns on your chartHow to see 2-hour harmonic patterns on a 30-minute chart, using SPY.
Why use it
A pattern that forms on a bigger timeframe is easy to miss on a smaller one. Its legs stretch across many candles, so it doesn't stand out. This setting draws those bigger patterns on the chart you already trade, so you can see both timeframes in one place.
Turn it on
1. Add Auto Harmonic Patterns Pro HTF to your chart.
2. Open its settings (the gear icon next to the indicator name).
3. Tick "Project higher timef
Near the recent high—or making a new one? Check the channel.A Donchian Channel is a three-line indicator outlining the price range over a chosen number of bars. Our daily QQQ chart uses 20, so the calculation looks at the latest 20 daily bars.
Use the channel to locate price in its recent range
Upper amber line = highest high of those 20 bars. Lower amber line = lowest low. Gray middle line = (upper + lower) ÷ 2. Together, they locate price within a consistent recent range.
In QQQ’s advance into June, price repeatedly reaches and raises the upper bou
Six numbers a strategy report hides, and how to recover themA strategy report usually shows three numbers that matter and hides the six that follow from them. You do not need the code or the trade list to recover them; you need arithmetic and a willingness to be disappointed.
Take a report that reads profit factor 1.80, win rate 45%, 180 trades. Everything below is a consequence of those three.
The payoff it implies. Average win over average loss equals PF x (1 - win rate) / win rate, which is 1.80 x 0.55 / 0.45 = 2.20. The report is claiming that the
Opening: SMH November 20th 530/540/670/680 Iron Condor... for a 3.99 credit.
Comments: ETF IV at >35% (it's at 36.8% currently). Collecting in excess of 1/3rd the width of the widest wing here with short option legs at 25 delta or below. SMH isn't all that liquid, so going with the monthly here. I moved in the call side slightly to structure the setup such that net delta is just about as flat as you can get. (It's currently marking at -.17 delta/3.19 theta.)
Metrics:
Max Profit: 3.99 ($399)
Max Loss/Buying Power Effect: 6.01 ($601)
ROC at M
Opening: QQQ Nov 6th 701/711/3 x 795/800 Ratio'd Iron Condor... for a 3.66 credit.
Comments: Back into the Q's in the expiry nearest 45 DTE. Here, adding a contract to the short call side to structure the trade to lean more short from a delta standpoint.
Metrics:
Max Profit: 3.66 ($366)
Max Loss/Buying Power Effect: 11.34 ($1134)
ROC at Max: 32.3%
ROC at 50% Max: 16.1%
ROC at 10% of the width of the widest wing: 13.2%
Will generally look to take profit at 10% of the widest wing, which is a 15-wide equivalent due the call side being a 3 x 5 wide.
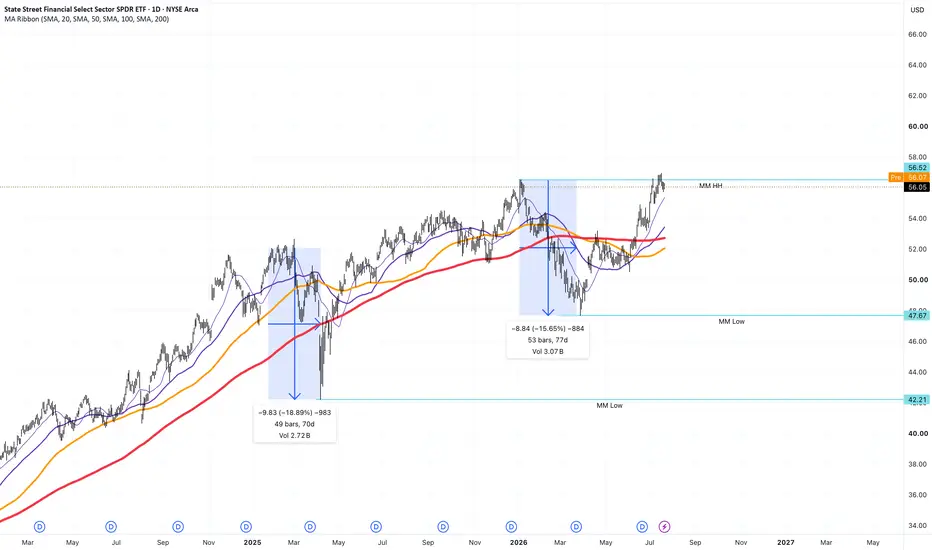
Short on XLF🚨 BANKS AT A KILLER ATH: Opening a Short on XLF Before the Middle East Sets Markets on Fire! 🚨
The US financial sector is experiencing absolute euphoria, breaking one all-time high after another. While retail traders are recklessly buying the tops, assuming banks will grow to the sky, we see an extremely stretched rubber band that is threatening to snap. Combined with the escalating tensions in the Middle East, a perfect storm is forming. We are not waiting for a washout—we are meeting it head-
SPY Is Back Near 779.37 With The Timeframes Split.SPY Is Back Near 779.37 With The Timeframes Split.
SPY is trading near 777.70 premarket, up from Thursday's 773.93 close and about 1.70 under the 779.37 August high. Thursday's low held 770.44, just above the 770.09 key support. The hourly ACE traffic light is yellow in the first quartile on the long side, and SOM structure is an impulse continuation up. The 4H light is green in the first quartile on the short side, and its structure is an impulse continuation down. The two timeframes point opp
Research 09.10.2026🌏 Markets:
AMEX:SPY +3.36 +0.43%(pre/m)
NASDAQ:QQQ +6.61 +0.88%(pre/m)
🆕 Economic News:
Wall St futures rise as oil slips and tech rebounds, while telecoms slump on SpaceX's spectrum deal
10:00 USA – Michigan Consumer Sentiment (Prel)
12:00 USA – WASDE Report
13:00 USA – Baker Hughes Rig Count
16:00 USA – Fed Collins Speech
📈 Gap Ups
Other news:
NASDAQ:SPCX rises after SpaceX agreed to acquire a nationwide low-band spectrum portfolio, a step toward its Starlink Mobile
$SPY & $SPX — Levels for Friday, October 9, 2026🔮 AMEX:SPY & SP:SPX — Levels for Friday, October 9, 2026
📊 Key U.S. Economic Data (ET)
10:00 AM | Prelim UoM Consumer Sentiment | Forecast: 47.5 | Previous: 48.1
10:00 AM | Prelim UoM Inflation Expectations | Previous: 4.6%
⚠️ For informational purposes only. Not financial advice.
📌 #ConsumerSentiment #InflationExpectations