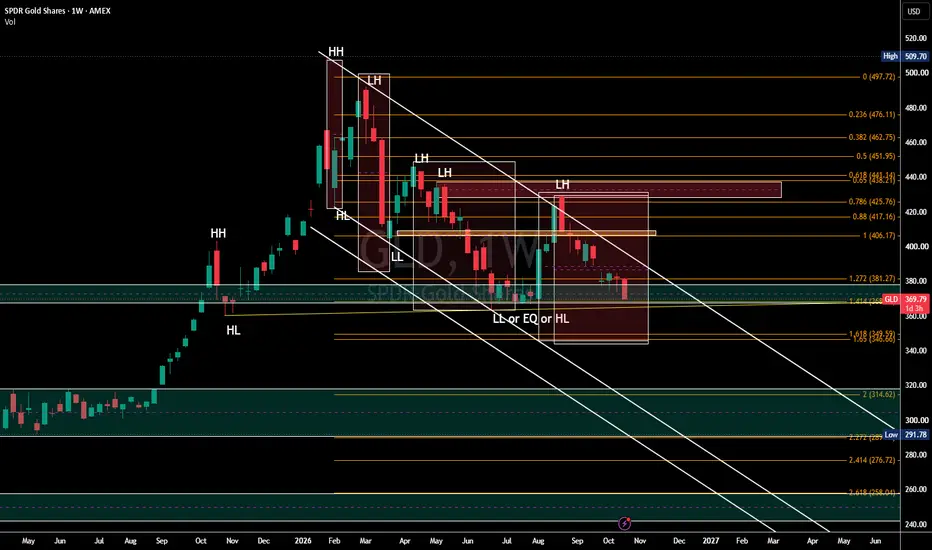
GLD | Gold's Weekly Structure Is Deteriorating ?GLD | Gold's Weekly Structure Is Deteriorating — Is Another Major Leg Down Coming?
**Ticker:** AMEX:GLD
**Timeframe:** Weekly (1W)
**Bias:** Bearish — Watching for Support Breakdown
Gold has been under sustained selling pressure, and the weekly chart is beginning to tell a compelling story.
Following its major peak near **$509.70**, GLD has established a sequence of **Lower Highs (LH)**, with price repeatedly failing to reclaim previous supply zones.
The descending trendline continues t
ETF market
QQQ back at its monthly target downQQQ closed Friday at 709.80, under its monthly target down at 718.40 and well under its October and Q4 pivot at 742.58, so the monthly and quarterly bias point down while the yearly bias is still up. At the time of writing it popped back above 718.40 at the open, reached 720.22, and is now sitting right on that level. On my side the trend reading is neutral, not bearish yet, and price sits near the bottom of its short-term range. What I watch is the daily close: back above 718.40 and Friday’s br
Research 22.10.2026🌏 Markets:
AMEX:SPY -6.89 -0.89%(pre/m)
NASDAQ:QQQ -10.84 -1.50%(pre/m)
🆕 Economic News:
Stock futures slide as Meta and Tesla lead the AI trade lower; oil climbs to a five-month high
08:30 USA – Initial Jobless Claims
08:30 USA – Continuing Jobless Claims
10:00 USA – CB Leading Index
10:30 USA – EIA Natural Gas Storage
13:00 USA – 5-Year TIPS Auction
Fed in blackout period ahead of the Oct. 27–28 FOMC meeting
After the close: NASDAQ:WDC , NYSE:NEM , NYSE:BE , NYSE:FIX
SPY breakdownNeutral 1h read on SPY:
**Structure:** Price made a high around the 780.50 level, then went into a sideways distribution, followed by a sharp impulsive drop to the ~760 area.
**Recovery:** Since that low, price has been forming a rising channel - higher lows along the two ascending trendlines you have drawn. It tried to climb back but kept getting sold around 774-775.
**Current:** The last push failed to hold above the ~769 gray level / channel mid, and price is now trading below the channel
XLE: seven closes above its second monthly target, quarterly tarEnergy (XLE) closed Wednesday at 68.16, its seventh daily close in a row above the second October monthly target at 66.38. The monthly, quarterly and yearly biases all point up, and our trend reading is bullish with momentum up. The next level is the quarterly target at 72.95, which sits above the current short-term range (top near 70.18), so a long-side process holds here rather than adding. The line to hold is 66.38 on a daily close: a close back under it would cancel the move. Energy and heal
SPY Is Testing 765.52 After Closing Above 770.09.SPY Is Testing 765.52 After Closing Above 770.09.
SPY closed yesterday at 773.09, its first close above 770.09 since October 15, but is trading near 765.80 premarket - back under the line and sitting on 765.52 support. The hourly structure is bearish and transitional, with a fresh bearish announcement printed premarket at a mid-range quartile. The 4H light is green with a top-quartile bull read. The timeframes disagree, and the premarket move is not a close.
Resistance: 769.05 - Tuesday's clos
DRAM: This is a great exchange traded fund to considerHello,
We believe that memory will remain a critical bottleneck for the AI revolution.
We believe memory makers are set to keep earning outsized profits as AI scales.
Bigger models and much longer context windows require higher bandwidth
memory (HBM) and more server DRAM (Dynamic Random-Access Memory)
per accelerator. The shift to agents will intensify this: agentic workloads
typically consume far more tokens than single-turn reasoning or chat because
they repeatedly ingest growing context, cal
PSQ: Fundamental OutlookProShares Short QQQ (PSQ) is an inverse ETF designed to deliver returns approximately opposite to the daily performance of the Nasdaq-100 Index, before fees and expenses. It provides a way to hedge a portfolio or gain tactical exposure to declines in large-cap technology and growth stocks. However, PSQ is not a conventional long-term investment in a business or sector. Its annual expense ratio is approximately 0.95%. Because the fund resets its exposure daily, compounding and market volatility c
SPY 1D: does RSI divergence beat the same swing without it?THE CLAIM
An RSI divergence is read as a sign that price is about to turn. On SPY 1D, did it call the turn more often than the same price swing without one?
THE TEST
8,490 confirmed daily bars went through the open-source indicator "RSI Divergence vs Random Bars: Does It Call the Turn?" on default inputs: RSI 14, pivots 5/5, horizon 10 bars after a divergence confirms. Divergences are set against the same swings with no RSI divergence, and against random bars.
RESULT
All divergences (n = 146):
Where Do We Go From Here ?There are 2 key groups that drive the indices — and they have different jobs.
GROUP #1
Job: Hold the Market -Indices Up Until the Fed Cuts.”
— TECH (THE STEEL I‑BEAM)
AAPL • MSFT • NVDA • AMZN • META • GOOG • TSLA • AVGO • AMD • CRM • NOW • ADBE • NFLX • GOOGL
These 14 tech stocks are NOT being bought. They’re being recycled and babysat by Vanguard, Fidelity, and T. Rowe Price using the same $545B of daily volume.
Their job right now: Act like a steel I‑beam and hold up the S&P and
QQQ: 718.32 is the flush line, 724.55 the reclaimWednesday drew one line and tested it twice. QQQ flushed in the morning to 719.72, built a double low at 720.30 into midday, and accepted above 724.55 — a level that capped price all morning — closing at 725.21, near the 727.95 high. Then the evening took it all back: overnight QQQ slid through the level to 719.47, and Thursday opens below the line, sitting on 718.32, the first support. The test now runs the other way — 718.32 is the flush line, 724.55 is the reclaim.
What Wednesday proved: loc
$SPY & $SPX — Levels for Thursday, October 22, 2026🔮 AMEX:SPY & SP:SPX — Levels for Thursday, October 22, 2026
📊 Key U.S. Economic Data (ET)
8:30 AM | Unemployment Claims | Forecast: 200K | Previous: 199K
⚠️ For informational purposes only. Not financial advice.
📌 #SPY #SPX #UnemploymentClaims #Employment
Price keeps moving. Why don’t these levels?SPY sells off on October 14. In the October 15 session captured here, price dips around the lower amber line and rebounds toward the white one. The candles move; the reference lines stay flat.
That is how daily pivot points work: the levels are calculated from the previous session’s data, rather than following each new 15-minute candle.
What builds the levels?
This example uses Traditional daily pivots. P, the white central pivot, averages the previous session’s high, low, and close. The fi
SPY fades to 764 by Thursday noon? How to grade the last callThe setup, in numbers: price sits near 772 on the hourly chart. A forecasting model's current path slopes toward about 764 by Thursday noon, wrapped in an error band that widens by roughly 0.9% per hourly step. Its previous call, made near 765 early Tuesday, also pointed lower.
The last-call check is simple. Before trusting the new path, grade the old one. Did price stay inside the old band? Did it lean in the forecast's direction, or against it? Here the earlier call pointed lower from the 765
Using Sector ETFs to Spot Changes in Market LeadershipIf you have an interest in momentum trading, understanding the ebb and flow of sector leadership is an important part of the process. Sector ETFs offer an efficient way to analyse sector strength and weakness, allowing us to use our technical analysis skills to look beyond the simple performance rankings provided by bar charts and heatmaps.
Rather than just identifying which sectors have performed best, we can study the quality of their trends, how momentum is changing and whether the underlyin
$SSPC will trade at $9 againGreetings,
- I am in this trade with a small 200 share position ($1200)
- NAS100 is printing all time highs and is bound for a red season
- That alone will drag down NASDAQ:SPCX from $175 for a retest of $150 (15% drop)
- On the 2x ETF, thats a 30% capture.
- Remember young John Conor from T2 hacking the ATM? "EASY MONEY"
- Cheers ya'll. God blesses!
QQQ Remains Under a Bearish Bias, With Potential for a DeclineMarket Structure: Bearish (Lower High – Lower Low) NASDAQ:QQQ
After forming a swing high around $762.85, QQQ underwent a structural shift from bullish to bearish.
- The price formed a series of lower highs at the $758, $754, and $746 levels.
- A strong bearish impulse broke through the $734–730 support zone.
- The decline continued, testing the $707–710 demand zone.
- The price subsequently rebounded toward the $722–724 range but failed to form a higher high, which would have confirmed a tr
TrianleSPY 15m - neutral read:
- *Structure:* Broke prior downtrend into a strong impulse, then transitioned into sideways / higher-low consolidation.
- *VWAP / Trend:* Price is hovering around VWAP, holding above the rising white trendline that connects higher lows since the break.
- *Pattern:* Small flag-type consolidation after the impulse, now tight choppy candles indicating balance, not strong momentum either way.
- *Volume:* Elevated on the breakout, then muted/flat during the consolidation phas
Pre-market — Wed Oct 21, 09:05 ETDay call: RIP-DAY (selective, AI-led). NQ +0.7% — SPCX +8% (Q3 rev +161% YoY, Tesla/SpaceX merger committees) and SMCI +11% on a raised guide are driving AI names; mega caps flat-to-mixed. Favor TREND continuation on the AI leaders; Sniper only on fresh flushes. No macro no-chase flag today (Fed blackout). META + TSLA report after the close → scalp-only, no weeklies on either.
Top picks (Layer A — 30m bull div + completed 4h SMI cross, verified on zoomed 4h): NVDA, AMD, QQQ, AVGO. SPY is a stru
Research 21.10.2026🌏 Markets:
AMEX:SPY +1.98 +0.26%(pre/m)
NASDAQ:QQQ +4.86 +0.68%(pre/m)
🆕 Economic News:
Nasdaq futures lead gains as SpaceX and Super Micro results revive the AI trade; Netflix slides on a soft outlook
07:00 USA – MBA Mortgage Applications
10:30 USA – EIA Crude Oil Inventories
13:00 USA – 20-Year Bond Auction
Fed in blackout period ahead of the Oct. 27–28 FOMC meeting
After the close: NASDAQ:META , NASDAQ:TSLA , NYSE:IBM , NASDAQ:TXN , NASDAQ:LRCX , NYSE:SAP , NASDAQ:C