Long
Long
 Long
Long
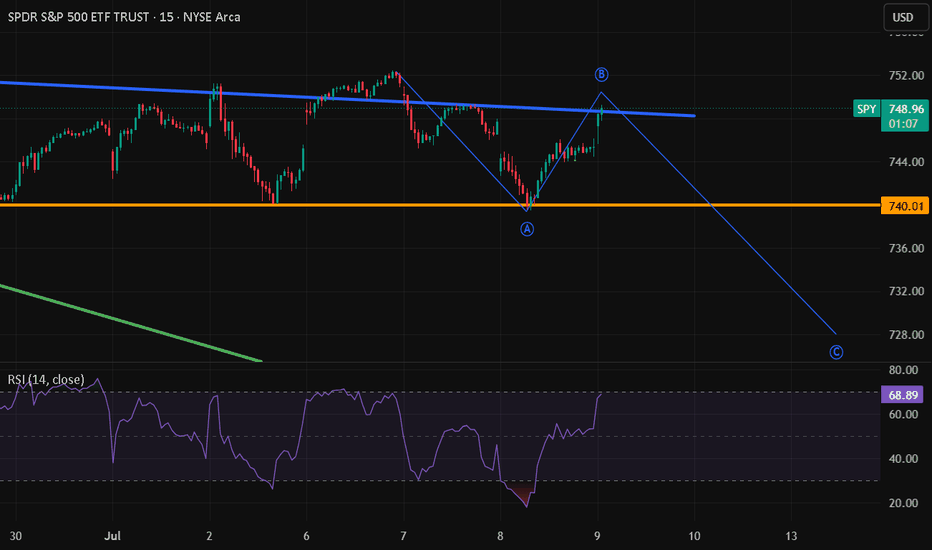
SPY Day Trade 7/10 (15-Minute Chart)Yesterday morning I shared this chart and mentioned I was leaning bullish for Monday's open, despite the chart looking a bit bearish. So far, that thesis has held up pretty well. With today's price action, I've updated the chart by adding a new light orange trendline along with a revised blue path to better reflect the current structure.
The way I see it, SPY is now respecting this new ascending trendline, and as long as buyers continue defending it, I think there's still room for another push toward the upper resistance levels. That doesn't mean it'll be a straight shot higher—I'd actually expect plenty of chop along the way—but the structure continues to favor higher highs unless that trendline is lost.
The bearish scenario is still on the table, but after today's strength it's no longer my primary focus. If we lose the new trendline with conviction, then I'll reassess. Until then, I'm more interested in letting price prove it wants to continue higher rather than trying to pick a top.
Today's Game Plan
Today isn't a day where I want to overtrade. My plan is simple:
Day trade only.
Silence the noise at the market open.
Wait for 5-minute candle confirmation before taking any position.
I'm only expecting one or two quality trades at most.
Some days the best trade is the one you don't take. I'd rather wait for the market to come to me than force entries just because the opening bell rang.
As always, the Heavy Diligence Options Signals Indicator will be my trigger—not my prediction. The technical analysis provides the roadmap, but the indicator helps identify when the probabilities begin shifting in favor of Calls or Puts. Combined with 5-minute confirmation, that's the approach I'll be sticking with today.
Disclaimer: This is only a trade idea based on the current technical structure and is not financial advice. Always do your own research, wait for confirmation, and manage your risk before entering any trade. SPY Is Back At The Highs And The Read Finally Agrees.SPY Is Back At The Highs And The Read Finally Agrees.
SPY has held its recovery all the way back to 751, right under the 752 highs, and this morning the read finally caught up to the price. After days of the conviction engine reading bearish while price rose, the surface flipped bullish and the daily thesis turned long for the first time in the standoff. The bull anchor that would not break all week is now being confirmed rather than doubted. The one caution left is that this is happening at the highs, with an unsustainable-upside flag still active - the read agrees, but the location is the worst part of the range to chase.
Resistance: 752.45 - the highs, the level to break
Key resistance: 760.40 - the cycle high
Current price: 751.80
Support: 748 - first support below
Key support: 740.44 - the shelf that held the shakeout
Structural floor: 716.50 - the operative low this cycle
Two paths from here:
The breakout to new highs. With the daily thesis long, the surface conviction confirming, and the bull anchor standing, a clean break of 752.45 opens the path to the 760 cycle high. This is the first time all week the read and the price have agreed on direction - the standoff resolving up.
The euphoria caps it. The one thing arguing against a chase is the unsustainable-upside flag still active at the highs, with some short conditions still loaded. If 752.45 rejects and price rolls back under 748, the failed-breakout risk returns and 740.44 gets a third test. Buying the highs into a euphoria flag is the low-reward side of this.
A week of coiling resolved with price back at the highs and, for the first time, the read agreeing with it - both timeframes long, conviction confirming. That is the bullish resolution. The catch is the location: at the highs, into an unsustainable flag, the move is confirmed but the entry is not. 752.45 is the level that turns confirmation into a breakout.
Built with SYNTHESIS v3.3 | SOM / ACE / IMP / SYNTHESIS
Study, not financial advice. Research 10.07.2026🌏 Markets:
AMEX:SPY +0.21 0.03%(pre/m)
NASDAQ:QQQ -1.30 -0.18%(pre/m)
🆕 Economic News:
12:00 USA – WASDE Report
NASDAQ:SKHY - SK hynix IPO
📈 Gap Ups
Reaction to earnings/guidance:
NASDAQ:WDFC NYSE:DAL
Other news:
NASDAQ:EQPT Raises 2026 Financial Outlook on Strong Customer Demand and Authorizes $500 Million Share Repurchase Program
UAE sells £4.4bn LSE:VOD stake to French telecoms tycoon
NYSE:CRCL wins final regulatory approval to establish US trust bank
CRYPTOCAP:BTC is rising while indexes are falling: NASDAQ:COIN NYSE:CRCL NASDAQ:MSTR NYSE:BMNR
A new report said NASDAQ:META plans to begin production of its data center chip, code-named "Iris," in September. NASDAQ:META is showing historic growth performance over the past 14 months.
📉 Gap Downs
Reaction to earnings/guidance:
NASDAQ:NRIX
Other news:
NASDAQ:FRMI to raise $350m in note offering
NASDAQ:MU NASDAQ:SNDK NASDAQ:WDC NASDAQ:STX CBOE:DRAM : Memory Stocks Fall Ahead Of SK Hynix's Nasdaq Debut Today
🏢 IPO
NASDAQ:SKHY – SK hynix
Company designs and manufactures advanced memory semiconductors, including DRAM, HBM and NAND flash. SK hynix is one of the world’s largest memory companies, ranked #2 in DRAM and #1 in HBM by revenue in Q1 2026. Core thesis is AI-driven demand for high-bandwidth memory used in GPUs, data centers and high-performance computing.
Price: $149.00 per ADS
ADS Sold: 177.9M
Raised: $26.51B
Market Cap at Pricing: ~$1.1T
Existing Listing: KRX KOSPI / 000660
LTM:
Revenue: $86.70B
Net Income: $49.35B
Comparable public companies: NASDAQ:MU , NASDAQ:WDC , NASDAQ:STX , NYSE:TSM , NASDAQ:NVDA , NASDAQ:AVGO
📋 List of tickers involved:
NASDAQ:SKHY NASDAQ:WDFC NYSE:DAL NASDAQ:EQPT LSE:VOD NYSE:CRCL CRYPTOCAP:BTC NASDAQ:COIN NASDAQ:MSTR NYSE:BMNR NASDAQ:META NASDAQ:NRIX NASDAQ:FRMI NASDAQ:MU NASDAQ:SNDK NASDAQ:WDC NASDAQ:STX NYSE:TSM NASDAQ:NVDA NASDAQ:AVGO
Best regards – hi2morrow team.
Long

Long 
Long
$SPY Volatility Contraction Pattern (VCP)Setup
AMEX:SPY is forming a volatility contraction pattern (VCP). After several weeks of elevated volatility, price action appears to be tightening, with higher lows developing even as lower highs continue to cap the range. At the same time, volume is drying up, which supports the idea that the pattern is consolidating.
Trade Bias
This pattern can break in either direction, so confirmation matters. My current bias is bullish, and I am watching for a break above the upper downtrend line. If that breakout occurs, I plan to consider a trade using AMEX:SSO as a leveraged proxy, since the AMEX:SSO chart has a similar setup.
Risk Management
If I take the trade, I will place my stop below the most recent daily low.
Reminder
If this idea fits your process, make it your own and follow your trading or investing rules. After all, it is your money.
Long 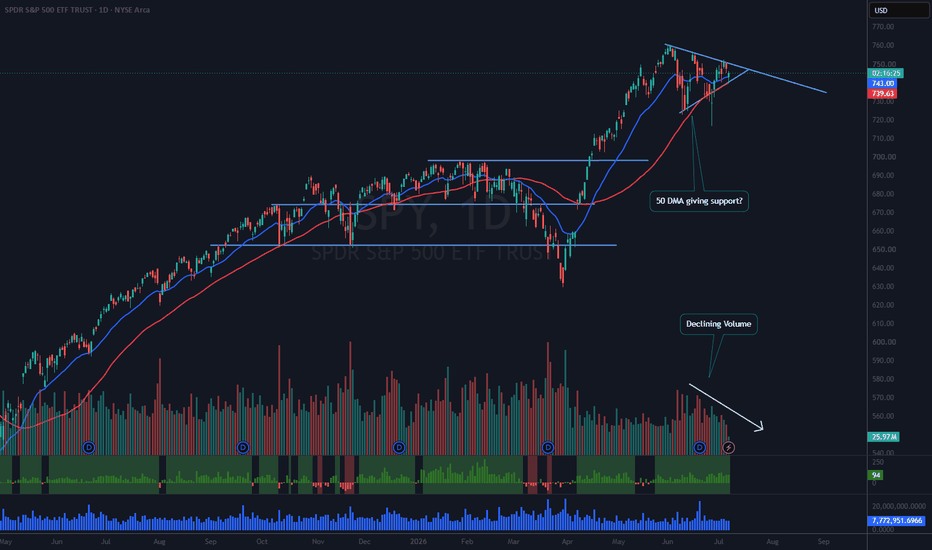
Long
 Long
Long
Short
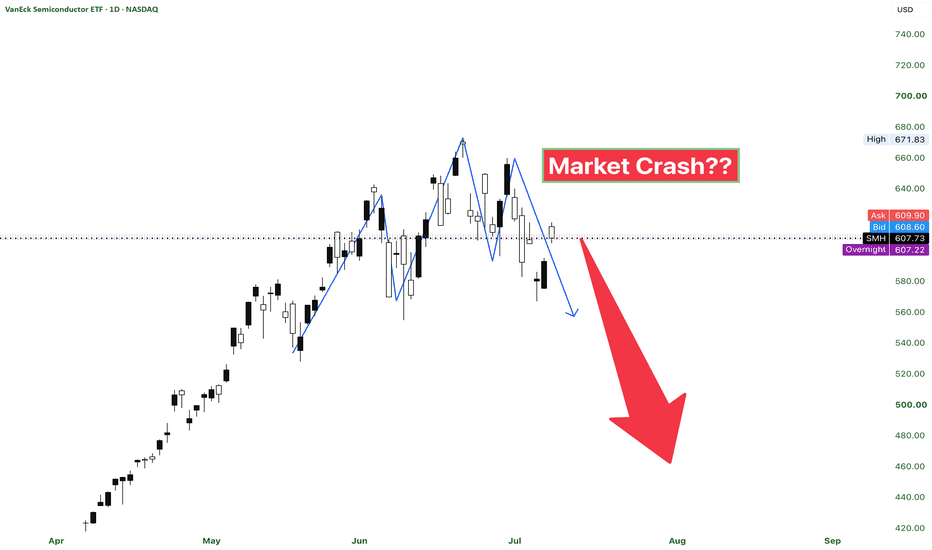
Semis Trading Plan: Buy the Reclaim or Buy the Flush?Semis just gave us their first real test of the 50 EMA since the April run started. Price tapped 546 yesterday, printed a rejection wick, and bounced. Textbook so far. First test of a rising 50 EMA after a strong trend leg usually gets bought.
But here's what I'm actually watching, and it's above price, not below.
We lost 584.50, the floor of the entire June consolidation. That level is now overhead resistance, with the 20 EMA falling right into it. That double layer at 584-585 is the lock on this chart.
Volume isn't helping the bulls either. The biggest recent bars are red. That looks more like distribution than a quiet pullback.
So here's my framework : Support is the 533.74 - 546 zone, horizontal level plus rising 50 EMA. Resistance is 584.50. Between the two, it's a decision range, nothing more. I will not get excited with price action within that area. IMO: reclaim 584.50 on a daily close and this pullback was just a breather. 629.72 and then the highs come back into play.
Lose 533.74 on a daily close and the range breaks down. First stop 506.94, but the real buy zone sits lower where the rising 100 EMA converges with the 463-484 shelf. That's where I'd expect the serious bounce IF we purge.
RSI sitting at 45, momentum fully reset, not oversold. Room in both directions, so price decides, not the oscillator. If we retest 533, watch for RSI to print a higher low against a marginal price low. That divergence would be the bull signal worth acting on.
Important to note : Price may continue to trade sideways until the next semis earnings. I would avoid leveraged ETFs, as time decay could significantly erode their value.
This is my personal technical analysis and trading plan, not financial advice. Always do your own research before making investment decisions. Short 
 Long
Long
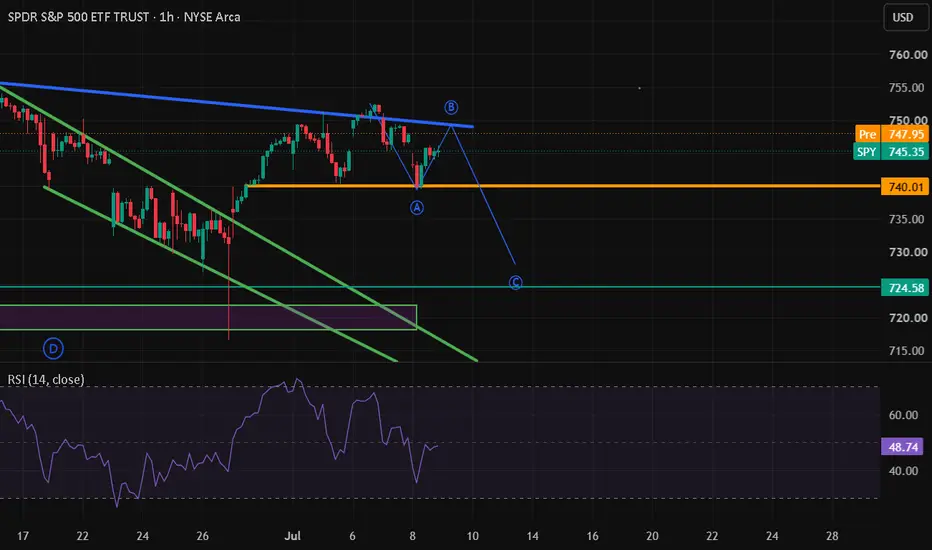
SPY Outlook heading into Monday SPY is once again sitting at a key inflection point, trading between well-defined support and resistance after several sessions of back-and-forth price action. The three paths on the chart aren't predictions—they're simply the scenarios I think are most likely to play out over the next couple of trading days.
🟢 Bullish Scenario
If buyers defend the 743.45-740.50 support zone and reclaim 748.32, momentum could build quickly toward 751.31 and potentially challenge the upper trendline. The structure still allows for a strong relief rally, especially if the market shrugs off the recent weakness and rotates back into large-cap tech.
🔴 Bearish Scenario
The bearish case becomes stronger if SPY loses the lower support zone with conviction. One thing worth watching is META. A significant selloff in META, combined with broader weakness across the major indices, could easily spill over into SPY and accelerate downside momentum. Given META's weight in the market, a sharp move there often influences overall sentiment.
🟡 Range-Bound Scenario
There's also a good chance SPY continues bouncing between these key levels before making a decisive move. Choppy markets have a habit of frustrating both bulls and bears, and until one side gains conviction, we could simply see more consolidation.
My Outlook
Ironically, because so many traders seem to be expecting the bearish outcome, I'm actually leaning slightly bullish for Monday's open. The market has a tendency to move where it causes the most frustration, and with sentiment feeling cautious after the recent weakness, I wouldn't be surprised to see an early squeeze higher before the next meaningful move develops.
That doesn't mean the bullish path is guaranteed—far from it. If META or the broader market breaks down with conviction, this thesis can change quickly. For now, though, I think it's worth keeping an open mind instead of assuming Friday's weakness automatically carries into Monday.
As always, the Heavy Diligence Options Signals Indicator is what I'll be relying on for actual entries. The indicator is built for short-term trading on the 5- and 15-minute timeframes, while these scenarios simply provide context for where price is likely to react. Having the roadmap ahead of time makes it much easier to execute the plan when a quality Call or Put signal appears.
Disclaimer: This is only a trade idea based on the current technical structure and is not financial advice. Always do your own research, wait for confirmation, and manage your risk before entering any trade.