Research 20.10.2026🌏 Markets:
AMEX:SPY -1.02 -0.13%(pre/m)
NASDAQ:QQQ -3.09 -0.43%(pre/m)
🆕 Economic News:
Nasdaq futures fall as AI jitters return after South Korea's Elice IPO slump; oil rallies as Houthis claim attacks on Saudi facilities
08:15 USA – ADP Employment Change Weekly
08:30 USA – Housing Starts (Sep)
08:30 USA – Building Permits (Sep)
10:00 USA – Pending Home Sales (Sep)
16:30 USA – API Crude Oil Stock Change
Fed in blackout period ahead of the Oct. 27–28 FOMC meeting
After the
ETF market
SPY Slipped Under 765.52 Premarket After Failing At 770.09.SPY Slipped Under 765.52 Premarket After Failing At 770.09.
SPY tested the 770.09 floor yesterday - a high of 770.46 - but closed back at 766.48, and is trading near 764.75 premarket, just under the 765.52 shelf. The hourly traffic light is red with the quartile in Q1 alongside a bearish structure and IMP at 0/5; the 4H light is green with its quartile in Q4 and an NR7 bar. The hourly structure points down while the 4H structure points up, and the slip under 765.52 is premarket only.
Resistanc
ETHA/SPY: Ethereum to beat the S&P 500 in 2027? For a year, the S&P 500 has been the stronger asset. That stretch looks exhausted.
The pair peaked near 0.15 in August 2025, then fell to about 0.05 by June 2026. Ethereum was cut hard while stocks kept rising. Since that low, the pair has bounced and is now near 0.07. The easy part of stocks beating Ethereum is over.
Forecast: Ethereum outperforms the S&P 500 in 2027. The target is 0.15, the old high. From here, that means Ethereum gains about twice as much as the S&P 500. It is a return to a
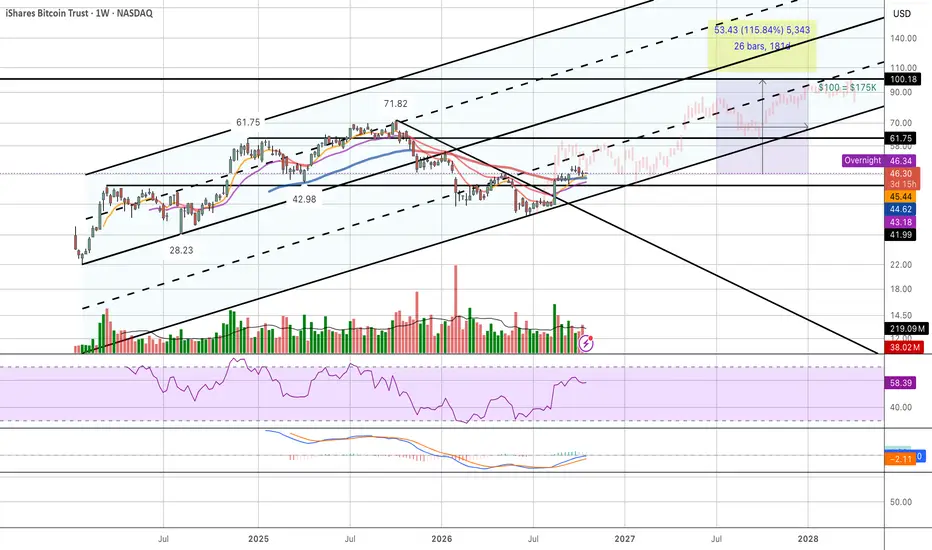
Could Bitcoin Outperform Nasdaq in 2027? For more than a year, big tech stocks in the Nasdaq have beaten Bitcoin. That stretch looks finished.
Bitcoin’s lead over the Nasdaq peaked in mid-2025, then faded all the way back to where things were when the Bitcoin ETF launched in early 2024.
With 2026 coming to an end we are starting to see Bitcoin stronger than QQQ again.
In 2027, Bitcoin may beat the Nasdaq. A fair target is about 0.10 on the IBIT/QQQ chart.
In plain terms, Bitcoin gains about 50% more than the Nasdaq from here.
Thi
$SPY & $SPX — Levels for Tuesday, October 20, 2026🔮 AMEX:SPY & SP:SPX — Levels for Tuesday, October 20, 2026
📊 Lower-impact U.S. Economic Data (ET)
8:15 AM | ADP Weekly Employment Change | Previous: 24.8K
8:30 AM | Building Permits / Housing Starts | Forecast: 1.39M / 1.30M | Previous: 1.40M / 1.28M
10:00 AM | Pending Home Sales m/m | Forecast: -0.7% | Previous: 0.3%
⚠️ For informational purposes only. Not financial advice.
📌 #SPY #SPX #Employment #Housing
720 puts if your bearish 720 calls if your bullishpretty simple right? price action is sitting at a very interesting position basing the positioning of the recent most candlesticks preferably the weekly and daily. As price fell during the first week of Oct 12,2026 and pretty sharply with significant volume, check the accumulation and distribution line for further confirmation. The following week after the selloff into the low 700s near a close of 709, price action popped nicely above 717 the following monday and the sentiment shifted. Howev
SPY Framework: The breakout that wasn'tAMEX:SPY Last time. The October 5 issue put 776.84 above and said the test was acceptance, not a touch: price needed to hold above it, not simply trade through. That distinction did the work. Price pushed through, ran higher, and could not hold it. From there it handed back 769.69 and traded down into the low 760s before stabilizing. 758.31 was never tested. The level mattered, but not in the direction most people were positioned for.
Where we are. SPY at 766.99, back inside the range. What
QQQ back at 720: does the 710 put wall give way into November?The model's daily read on QQQ leans lower: its path runs from about 720 down to roughly 674 by November 12, close to a 5% slide, with almost no upside along the way.
The band around that path is wide, about 9% per step, so the model is far surer of the lean than of the size of the move. The dashed last-call line from the prior run aimed toward the 640s over recent sessions; price instead held above 700 and is back near 720 today, so that call was early.
Nearby levels: a large dark-pool print n
SPY's model path drifts to 737 by Nov 12. Is 750 the tell?The read is bearish for SPY on the daily chart. From about 767, the model's path slopes lower and ends near 737.47 by November 12, roughly 3.4% below today. Its range runs from -0.05% to -3.38%, so the projected route never points above current price.
The band matters more than the endpoint. It is about ±6% per step, calibrated from past forecast error, so outcomes from the low 700s to the low 780s all sit inside it. This is a lean, not a level. The dashed last-call line is a useful reality che
Primary vs trend-day prints: which tape is it?A reversal print and a trend-day print are not the same trade. Reading the marker before you act is half the discipline.
The primary path is a cool-off reversal. The sequence: the 5-minute gauge washes out below its lower band, opening a cool-off cycle; structure forms — an RSI divergence, a W-shape, or a higher low; the 1-minute trigger sequence completes; and a fresh, spread-qualified 5-minute golden cross confirms the turn. Only when every leg is done does the lime triangle print. Friday's t
Research 19.10.2026🌏 Markets:
AMEX:SPY +3.99 +0.52%(pre/m)
NASDAQ:QQQ +9.45 +1.33%(pre/m)
🆕 Economic News:
Nasdaq futures up more than 1% as chip and AI stocks rebound after last week's selloff; oil falls after Trump waived Russia sanctions
10:00 USA – NAHB Housing Market Index (Oct)
Fed in blackout period ahead of the Oct. 27–28 FOMC meeting
📈 Gap Ups
Reaction to earnings/guidance:
NYSE:CLF
Other news:
NASDAQ:IRON soars after its Phase 3 APOLLO trial of bitopertin in EPP met all pri
SPY Is Back Above 765.52 Premarket After Friday's Drop To 760.64SPY Is Back Above 765.52 Premarket After Friday's Drop To 760.64.
SPY failed its reclaim on Friday, closing at 763.25 after a low of 760.64, and is trading near 766.80 premarket - back above the 765.52 shelf but still under the 770.09 floor it lost. The hourly traffic light is red with IMP at 1/5 in extension and the last hourly announcement was bearish; the 4H light is green with IMP at 2/5 on elevated volume. The hourly structure has turned up while the 4H structure still points down, and the
IWM/QQQ lowest close since early 2024. 2-week call, small bounceThe ratio closed Friday 10/2 at 0.3756. That is the lowest close since at least January 2024. It was 0.4113 on Sept 3, so roughly 8.7% lower in a month.
Same session QQQ made a record close at 749.58. IWM closed at 281.52, about 7.7% under its Aug 14 high of 305.09. TLT closed at 77.48, also its lowest close in that window.
Call: the ratio closes above 0.3756 on Oct 16.
This is a lean, nothing more. Over the last year the ratio was lower 10 sessions later about 54% of the time, so I'm taking
Reading a forecast band: what an error band actually tells youMost forecasts on a chart show one line. The line is the least useful part. What matters is the band around it.
1. A band is a measured miss, not a range of hope. A good error band is built from how wrong the forecast has actually been on its own past calls. If the band is wide, the model has been wrong by a lot; if it's narrow, it has earned that.
2. Read the band before the line. If price could fall anywhere inside a band wider than your stop, the forecast is telling you it doesn't know, wha
SPY: Can Buyers Save $760? | Oct. 19–23
SPY enters the week with its daily uptrend under pressure. Price has slipped below the rising support line from September, while the overnight recovery is attempting to recover part of Friday’s decline. I’m watching whether buyers can reclaim $770 or whether this bounce gives sellers another opportunity.
Earnings are a major catalyst this week. Netflix reports Tuesday, followed by META, Tesla, and Lam Research on Wednesday. Their outlooks could influence confidence in growth and AI spending. F
SPY - A Green Open Still Has Something to ProveFutures are up roughly half a percent as I’m putting this together Sunday evening. After last week, that’s a welcome sight. But before anybody starts picking out calls for Monday’s open, let’s look at what price still needs to do.
Last week was a decisive downtrend on this 15-minute chart. Lower highs, lower lows, and recovery attempts that couldn’t hold. A gap up gives buyers an opportunity to change that. It doesn’t mean they’ve already done it.
For the sake of everyone’s retirement portfoli
$SPY & $SPX — Levels for Monday, October 19, 2026🔮 AMEX:SPY & SP:SPX — Levels for Monday, October 19, 2026
📊 Lower-impact U.S. Economic Data (ET)
10:00 AM | NAHB Housing Market Index | Forecast: 31 | Previous: 32
⚠️ For informational purposes only. Not financial advice.
📌 #SPY #SPX #StockMarket #TechnicalAnalysis #HousingMarket
Episode 12 — The Complete Market Cycle# 🎬 The Chronicles of Mr. Nobody
## Season I — The History of the Elliott Wave Principle
### Episode 12 — The Complete Market Cycle
⏱️ **Reading Time: 3 minutes**
In the previous episode, we explored how a motive wave can appear more complex than a simple five-wave pattern. We learned that understanding the market requires more than counting waves. We must also recognize where each wave fits within the larger structure.
But now, another question arises:
**If the market moves in five waves
SLV — when in doubt, zoom out...Macro Perspective Reset:
My bullish bias on AMEX:SLV was clouding my objective analysis and causing confusion with the setup. Zooming out to the Monthly timeframe to look left brings immediate clarity.
Primary Support: (2011 S/R Flip Zone) The $45.00 – $48.00 historical resistance shelf serves as the first line of defense for bulls to defend and absorb selling liquidity.
Secondary Support: A failure to hold the (2011 S/R Flip Zone) opens the door to a deeper sweep toward the 52-week low, whe
QQQ is down 6.6% from its top: is the trend still on?Short answer: not right now.
QQQ closed at 709.80 on Friday.
That's 6.6% below the Oct 6 closing top (759.66).
What my free Trend Safety Switch says today:
- Trend flipped DOWN on Oct 14 (close 728.95).
- It sold 70% and kept 30%.
- Invested now: 30%.
Why keep 30% and not sell all?
The risk regime is still OK.
It goes to 0% only when 2 of 3 warnings are on:
1. VIX ranks in its top 20% of the past year: ON (81st percentile).
2. QQQ closes below its 200-day average (about 675): off.
3. QQQ is m
QQQ Is Still Positioned In Ascending ChannelThe Invesco QQQ Trust is experiencing a sell off driven by U.S. inflation data (CPI report), rising Treasury yields, and broad weakness across tech and semiconductor stocks. The ETF experienced a heavy net outflow of $4.18 billion mid-week.
Technical outlook:
QQQ is on a short term bearish motion. The ETF has been trading downward for a couple of days now, in concern to the framework. Price is approaching a significant trend support level, as there is plain possibility of long retracement.
Key
SPY October 19–23, 2026 — Weekly AI Forecast OutlookSPY enters the new week with the model equilibrium positioned between 771.5 and 775.6. The first important forecast boundaries are concentrated around 778.2 on the upside and 770.0 on the downside, creating a relatively narrow central structure around equilibrium.
The key areas are 778.2–789.1 above and 759.1–770.0 below. These zones contain the model's predictive rails and outer boundaries and will help determine whether SPY remains within its central weekly structure or begins a broader expans