The Psychology Behind the Crash Box: Fear Creates the GeometryThis is the 2003-2013 cycle mapped through the emotional lens of the average market participant. Every crash box has a psychological fingerprint. This is what it looks like.
The sequence:
The market moves along untouched. Confidence is high. Nobody questions it. Then innovation arrives (early internet, smartphones, emerging tech) and a bubble forms. Participants reap the benefits. But doubt creeps in: "I'm in old tech." "What's real and what's hype?" Saturation sets in. Nobody knows what to invest in anymore.
Then the break.
Professional money separates from the herd. Pros limit losses, manage risk, even profit on the way down. The general population withdraws entirely through fear of the unknown. "We were told it was safe. Year on year increases. What happened?"
The Eye Opening Wedge forms at the bottom. This is where the crash box is born. Smart money re-enters while retail is frozen. The divergence between those two groups is the crash box geometry. The angle of recovery is set by how quickly confidence returns.
The critical insight: Crash box angles change with increased population participation and accelerating innovation cycles. Each crash is steeper but shorter. The geometry compresses because the world moves faster. This intersects directly with the Cube Cosmos Published Crash Box Idea on the current SPY setup.
But stay tuned. In the next part, I ask the question nobody else does: what if this doesn't need to happen again? What if the crash box is not a market law, but a failure of collective psychology? What did this actually cost us, and what would the timeline look like had we chosen differently?
The alternative version of events follows.
I dare us to break the cycle, back then even the smart money needed to relearn strategy and widen their fields of view.
They entered again because the knew one thing.
The economy will grow, because it must!!
Our very survival in a growing population depends on it.
Personally, i want us to catch up with where we should be by now.
If we were not so distracted cleaning up the mess fear and doubt, even contempt prior to investigation presents, where do you think the SPY value would be sitting at today?
Psychology birthed this cycle, Psychology can change its destiny!!!
 Education
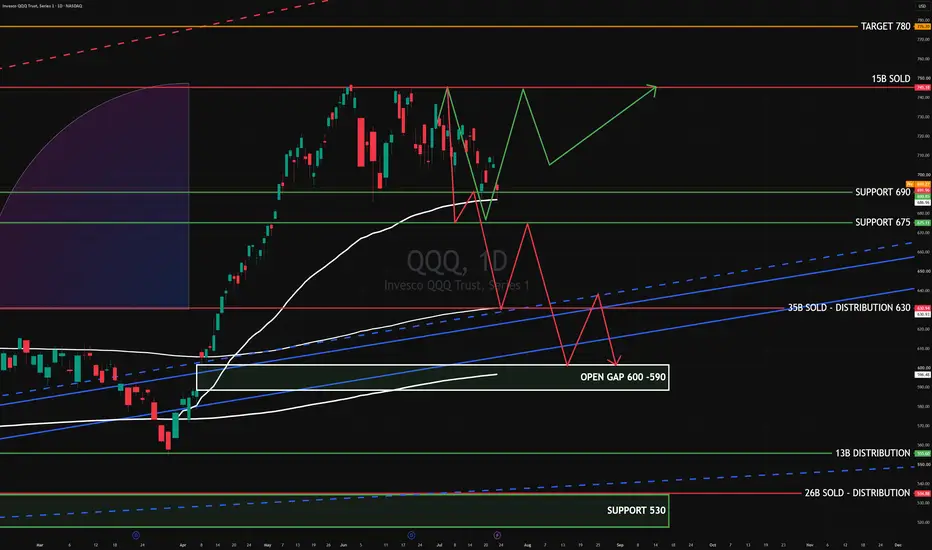
QQQ | Q3 2026 | Day ChartInvesco QQQ Trust, Series 1 ||
MARKET-BEATING SCORE = 8/10
Dividend yield (indicated)
0.43%
-----------------------------------
PEGY 0.90 — fairly valued.
EPS growth 36.0% — above-market.
Revenue growing 11.5% YoY — steady.
Gross margin 62.5% — strong moat.
FCF margin 28.4% — real cash generation.
D/E 0.45 — conservative leverage.
-----------------------------------
•
The fund is heavily concentrated in the 'Magnificent Seven' tech stocks, making it the primary vehicle for investors seeking exposure to AI and digital innovation.
•
QQQ has historically outperformed the S&P 500 over long horizons, notably turning a $10,000 investment at inception into over $125,000 by 2025.
•
The trust maintains a low expense ratio of 0.20%, making it a highly cost-effective way to gain exposure to large-cap growth stocks.
-----------------------------------
Multiple Time-Frame Analysis; Color Code | Strength favors the higher timeframe.
Yearly timeframe = black
Monthly timeframe = pink
weekly = grey
daily = red
4hr = orange
1hr = yellow
15min = blue
5min = green if they are shown. (Level visibility on intervals is set to timeframe the level was found on and below to keep chart view organized.)
** Candle Science explained **
A Range = two or more consecutive color candles.
There are two types of ranges - accumulation and distribution. **A single candle is a range on a lower timeframe. *Find the range and define its, creation dates, prices, and risk parameters. A range is broken down into 4 candle, which create 6 levels that define the range and illustrate market structure.
Focus only on the first and last candle of each range. The last candle of each type of range has two levels - see FS & Inv. FS Candles below.
DISTRIBUTION RANGES DEFINED:
When price is above a distribution range, these candles/levels act as support.
(BS) BACKSIDE Candle - First distribution candle in a distribution range. Expectation = strong reaction to price. long wicks reaching to or away from level. high angle accumulation trends, f.v,g's
(FS) FrontSide Candle - Last distribution candle in a distribution range. Expectation = reversal, create a low angle accumulation trend. The top of Distribution candles are used as support. The bottom of the FrontSide candle is the SwingLow of the range. The FS candle wants to protect the SwingLow. When/if Price Action closes below the SwingLow, the level is invalidated. Find another range to trade.
ACCUMULATION RANGES DEFINED: When price is below an accumulation range, these candles/levels act as resistance.
INVERSE BACKSIDE (Inv.BS) - First Accumulation candle in an accumulation range. Expectation. = strong reaction to price. long wicks reaching to or away from level. Creates high angle distribution trends, f.v.g, protects the Inv.FS candle
INVERSE FRONTSIDE (Inv.FS) - Last accumulation candle in an accumulation range. Expectation = reversal, create a low angle distribution trend. The bottom of Accumulation candles are used as resistance.
The top of the Inv.FrontSide candle is the SwingHigh of the range. The Inv.FS candle wants to protect the SwingHigh. When/if Price Action closes above the SwingHigh, the level is invalidated. Find another range to trade.
 Long
Long
 Long
Long
 Long
Long
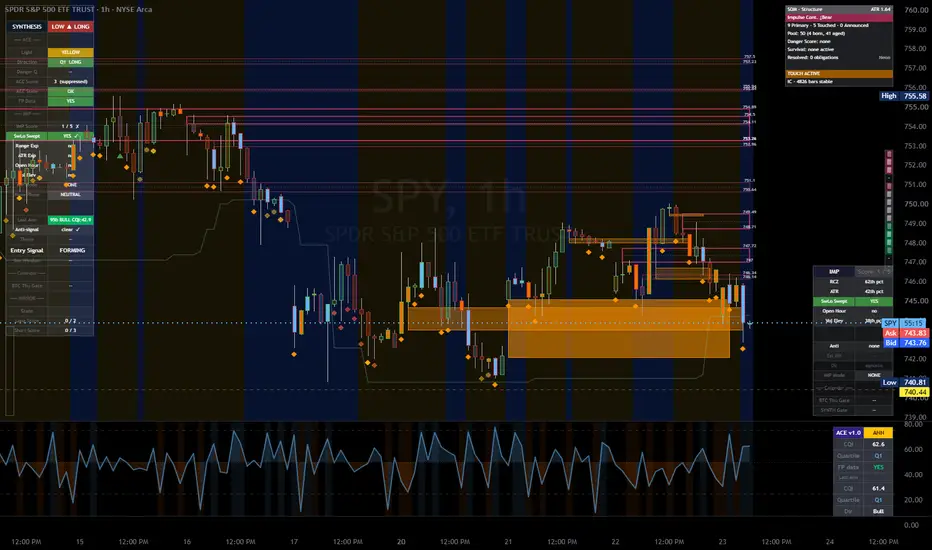
SPY Is Back In The Middle Of Its Range.SPY Is Back In The Middle Of Its Range.
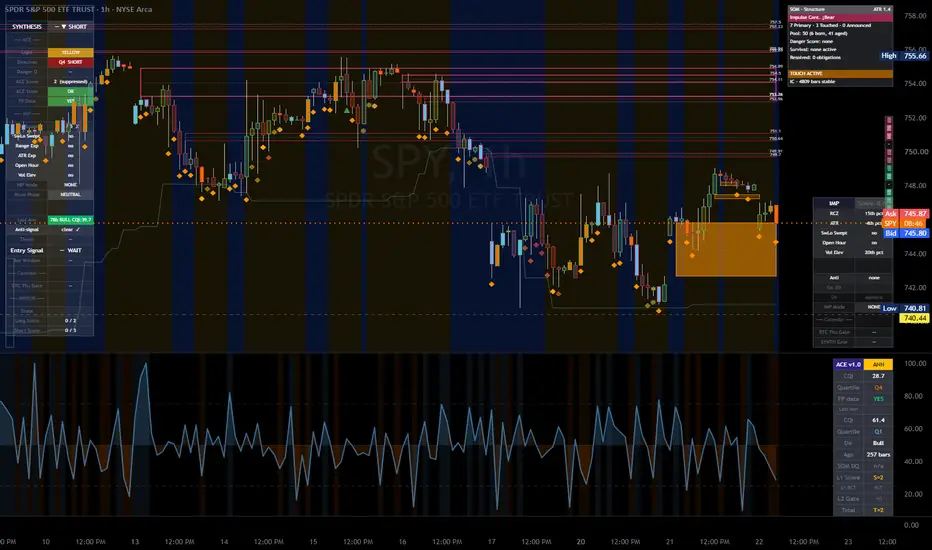
After the fourth failure at 748, SPY has faded to 743.53 and swept a low - right back into the middle of the range it has held for over a week. The structure is the same as it has been: a bull thesis with top-quartile conviction on the hourly, entry forming, but no ability to close above 748 and no reason to break 740.44 either. The swept low is the one new wrinkle - a liquidity grab near the bottom of the range can precede a bounce. But nothing has triggered. Range between 740.44 and 748, still. Neutral.
Resistance: 747.72 - first level back
Key resistance: 748.00 - the trigger, unbroken in four tries
Current price: 743.53
Support: 740.81 - the swept low
Key support: 740.44 - the range floor
Structural floor: 736.87 - deeper support
Two paths from here:
The swept low bounces and takes another run at 748. If the grab near 740 holds and conviction pushes price back up, this becomes a fifth attempt at the trigger - and each failed test theoretically clears sellers for the eventual break. Top-quartile conviction is still there for it.
The range floor finally gives. Four failures at the top can also mean the range is tired and resolves down. A loss of 740.44 on a close breaks the floor that has held all week and opens 736 and below. That would flip the leanable setup to the short side.
SPY is doing the same thing it has done all week - failing at 748, holding above 740.44, swept a low in between. Until one edge goes on a close, it is a range, and four failures at 748 keep the burden of proof on the bulls.
Built with SYNTHESIS v3.3 | SOM / ACE / IMP / SYNTHESIS
Study, not financial advice.  Long
Long
 Long
Long
Long 
Week 30 of 52 | Daily Market Brief #1Is AMEX:SPY SPY Ready to Break Higher?
The U.S. market enters today's session with investors focused on one question: can AI earnings justify current valuations?
After yesterday's strong semiconductor rebound, futures are slightly lower as traders wait for a series of major earnings reports led by Alphabet, Tesla, ServiceNow and Texas Instruments after the closing bell. Today's session is likely to be driven more by positioning than by economic data.
Market Drivers
• S&P 500 futures are modestly lower after Tuesday's rally.
• The 10-Year Treasury Yield remains near 4.6%, keeping pressure on high-valuation growth stocks.
• Brent crude continues trading near recent highs as Middle East tensions remain elevated.
• The VIX remains above recent lows, suggesting investors are still pricing in event risk ahead of Big Tech earnings.
What Matters Today
Today's most important catalyst is Alphabet's earnings report.
Markets want answers to three questions:
Is AI investment translating into profitable growth?
Will Google Cloud continue accelerating?
Does management maintain aggressive capital spending?
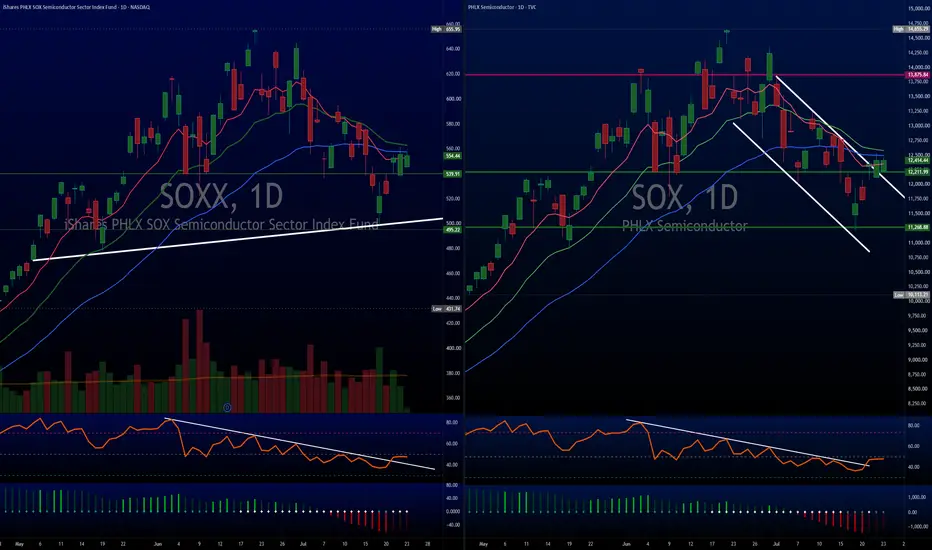
The answers will likely influence not only GOOG, but also Nvidia, Micron, Super Micro Computer and the broader AI infrastructure sector.
Sector Outlook
Potential Leaders
• Artificial Intelligence Infrastructure
• Semiconductor Equipment
• Energy
• Defense
Potential Laggards
• High-multiple Software
• Consumer Discretionary
• Airlines
Stocks to Watch
ASTS
Momentum remains constructive after yesterday's strong rebound. Holding above recent support keeps the short-term bullish structure intact.
MSTR
Bitcoin continues to dictate direction. As long as BTC remains firm, MicroStrategy should stay relatively supported.
GOOG
Today's most important stock. Earnings after the close could determine sentiment for the entire AI sector.
AAPL
Trading near resistance while investors rotate toward AI names. Rising bond yields remain a valuation headwind.
NVDA
Still one of the market leaders. Alphabet's capex guidance could become the next major catalyst.
SMCI
One of today's strongest names after announcing over $60B in new orders together with significantly improved margin expectations.
MU
Memory stocks continue leading the semiconductor recovery, but today's move will largely depend on whether AI spending expectations remain intact.
NOW
ServiceNow also reports after today's close. Investors will closely monitor enterprise AI demand and forward guidance.
Technical Picture
SPY remains inside a well-defined rising channel.
Price is currently consolidating just beneath resistance after an impressive recovery from the April lows.
Bullish Scenario
A daily close above resistance would confirm continuation toward the upper portion of the channel.
Bearish Scenario
Failure to hold the current support zone could trigger a healthy pullback toward the middle of the channel, where buyers may become active again.
At the moment, the primary trend remains bullish, but price is no longer trading at an attractive chase level.
Three Things to Watch Today
Alphabet's earnings and AI spending outlook after the close.
The 10-Year Treasury Yield. A move higher could pressure technology valuations.
SPY's resistance zone. A confirmed breakout would strengthen the bullish trend, while another rejection could extend the current consolidation.
Disclaimer: This analysis is for educational purposes only and reflects my personal opinion based on current market conditions. It is not financial advice or a recommendation to buy or sell any asset. Always do your own research and invest according to your own risk tolerance. SPY Closed The Gap To 748 - Still No Break.SPY Closed The Gap To 748 - Still No Break.
SPY pushed up to the 748 area and is trading 746, the closest it has held to the trigger yet - but it still has not closed above it. The daily structure is bull with a 235-bar bull print standing and conviction firm, though the hourly cooled back to neutral on the approach. This is now the fourth run at 748 without a confirmed break through. The story has not changed: the level is the event, and the level has not gone. Until it closes above 748, the honest read stays a range between 740.44 and 748. Neutral.
Resistance: 748.00 - the trigger, still unbroken
Key resistance: 751.00, then the 755.66 ceiling
Current price: 746.16
Support: 744.00 - first support
Key support: 740.44 - the range floor
Structural floor: 739.34 - the swept low
Two paths from here:
748 closes above and the range resolves up. A confirmed break with the daily bull print standing opens 751 and the 755.66 ceiling, and it is the event that would finally earn a directional call on the one name where breaks carry an edge. It is one point away; it just has to close there.
748 caps it a fourth time. Four failures at the same level is a genuine ceiling, not noise. A rejection here sends price back toward 740.44, and the range that has held for over a week stays intact.
SPY has closed the distance to 748 but still has not closed through it. One point away is not the same as above. The range is the range until the level breaks on a close.
Built with SYNTHESIS v3.3 | SOM / ACE / IMP / SYNTHESIS
Study, not financial advice. Long 
Long 
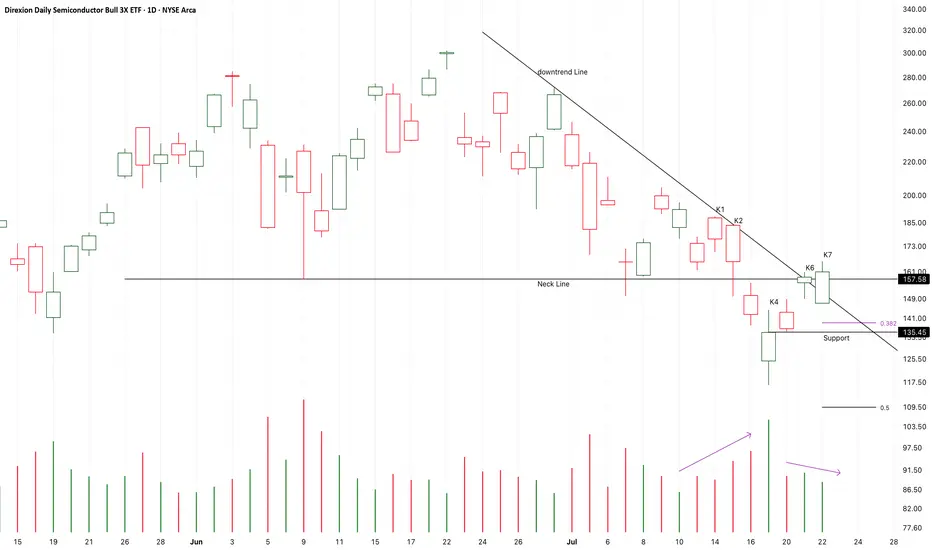
AALG LONG — 1D ALMA Setup (WR 83% · avg RR 4.2)█ SETUP
NASDAQ:AALG · 1D · long only.
(Context: Leverage Shares 2x Long AAL Daily ETF — 200% daily exposure to American Airlines Group; path-dependent vs holding AAL outright.)
ALMA Averaging Strategy: ALMA 3 / σ2, SD band 2, min diff 1/1, 25% per bar, up to 4 adds, hard stop −10% from average entry.
Strategy Tester (AALG 1D):
Win rate 83% · profit factor 8.9 · max drawdown 9%
Avg winning trade +29.3% · avg losing trade −7.0%
Typical hold ~17×1D bars on winners — 2x airline mean-reversion grid on the daily Averaging template · 41-trade sample
═
█ WHY NOW
Fresh 1D ALMA long on the 21 Jul 13:30 UTC bar ~ $14.50 — first lot on this Averaging template (1 of 4).
Bar-close ENTRY after the mid-Jul wash under ~$16 — not a discretionary “buy American Airlines” call and not a leveraged day-trade. Hard stop −10% from fill ~ $13.05 . Exits follow Pine ALMA flip + min diff or the hard stop. Scale-in stays 25% per bar, up to 4 adds, if lower bars qualify.
═
█ MACRO
Sector: AALG = daily 2x AAL beta — US airline demand, unit revenue, fuel/cost gap vs peers, and leisure/corporate traffic drive the underlying more than broad index beta. Leverage and daily reset mean multi-day holds diverge from 2× spot AAL.
Tape (19–21 Jul): American Airlines CEO outlined a plan to close a >$3B profit gap (19 Jul), while peer airline headlines stayed on fuel costs and capacity fights (JetBlue/Spirit slots, Ryanair industry-shakeout talk). Execution is 1D ALMA Averaging on the fill bar — not an AAL earnings or CEO-vision forecast.
═
█ OUTLOOK
Positive factors
- Tester skew: 83% WR · PF 8.9 · avg win +29.3% vs avg loss −7.0% — fat right tail vs bounded ALMA stop path
- Fresh first-lot ENTRY on the 21 Jul daily close ~$14.50 after the mid-Jul slide from the mid-$15s — process re-arm, not revenge size
- ALMA — daily just flipped LONG at the band: 1D L:1 vs LAvg:4.3 — first bar above ALMA / SuperTrend pocket (~14.14–14.17) — touch-quality long, not a late chase deep above the band
- ALMA — slow clocks still stretched SHORT below: 3D S:4 vs SAvg:3.9 (OVERHEAT-S) · 1W S:3 vs SAvg:3.1 — structure clocks still below the band while the daily template arms — classic HTF discount fuel for an Averaging long
- EMA — weekly/3D still Below: 3D Cur S:4 · 1W Cur S:3 with weekly Dev still large in magnitude — slow EMA side not reclaimed; room for mean-revert if daily holds the flip
- SMC — 1D: FVG Enter Bull tagged ~ $14.17 on the 20 Jul daily bar — demand inefficiency sits just under the fill
Negative factors
- EMA — LTF already Above: 15m Cur L:6 · 1H Cur L:2 · 4H Cur L:3 · 1D Cur L:1 — young above-session on the execution clock; not a deep below-EMA discount entry
- SMC mixed at ~$14.17: same window also printed FVG New Bear — bull FVG is not a clean one-way shelf
- 2x daily leveraged ETF — overnight gaps and chop in AAL can erase a “correct” multi-day AAL view via compounding / path dependency even if the underlying drifts the right way
- First lot only (1 of 4) — no averaged cushion yet if the daily bar fails and lower adds qualify or the −10% path prints first
- Snapshot board had no VWAP Touch row for AALG — no Active Support/Resistance levels to lean on in this idea
Takeaway: the 1D ALMA strategy and strong tester skew support a disciplined first lot after the mid-Jul wash, with 3D/1W still below-band and a bull FVG near ~$14.17, but LTF OVERHEAT-L, a young daily above-session, mixed FVG, and 2x path risk frame a repair grind — not a clean trend reclaim; nominal risk stays on the −10% hard stop / Pine exit path.
Base case: follow 1D ALMA Averaging · hold/add on qualifying bars while the ~$14.1–14.5 bull-FVG / ALMA pocket cushions · mean-revert toward the mid-$15s prior shelf if AAL tape stabilizes without a fresh gap through the stop.
Bear case: lose the ~$14.17 bull FVG · 15m/1H giveback extends · AAL headline gap drives AALG through −10% toward ~$13.05 from this fill · template posts the stop and waits for the next bar-close arm.
Chart: NASDAQ:AALG 1D — ALMA Averaging Strategy.
Educational idea. Live position — past backtest ≠ future results. NFA.  Long
Long