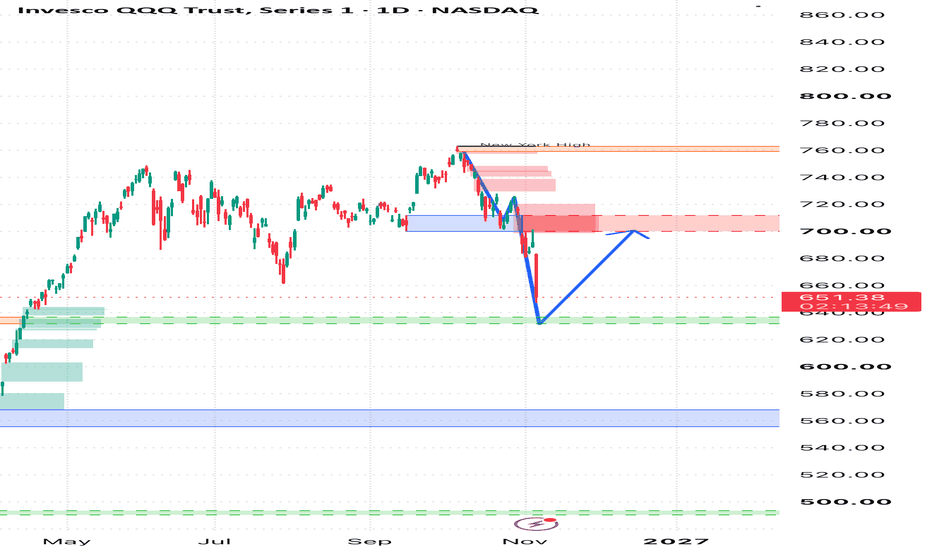
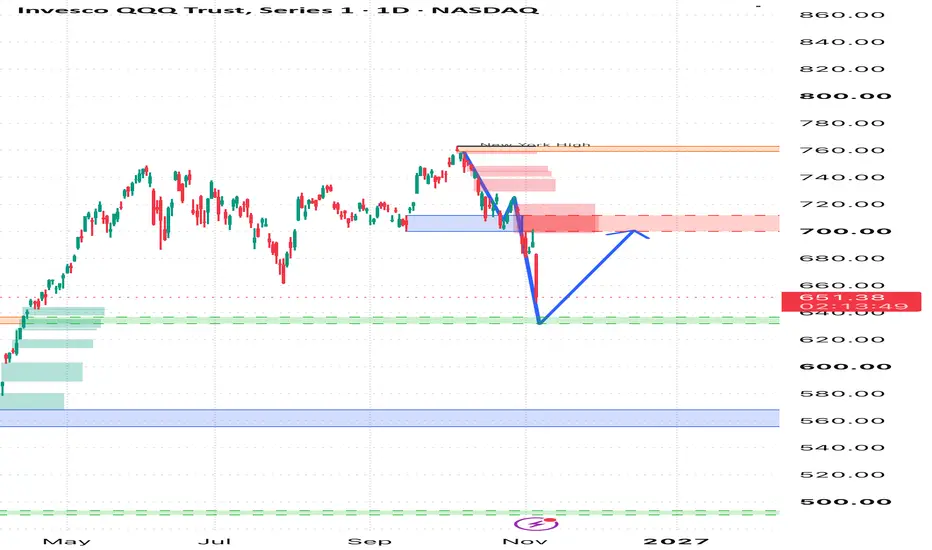
Only fear confirmed: QQQ flushes to 650.42
Thursday opened into a guidance-driven semi flush and never found a bid. QQQ fell 5.9% from Wednesday's close, slicing the 684.8 shelf, the 682-678 band and the 672-682 zone without one pause that held. SPY lost its last drawn demand at 747-750.15 and traded down to 733.94.
The one trend that confirmed all day was volatility. UVXY printed its trend marker at the 16.15 open low and ran +42% to 22.91. When the only confirmed trend on the board is fear, long entries on the indexes have nothing t
ETF market
ITA : iShares U.S. Aerospace & Defense ETF IdeaThe defense sector has been in a steady structural advance for years, and price is now resting inside a zone of interest formed at the highs. Above it, three institutional areas sit stacked like floors of a building that has not been visited yet. Below, two support zones wait in silence, one shallow, one deep.
Scenario 1: the current zone holds. Price consolidates, builds energy, and begins the staircase climb, reacting at each overhead area, pulling back, and continuing. Trend continuation in
QQQ: If it closes here, I'm out. Just following the indicatorQQQ is down about 5.7% today, near 652. VIX jumped from 16.61 to about 26.
My Risk-Off Ladder has 3 warnings. Right now 2 are on:
1. VIX in its top 20% of the past year: ON (the line is about 19.9)
2. QQQ below its 200-day (about 681): ON
3. QQQ 15% below its 1-year high (648.4): not yet, but close
The plan is simple:
- Until the close, I'm still 100% in. No panic selling mid-bar.
- If QQQ closes under 681 with VIX above 19.9 (2 of 3), I step aside to 0% at the close and stay out.
- Back to 10
AI Bubble Risk: Circular Cash & Low Demand QQQ Impact AssessmentThe recent AI news flow confirms that the concerns about circular investments and lack of AI demand are real and actively debated. Here’s what’s been reported in just the last 6 weeks:
Nvidia reportedly backstopping $250B in OpenAI data center financing — Jim Chanos and Michael Burry both called this out explicitly as vendor financing, echoing the Lucent/dot-com playbook
Big Tech off-balance-sheet AI debt reportedly tops $1.65 trillion (Nikkei study, Ed Zitron quoted)
Apollo’s Torsten Slok stat
QQQ: 70% Put Premium on a Bounce Off the 200-Day SMAQQQ bounced off its 200-day SMA today, but 70% of the session's options premium went to puts, most of it in same-day contracts.
OPTIONS FLOW (Nov 4, at the close)
- $1.1B premium: $313.2M calls, $737.6M puts (30% calls / 70% puts), put/call volume 1.13
- 498 contracts traded above their open interest
- Nov 4 $695 puts: 248,482 contracts (OI 1,571), $62.6M
- Nov 4 $696 puts: 148,459 (OI 1,281), $48.2M
- Nov 4 $694 puts: 261,751 (OI 478), $43.2M
- Dec 31 $415 calls: 1,393 (OI 0), $39.0M
TECHNICA
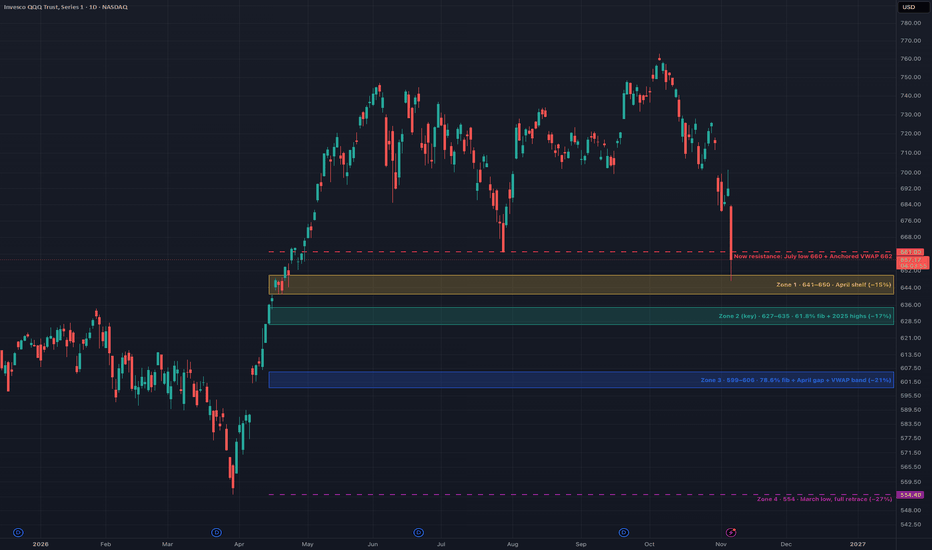
Qs got hurtQQQ has fallen about 15% from its October 6 high of 763. It’s down roughly 6% today, and the day isn’t over yet.
Around 660–662 (red dashed line): this is where the July low (660) and the anchored VWAP (blue line, 662) meet. Today’s drop broke below it, so it should now act as resistance. If QQQ gets back above it and stays there, that’s the first sign the selling is easing.
Where the drop could stop
Zone 1, 641–650 (yellow, about −15%): a short pause area from mid-April. Today’s low of 647 i
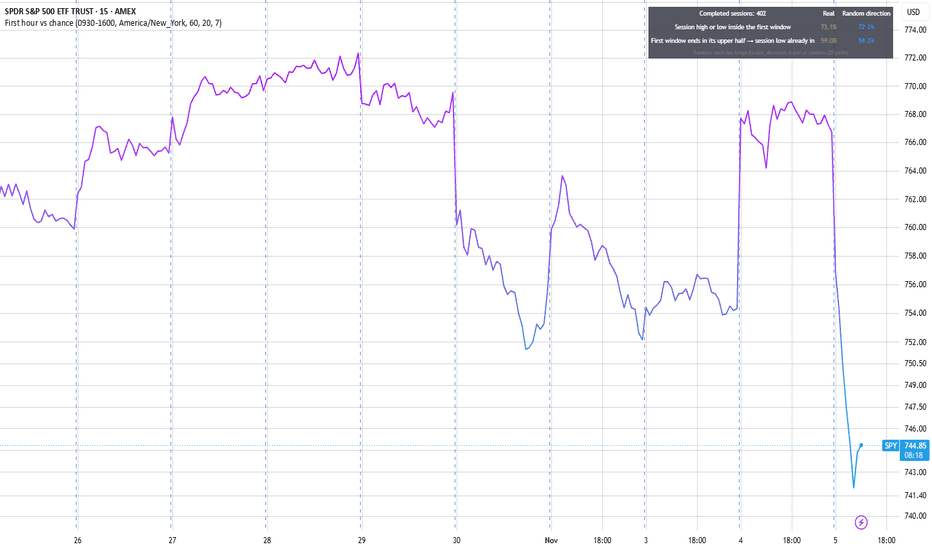
"High or low in the first hour": true, and random gives the sameA statistic that circulates in index-trading videos: on 7 days out of 10, the high or low of the New York session is set in the first hour (9:30 to 10:30). And: if price ends that hour in the upper part of its range, on 6 days out of 10 the day's low is already in.
I checked it on 13 indices with minute data. On the S&P 500 (885 days, September 2021 to June 2025):
- High or low in the first hour: 70.5%
- "The low is already in" if the hour ends high: 60.4%
The statistics are true. Then I asked
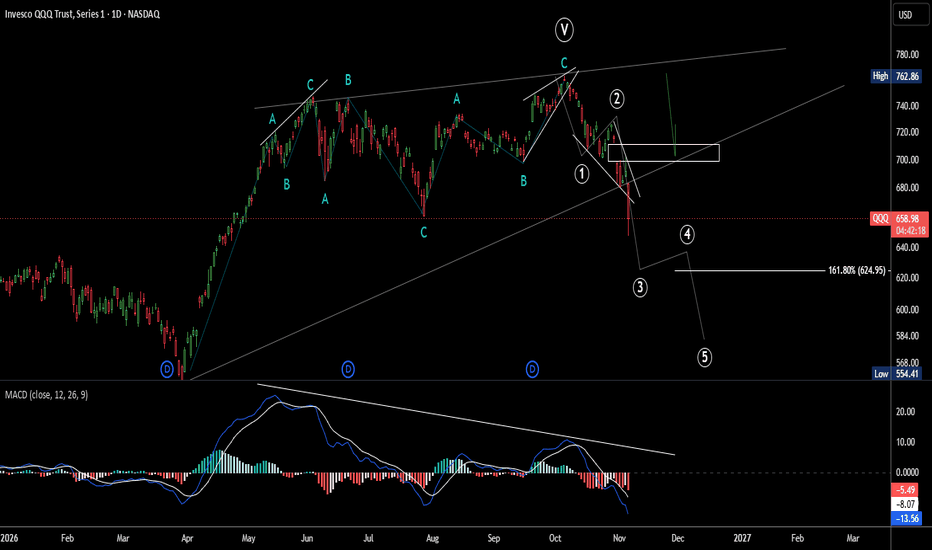
QQQ/Nasdaq Wave 3 breaks Rising Wedge! AI Bubble Popping?Seems we broke below the rising wedge with possible Wave 3 after multiple months of bearish divergence on the MACD.
At the time of this post we got within about 1% of a limit down (-7%) and got a small bounce.
AI bubble seems to be popping here.
If this is an impulsive move down, we may see more downside.
If we complete a 5 wave move down, that may be an A. Possibly followed by an ABC up, and then another impulsive move down for C.
Not Financial Advice!
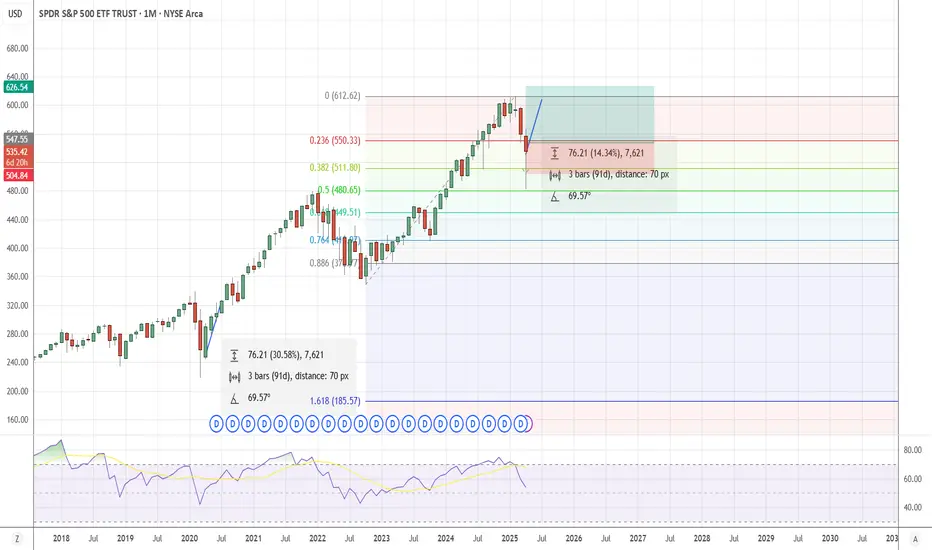
SPY as of Republicans lost both camerasTrump lost the House and the Senate; the market reacted bullishly, but it had already hit a very strong resistance level.
It needs to pull back in order to break through it.
My Elliott Wave projection points to a short position, targeting the top and bottom of wave 4, followed by a rebound.
This projection implies a bearish 2027.
Not everything is lost yet—in fact, it’s more like the beginning.
The point of this scenario is to be prepared to protect yourself.
Research 05.11.2026🌏 Markets:
AMEX:SPY +0.19 +0.02%(pre/m)
NASDAQ:QQQ -5.99 -0.87%(pre/m)
🆕 Economic News:
Nasdaq futures lag as chipmakers extend losses after NASDAQ:QCOM 's outlook and a 5% KOSPI slide; Dow futures add to the post-midterm rally
08:30 USA – Initial Jobless Claims
08:30 USA – Nonfarm Productivity, Unit Labor Costs (Q3 prel)
08:50 USA – Fed Hammack Speech
09:10 USA – Fed Barkin Speech
10:30 USA – EIA Natural Gas Storage
19:00 USA – Fed Logan Speech
Earnings before the open:
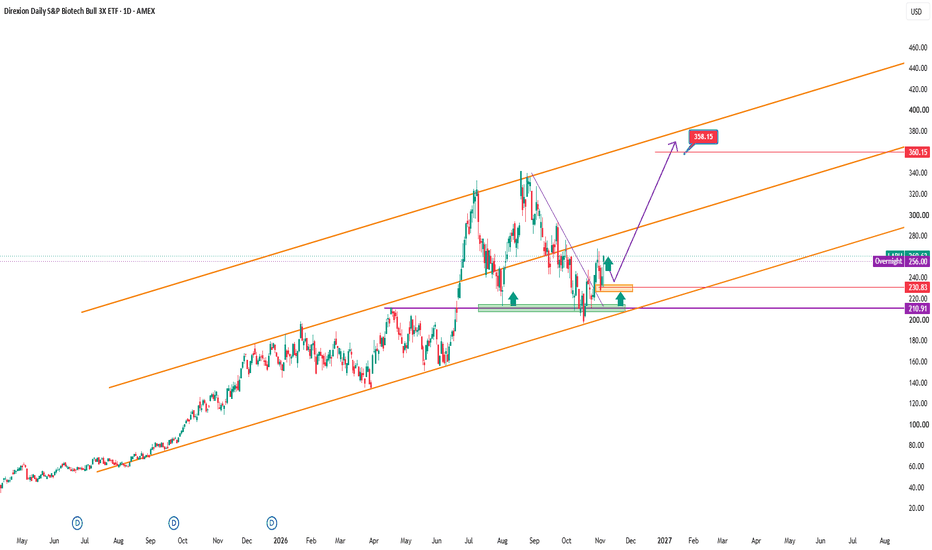
LABU: Bullish Momentum in BiotechnologyThe biotechnology sector is showing a significant recovery, with the S&P Biotechnology Select Industry Index gaining approximately 27% year to date and around 40% over the past 12 months. Key drivers include drug innovation, clinical trial results, FDA activity, M&A transactions and the growing use of AI in biomedical research. These developments are attracting renewed investor interest, although individual biotech companies remain highly sensitive to clinical outcomes and regulatory decisions.
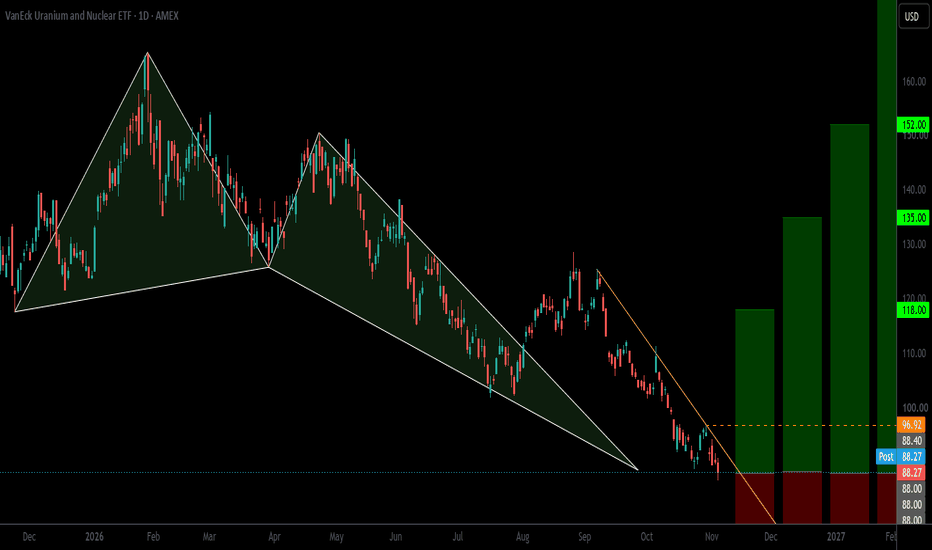
NLR – Bullish Deep Crab | Potential Major Reversal OpportunityNLR is approaching an interesting reversal area on the daily chart, where a large Bullish Deep Crab harmonic pattern is nearing completion following a substantial decline.
What makes this setup particularly interesting is the potential harmonic reversal zone combined with several technical indicators suggesting that selling pressure may be approaching exhaustion.
Trade Setup
My Entry: $88.00
TP1: $118.00
TP2: $135.00
TP3: $152.00
TP4: $180
Why I Entered the Trade
I personally entered NL
Market ObservationIn the past two articles when dips were experienced, the technical analysis showed that the market was experiencing a rotation and they should have been seen as buying opportunities. Those comments turned out to be the right call.
Looking at the post election result a number of observations can be made:
The market is experiencing a level of certainty as the people have shown what they think of the current status of affairs
A risk off from semis is still in play
No fundamental issue (ac
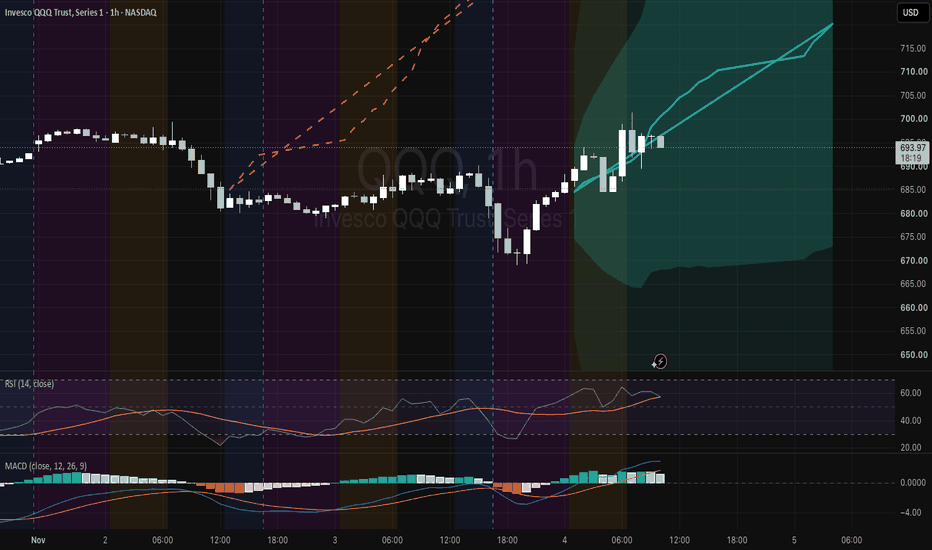
QQQ rip to 720 or bull trap under 703?QQQ ripped from the 670 flush back to 694 in a day. Now the question is whether 703 caps it.
📊 The read
The hourly model path, drawn from yesterday's close near 680, leans long: a steady grind toward about 720 by early Nov 5, staying between roughly +0.7% and +6% along the way. Price is riding the lower side of that path right now.
🧭 Why it matters
The band around the path is wide, about 3.7% per step, so its lower edge sits back in the mid 660s. That's the honest message: the lean is up, but th
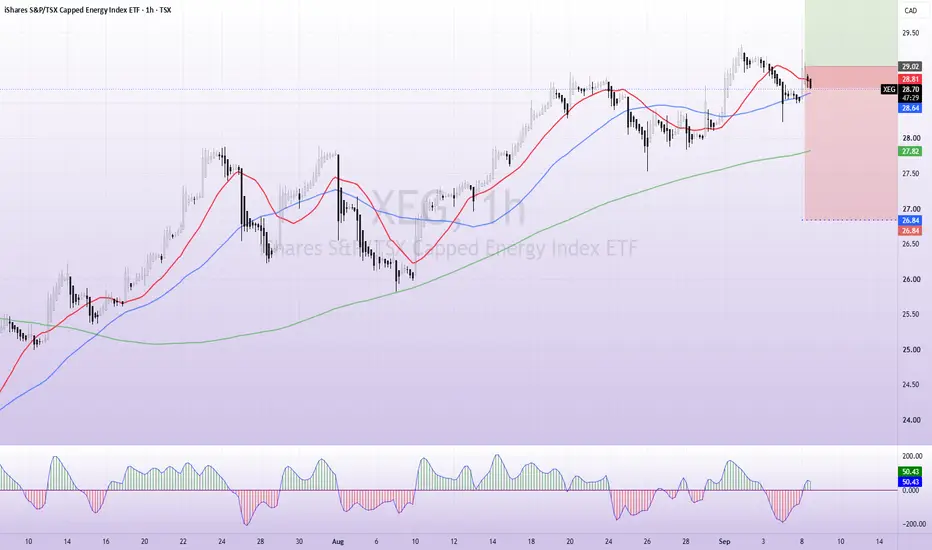
XEG Long EntryValid 1h trend entry.
Price above rising 1h 200 MA
20 MA above 50 MA
Pullback to the 20/50 MA area
CCI recrossed red → green
Entry taken on candle close
Strategy signal confirmed. Position entered.
SL Management
Initial SL: below most recent 1h swing low.
Once trend is mature: trail using the Daily 50 MA.
If a black daily candle appears: pause SL movement.
If price closes below the Daily 50: exit.
Now let the trade work.
Research 04.11.2026🌏 Markets:
AMEX:SPY +6.73 +0.89%(pre/m)
NASDAQ:QQQ +1.48 +0.22%(pre/m)
🆕 Economic News:
Wall St futures rise as Democrats win both chambers of Congress: banks, healthcare, miners and renewables rally while AI, data-center and chip names fall
08:15 USA – ADP Employment Change
08:30 USA – Balance of Trade
08:30 USA – Treasury Refunding Announcement
10:00 USA – ISM Services PMI
10:30 USA – EIA Crude Oil Inventories
Earnings after the close: NASDAQ:QCOM , NASDAQ:ARM , NASDAQ:
SPY: My sell-off plan, written before the drop. Every levelSPY closed Tuesday at 754.35, about 3.2% below its Oct 6 closing high (779.09). Not a crash. But this is exactly when I want my plan written down, before a bad Friday makes the decision for me.
Here is every level I'm watching on SPY, with my two free tools, and what each one does.
Where things stand (Tuesday close)
- Trend Safety Switch: the trend flipped down on Oct 30 at 755.72, so it cut to 30%. It goes back to 100% on a close above about 779.
- Risk-Off Ladder, 1 of 3 warnings on:
1. VI
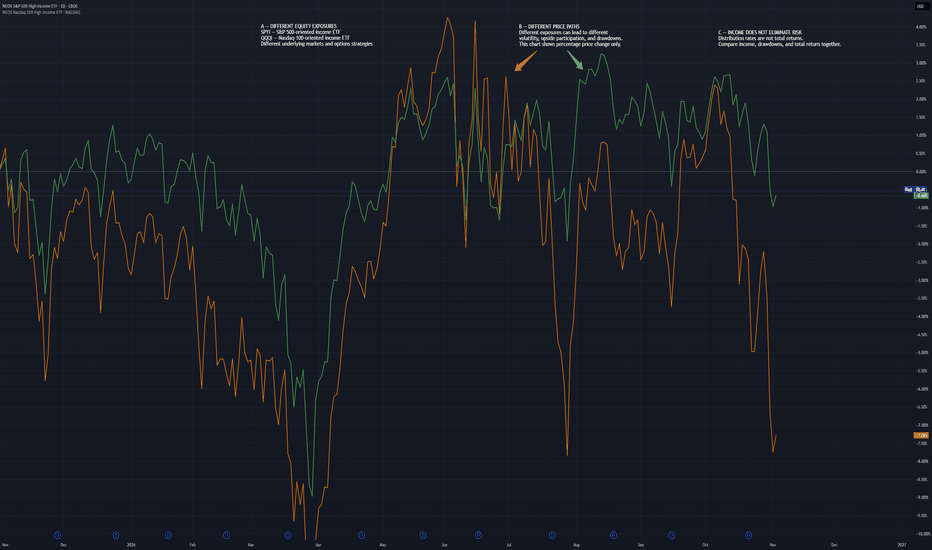
SPYI vs. QQQI: Income, Exposure & RiskIncome-oriented ETFs can pursue similar distribution objectives while maintaining meaningfully different market exposures and risk characteristics.
Two examples are the NEOS S&P 500 High Income ETF (SPYI) and the NEOS Nasdaq-100 High Income ETF (QQQI).
Both seek to generate monthly cash distributions through equity investments combined with options-based strategies.
However, similar income objectives do not mean the funds will experience identical investment outcomes.
Our comparison chart il