 ShortShort
 Short
Short
MAR - Reversal Strategy Long Setup
🍀Overview
I am not a discretionary technical analyst, so I rely on predefined setups rather than subjective chart analysis. I built the rules into a strategy to make the decision-making process more systematic.
The strategy has identified a qualifying setup, triggered an alert, and placed a long bracket order in accordance with its predefined rules.
🍀Process
Ticker : NASDAQ:MAR
Date : 09/09/2026
Timeframe : Daily
Direction : Long
Strategy : Reversal Strategy
Strategy Overview : Overview: A Reversal Strategy for Trading on the Daily Timeframe
Strategy Chart : Please refer to the 2nd screenshot
Signals
Main signal: RSI crossed above 30, indicating an exit from the oversold zone. This contributed a score of 0.5
Confirmation signal: The NATR Oscillator reached 100, exceeding the required threshold of 80. This contributed a score of 0.5
Signal Scoring
Long setup score = main signal score + confirmation signal score = 0.5 + 0.5 = 1.0
Long score threshold: 1.0
The long setup score met the required threshold. The strategy therefore placed a long bracket order.
Risk Management
Reward-to-risk ratio: 4:1
Entry: 331.52 (the close of the setup candle)
Stop distance: 29.80 (approximately 4x daily ATR)
Target distance: 119.23 (approximately 16x daily ATR)
Order Management : Bracket order
Limit entry: 331.52
Market stop: 301.72
Limit target: 450.75
Baseline
Assume the worst has already happened: the stop loss has been reached.
🍀Outcome
Trade Execution
09/09/2026: The daily candle closed, triggering the strategy to place a long bracket order.
10/09/2026: Price reached the trigger level, and the long entry filled.
Trade Status
Trading: active
P.S. I’m currently applying this strategy to the Nasdaq-100. Let me know which stock you’d like me to look at next.
Stay lucky!🍀


NKE - turn around betIdea:
Long bet on a turn-around, swing few months
80% discount from ATH
Buy zone: Below $40 to $35. NKE is approaching buy zone.
TP1: $50
TP2: $70
Hold rest for run, adjust stop as needed
Aggressive: 12 months Call option
Moderate: buy stock, sell 3 months covered call
Selling $35 put may also work
Disclaimer: This is for educational purposes only. I have Jun 2027 Call option and plan to add as it goes down below $40. Do your own DD at your own risk.
 Long
Long
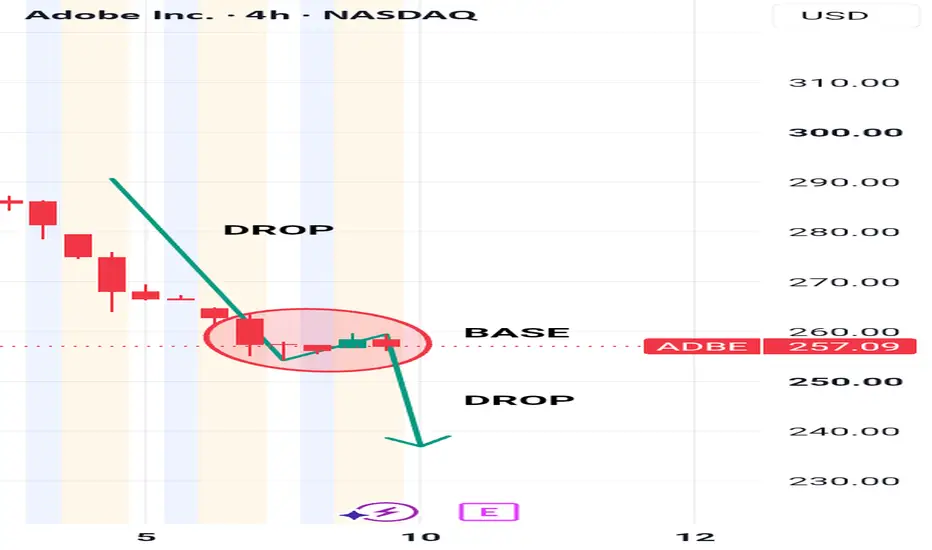
Falling more and more?ADOBE (ADBE): GOOD PERFORMANCE DOES NOT GUARANTEE A HIGHER STOCK PRICE
Adobe has once again demonstrated an important lesson for investors: strong fundamentals do not automatically translate into a rising stock price.
Adobe reported Q3 revenue of $6.76B, above Wall Street expectations of approximately $6.69B, while adjusted EPS of $6.13 also exceeded expectations. The company even raised its full-year guidance. Yet, the stock continued to sell off.
This is precisely why I believe traders must understand the difference between business performance and market price behaviour.
A company can deliver good earnings, strong revenue growth and improving AI adoption — yet the stock can still decline if market sentiment, positioning, expectations and price structure remain bearish.
PRICE ACTION COMES FIRST
Fundamentals tell us what the business is doing.
Price action tells us what the market is actually doing with that information.
If positive earnings cannot generate sustained buying pressure, that itself becomes valuable information.
The market is effectively saying:
«“Good results are already priced in, but investors are still not convinced about the future.”»
In Adobe's case, concerns surrounding AI competition, future growth expectations and the upcoming leadership transition continue to weigh on sentiment.
This is why I would not blindly buy ADBE simply because the company continues to report strong numbers.
SENTIMENT & LIQUIDITY MATTER
Markets are not driven by fundamentals alone.
Large players operate around liquidity, positioning, expectations and sentiment. When the broader market perception turns bearish, positive news can sometimes become an opportunity for existing holders to reduce exposure rather than a catalyst for a new bullish trend.
That is why we sometimes see the unusual situation where:
GOOD EARNINGS → STOCK FALLS
This is not necessarily irrational.
It can happen when the market had already priced in a much better outcome, or when investors remain concerned about the company's future despite strong current numbers.
MY BIAS ON ADBE
Personally, I remain bearish on Adobe's price structure.
The continued inability of ADBE to generate meaningful upside despite strong financial results suggests that the underlying market sentiment remains weak.
Until price action demonstrates a convincing structural reversal — such as reclaiming major resistance levels, establishing higher highs and higher lows, and showing genuine buying strength — I believe the risk of another leg lower remains significant.
Therefore, my current view is:
Good fundamentals ≠ guaranteed upside.
Strong earnings ≠ bullish price action.
Positive news ≠ immediate buying opportunity.
For me, PRICE ACTION remains the final judge.
And based on the current bearish structure and persistent weakness, I believe ADBE could potentially fall significantly lower before the market finally finds a durable bottom.
This is not a prediction that Adobe's business is failing.
It is a recognition that a good company can still have a bad stock chart — and a good quarter does not automatically create a bullish trend.
Watch the price, not just the story.
Trade at your own risk and decision.
Disclaimer: All My post just for education, personal opinion and not financial advice.
Short
 Long
Long
SPACEXAlways use 2x–3x leverage. We build positions in stages, both long and short.
Max 4% of your account as margin per position. Split that 4% into 3–6 entries.
Example: $100 account → max $4 margin per position. Split it as $0.5, then $1, then $1.5. So $0.5 × 3x = $1.5 position size.
Don't get greedy.
Only add when your ROI is above -100%. Better: wait a few days between add-ons. Sleep on it — you might end up adding from higher.
Keep half your account in cash as a reserve. Balanced.
In a short market: 1 long for every 3 shorts.
In a long market: 1 short for every 3 longs.
Every position's liq level should be at least 10x away.
Doubling your account in a day isn't hard — losing all of it isn't hard either. Play carefully. The market is waiting for you to gamble so it can take your money.
 Short
Short
AVO (Mission Produce): The Star Alignment Taking PlaceIf you are looking for a fundamentally backed breakout play hiding in plain sight, NASDAQ:AVO needs to be on your radar.
Looking at the daily chart, the price action over the last year has been incredibly choppy, trapped in a volatile range between $9.50 and $15.50. However, beneath this frustrating structural choppiness, a massive accumulation phase is taking place, backed by serious fundamental catalysts and heavy institutional conviction.
Here is why NASDAQ:AVO is positioned for a major upside breakout.
1. Structural Demand & The El Niño Hedge
The demand for avocados is experiencing durable, structural growth. U.S. avocado consumption is trending above 10 pounds per capita year-to-date, marking a 12% increase compared to the previous year.
While extreme weather patterns like El Niño frequently threaten agricultural yields (particularly in South America), Mission Produce's scale acts as a massive operational moat. They utilize a diversified global sourcing network to maintain supply when regional competitors struggle. This diversification is paying off: management expects 120 million to 130 million pounds of exportable production from their owned farms in Peru for the fiscal 2026 harvest season, up from 105 million pounds in fiscal 2025. They also reported a 38% year-over-year volume growth in the avocado category in Q3, driven by their Calavo acquisition and strong Mexican supply.
2. Heavy Insider Accumulation
When evaluating choppy, sideways charts, you follow the smart money. Corporate insiders at Mission Produce are loading the boat at these levels. Over the last 90 days, insiders have purchased over $44.7 million worth of stock on the open market. Directors and major shareholders have been aggressively accumulating shares. This level of localized insider buying is a massive vote of confidence that the current valuation is severely disconnected from the company's future cash flows.
3. The Earnings Catalyst
The company just reported its Q3 2026 earnings on September 8th, and it was a blowout.
Top and Bottom Line Beats: Revenue hit $450 million (up 26% year-over-year), crushing estimates of $371.1 million. Adjusted EPS came in at $0.18, easily beating the $0.12 estimate.
Synergies & Buybacks: Management raised the estimated annualized synergies from their recent Calavo acquisition to over $30 million. To top it off, the board just authorized a massive $100 million share repurchase program.
The Technical Execution
Looking at the chart, the stock is currently trading around $13.24, sitting directly on top of the dynamic moving average. The massive choppy structure over the last year has shaken out weak hands, leaving a coiled spring.
Given the fundamental strength of the Q3 earnings, the massive share buyback program, and relentless insider buying, this accumulation base is primed to resolve upward. I am looking for a high-volume daily close above the local resistance block at $14.50 to confirm the breakout, with initial targets scaling into the $16.50 consensus price target zone.
Are you accumulating NASDAQ:AVO alongside the insiders, or waiting for a confirmed technical breakout? Let me know your targets below! 👇
 Long
Long
Full disclosure: Gray Hat Insiders v. White Hat OutsidersINTC: Who do we want running the company? Insiders that are entrenched and gray/black or outsiders that are white hats? White hats, right? INTELFORCEDRETIREMENT.EMPTYDOMAINS.COM


META | Internal Corrections Inside An External Uptrend
By analyzing the #META (Meta Platforms) chart on the 4H timeframe, we can see a market that looks far worse than its structure actually is. Price has fallen a long way, but the distinction between internal and external structure is what separates a deep correction from a broken trend — and on this chart, that distinction still matters.
4H Timeframe
Start with what defines the trend, because everything else is subordinate to it. The Protected Low at $481.34 is the external structure. It has not been broken, and there have been no daily closes beneath it. Until that changes, the higher timeframe trend remains bullish regardless of how the intervening price action looks.
And the intervening price action has looked rough. Price printed an iCHoCH , then an iBOS , then more of the same on the way down. But every one of those breaks is internal structure. None of them broke the external swing. What they represent are corrections inside the larger bullish wave, not a reversal of it — and reading them as a trend change is the most common error this kind of chart produces.
The most recent sequence tells the current story. Price rallied with force and printed a bullish iCHoCH , then corrected down into the Order Block ($521.05 – $539.97) and reacted from it. That reaction was real — price turned and moved higher off the block. But it has since rolled over again and is now trading around $544.37 , sitting just above that same block.
Above price, the structure is clearly mapped. $613.02 is the level that changes the path. Above it sit the buy-side liquidity pools at $690.99 and $743.94 , with the upper Order Block ($744.37 – $758.46) resting directly above the higher pool.
Below, if the external structure were to fail, sell-side liquidity rests at $443.26 and again at $415.28 .
The Bias
Two paths are live here, and which one develops depends on a single level.
Scenario A — the lower route.
If price breaks the current low rather than holding it, the structure suggests a further move down before any recovery — likely back into or beneath the Order Block at $521.05 – $539.97 to complete the correction.
That would not break anything. As long as the Protected Low at $481.34 holds on a closing basis, a deeper flush remains an internal correction, and from that low the structure still points back toward the buy-side liquidity above.
Scenario B — the direct route.
If instead price rallies from here and reclaims $613.02 , the correction ends early. That level is the one that separates a market still working through its pullback from one that has finished it, and a clean move above it opens the path directly toward $690.99 and then $743.94 .
The distinction matters for positioning. Beneath $613.02, the structure is still corrective and each rally is unproven. Above it, the internal damage has been repaired and the external trend reasserts.
The invalidation.
Plainly stated: a decisive daily close beneath the Protected Low at $481.34 ends this. That is the external swing, and losing it would convert every internal break on this chart from a correction into the early stages of a genuine trend reversal, with the liquidity at $443.26 and $415.28 becoming the objective.
And the rule that governs all of it: a break is a candle close, not a wick . That applies to $613.02 on the way up and to $481.34 on the way down.
Fundamental Backdrop
This is the part of the analysis where I have to be direct, because the news flow around this company has deteriorated meaningfully and the structure cannot price all of it.
The starting point was the quarter. Meta reported revenue of $60.8bn , which beat expectations, but earnings of $6.18 per share against $7.19 expected — a substantial miss. The stock fell 3.4% on 12 August as the market worked through it.
What has followed is heavier than an earnings miss. Oral arguments have begun in a unified case brought by Attorneys General from 29 states , alleging that Meta knowingly fostered addictive behaviour among teenagers and children. A separate high-stakes child-safety trial is proceeding in California. Litigation of this scale is genuinely difficult to price — the range of outcomes is wide, the timelines are long, and the reputational dimension sits alongside the financial one.
Alongside that, a German advocacy group has filed a criminal complaint concerning Meta's smart glasses on privacy grounds, which complicates European expansion for a product line the company has been building around. And the planned acquisition of Chinese startup Manus has collapsed, adding a geopolitical constraint to the AI strategy.
Meta fell roughly 4% on Monday as investors weighed the legal exposure alongside questions about that AI strategy, and the stock has now given back more than a quarter of its value from its recent high. It has repeatedly failed to hold recoveries above $600.
Here is the honest position. The technical structure argues that this remains an internal correction within an intact external trend, and that argument is valid on its own terms — the Protected Low has held. But the fundamental picture has moved against it since the last earnings print, and legal overhangs of this type tend to compress valuations for as long as they remain unresolved rather than resolving quickly in either direction.
That combination does not invalidate the structural read. It does mean the level that matters most on this chart is not $613.02 on the upside — it is $481.34 on the downside, and it deserves more attention than it usually would.
This analysis will be updated as the market evolves.
Best Regards, BigBeluga


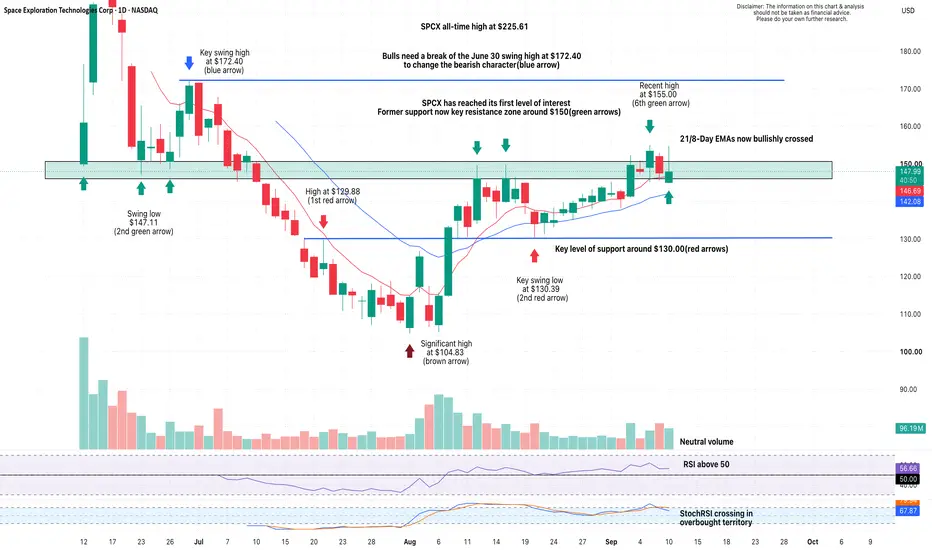
SPCX: Bulls Reclaim $150 — Can They Now Hold It?Recovery Continues From the August Low
SPCX has staged a strong recovery from its $104.88 August low, gradually rebuilding structure and pushing back into the major former support area around $150.
The Big Test Is Happening Now
Price has reclaimed the $150 region and is now attempting to establish it as support once again. This is an important test for the recovery, with buyers needing to prove they can defend an area that previously played a major role in price structure.
Short-Term Trend Continues to Improve
The 21/8-day EMAs have now crossed bullishly, with price trading above both averages. RSI also remains above 50, although neutral volume suggests buyers are yet to show particularly strong conviction.
What Comes Next If $150 Holds?
Successfully establishing $150 as support would strengthen the bullish case and keep the recovery moving in the right direction. Beyond there, the June 30 swing high around $172.40 becomes the next major structural level to watch.
In Summary
SPCX has reached an important point in its recovery, with price reclaiming the major former support area around $150 and now attempting to hold it from above. The 21/8-day EMAs have crossed bullishly, and the RSI remains above 50, adding weight to the improving picture. The big test is whether buyers can now establish $150 as support. If they can, attention can gradually shift towards the $172.40 structural high.
$MU - When to Long, When to ShortNASDAQ:MU - When to Long, When to Short
New video covering the key levels and setups for both the long and short side.
I’ll break down where I would enter, where the setup fails, and the targets to watch.
NASDAQ:MU CBOE:DRAM NASDAQ:SNDK #Semiconductor #Memory


Sony Gap Fill Near Historic Resistance Line - Is it over?So, dead simple observation more than an idea here.
Quite simple, the historic resistance line for Sony is 30 dollars (The Dotcom Bubble peak).
We recently made a move that left a gap.
Could this be "It" for SONY?
Not a trade per se, just looking for discussion here around this observation.


Boeing May Face Breakdown RiskBoeing has limped for months, and some traders may see risk of a breakdown.
The first pattern on today’s chart is the series of lower highs since January. This contrasts with breakouts in both the S&P 500 and the broader industrial sector, potentially reflecting a lack of relative strength.
Second, the 50-day simple moving average (SMA) recently had a “death cross” below the 200-day SMA.
Third, the 8-day exponential moving average (EMA) is under the 21-day EMA. MACD is also falling. Those signals may be consistent with short-term bearishness.
Next, the aerospace company bounced around $205 in July. It’s been trying to hold in the same area in recent weeks. Traders could monitor that line for evidence of a breakdown.
Finally, they might eye November’s 52-week low of $176.77 as a potential level to test.
TradeStation has, for decades, advanced the trading industry, providing access to stocks, options and futures. If you're born to trade, we could be for you. Learn more here about TradingView’s Broker of the Year!
Past performance, whether actual or indicated by historical tests of strategies, is no guarantee of future performance or success. There is a possibility that you may sustain a loss equal to or greater than your entire investment regardless of which asset class you trade (equities, options or futures); therefore, you should not invest or risk money that you cannot afford to lose. Online trading is not suitable for all investors. View the document titled Characteristics and Risks of Standardized Options at www.TradeStation.com . Before trading any asset class, customers must read the relevant risk disclosure statements on www.TradeStation.com . System access and trade placement and execution may be delayed or fail due to market volatility and volume, quote delays, system and software errors, Internet traffic, outages and other factors.
Securities and futures trading is offered to self-directed customers by TradeStation Securities, Inc., a broker-dealer registered with the Securities and Exchange Commission and a futures commission merchant licensed with the Commodity Futures Trading Commission). TradeStation Securities is a member of the Financial Industry Regulatory Authority, the National Futures Association, and a number of exchanges.
TradeStation Securities, Inc. and TradeStation Technologies, Inc. are each wholly owned subsidiaries of TradeStation Group, Inc., both operating, and providing products and services, under the TradeStation brand and trademark. When applying for, or purchasing, accounts, subscriptions, products and services, it is important that you know which company you will be dealing with. Visit www.TradeStation.com for further important information explaining what this means.


If you were waiting for a better entry on SEDG...This is itI called the previous SEDG rally at these levels. It has since round-tripped, and is retesting this key S/R zone, which is right in the macro OTE fib sweet spot.
SEDG also just co-authored a white paper with NVDIA, something about ai data center power converters yada yada... I mostly trade what I see on the charts, but some bullish news & a credible AI "picks and shovels" angle sure doesn't hurt.
If you missed the last rally, now is your shot at redemption.
Trader Donovan (fka CryptoDonovan)
 Long
Long
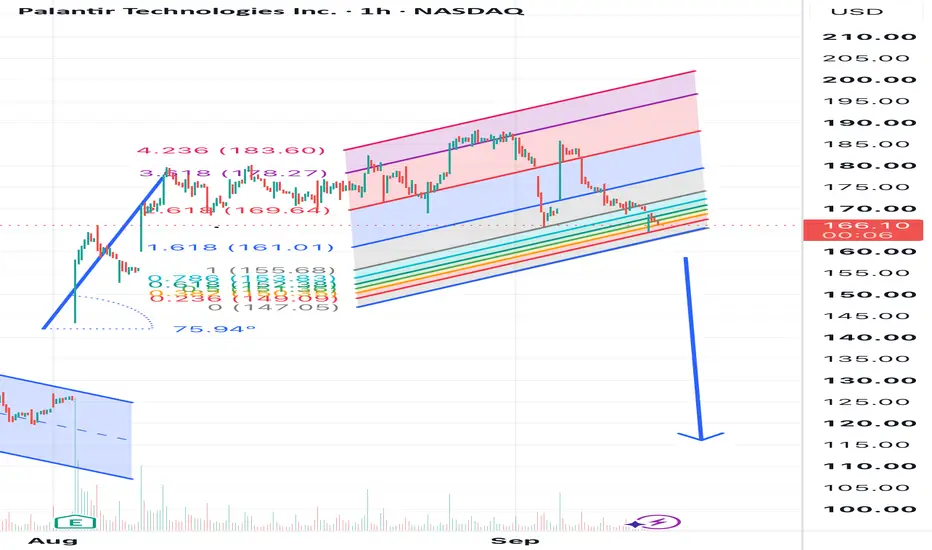
Palantir techAlthough Palantir (PLTR) faces a fundamental downside due to its sky-high valuation metrics—trading at historical Price-to-Sales multiples that echo the 2000 Dot-Com peak—the stock remains heavily vulnerable to a sharp short squeeze before any major correction unfolds. Institutional heavyweights and retail traders aggressively betting against its extreme multiples could easily get caught off guard by unexpected military contract expansions, strong quarterly earnings beats, or artificial intelligence hype spikes. As these short sellers rush to cover their positions to limit losses, sudden panicky buying power can temporarily drive the share price to parabolic new highs, defying fundamental gravity before the eventual, long-term valuation breakdown occurs

VRT - Need to hold $242 or we could go much lower...Hello Everyone!
We need to hold $442.
This is a major level that if we don't hold, we could break the local low.
This could set up a move much lower.
If we ever get to the purple box (which is possible), I would load up huge.
A sneaky long at $442 could be ok depending on what the price action we create on the move down to this level looks like at the time of entry.
If we have resistance that is untested right above the $442 entry, there would be no long and I would look for shorts instead.
Thanks for reading and good luck!


Good Opportunity - Double DigitsLong-term accumulation, clearly a lot more buying than selling and volume has gone through the roof. Company has a good projects in the pipeline. Valuation is cheap compared to other miners / HPC hybrids. I expect BTC to go back to 100k+ latest by year end, too. Despite volatility, it does respect fibs quite well. We are currently back at long term POC. If we see BTC dropping again, we might hit $2 one more time but both are high volatility assets and I do not care. This is buy and hold for me. Price target looks ambitious but could be an acquisition or simply fomo. NFA.
 Long
Long
Back to the Broken ChannelRivian struggling to get back inside the green channel
Should reach around $18 before hitting the green channel again.
Perhaps this time we can break back through. To add to it we had a nice weekly Golden Cross (50MA and 200MA crossing) a few weeks back.
Lets see if this adds some nice momentum this time.
T1 - $18
T2 - Gap fill
T3 - $22
 Long
Long
Apple Finally Folded. But Is the New iPhone Enough for Traders?Apple events have developed a familiar rhythm in recent years: faster chip, better camera, longer battery life, barely noticeable tweaks here and there. But not the latest event.
At its “Surprise and Shine” product presentation, streamed live on YouTube , Apple NASDAQ:AAPL unveiled the iPhone Duo (who else got thrown off by the name, thinking it’s two separate things?), its first foldable smartphone and the biggest change to the iPhone's physical design since Steve Jobs introduced the OG.
The $1,999 device folds out from a conventional 5.4-inch screen into a 7.6-inch display, runs Apple's new A20 Pro chip and supports two apps side by side.
Alongside it came the iPhone 18 Pro and Pro Max, upgraded Watches, new AirPods and a much more prominent role for Apple's revamped Siri AI.
That’s all fine and dandy for consumers but can any of it move the needle for a company already worth trillions? Apple is the second-biggest company in the world , right after Nvidia NASDAQ:NVDA .
💰 A $2,000 iPhone Changes the Math
The Duo ( the “Ultra” rumor was way off ) plays a key role because Apple doesn't necessarily need to sell hundreds of millions of them.
At $1,999, Apple has created an entirely new tier above its conventional premium smartphones. The iPhone 18 Pro now starts at $1,199 and the Pro Max at $1,299, both $100 higher than their predecessors.
Revenue can grow in two main ways: sell more products or make more money from each one. With global smartphone growth relatively mature, Apple increasingly has an incentive to lean on the second lever.
📊 The Duo Doesn't Need to Beat the iPhone
Foldables still account for less than 5% of global smartphone sales, meaning Apple isn't entering an enormous established market. It's betting that its arrival can make the category considerably bigger.
Bloomberg Intelligence estimates Apple could sell around 14 million Duo units during its first 12 months. At $1,999 each, that could translate into roughly $28 billion in revenue before considering storage upgrades, accessories or additional services.
For perspective, that's nowhere near replacing the traditional iPhone business that brings around $50 billion every quarter .
If the Duo attracts Apple's highest-spending customers, encourages upgrades and pulls users deeper into services, it could become financially meaningful without ever becoming the company's highest-volume phone.
That's something traders should watch carefully once preorder and delivery data begin arriving.
🤖 Then There's the AI Question
Hardware wasn't Apple's only problem entering this event. The company has spent much of the AI boom watching Nvidia NASDAQ:NVDA , Microsoft NASDAQ:MSFT , Alphabet NASDAQ:GOOGL and others capture investors' imagination (and cash) while questions grew around Apple's own strategy.
New CEO John Ternus tried to answer that by describing the iPhone as an "intelligent personal hub." Siri AI can use personal context across messages, emails and photos, understand what's happening onscreen and perform actions across Apple and third-party apps.
Apple is also leaning heavily into privacy, processing AI on-device where possible and using its Private Cloud Compute infrastructure when more horsepower is required. That's a very Apple approach to AI.
📉 So Why Did Apple Shares Fall?
After all that, Apple shares finished Wednesday down about 0.3% at $315.34.
Apple had already rallied about 15% since late June (16% year to date) heading into the event, while excitement around the foldable phone had been building for months.
The stock also entered the launch trading at roughly 33 times expected earnings, versus a 10-year average around 23 times.
Here’s a nice market lesson: A good announcement and a good trade aren't always the same thing.
Markets don't reward companies simply for delivering good news. They reward them for delivering something better than what investors have already priced in. And the Duo was hardly a secret by Wednesday morning.
📰 The Classic Sell-the-News Problem
Apple launch days are actually a nice example of this phenomenon.
Bank of America research found that Apple has often shown a muted sell-the-news reaction immediately after iPhone launches, only to perform better over the following weeks.
Since the original iPhone launched in 2007, Apple shares have risen over the subsequent 60 days after 17 different iPhone reveal events. That's not a trading signal by itself (as always, DYOR). History doesn't owe anyone an encore.
But it highlights the difference between an event catalyst and the fundamental information that follows it. For what it’s worth, Thursday trading is showing Apple shares are ticking higher by nearly 2%, so there's that.
👀 Watch Sales, Margins and Siri
From here on, three things probably matter more than another spec comparison.
First, Duo demand. Does a meaningful number of consumers actually pay $1,999 for a folding iPhone?
Second, margins. Apple is raising prices while memory and other component costs remain elevated . Higher average selling prices are great only if they protect or expand profitability.
Third, AI adoption. Siri AI needs to become something customers actually use, rather than another feature occupying a few minutes of keynote time.
Those answers will emerge through preorder demand, delivery times, supply-chain estimates and ultimately Apple's earnings. The fourth-quarter earnings season is about a month away, so keep an eye on the Earnings Calendar .
🍎 Off to you : Excited about Apple’s next chapter under the new chief exec? Share your thoughts in the comments!


Google : Testing 200 EMA & Trendline ConfluenceAlphabet (GOOG 1D): Testing 200 EMA & Trendline Confluence – Time for Early Longs? 🌐🚀
🧠 Fundamental Overview (Q2 2026 & Outlook):
Alphabet Inc. (NASDAQ: GOOG / GOOGL) continues to show exceptional operational growth, anchored by the massive scaling of its cloud and artificial intelligence infrastructure:
* Headline Earnings (Q2 2026): Revenue climbed +24% YoY to $119.80 Billion, topping consensus estimates ($116.93B). GAAP diluted EPS printed at $9.11 (boosted by unrealized equity valuation gains), while operational non-GAAP EPS was solid at ~$2.85.
* Cloud & AI Acceleration: Google Cloud surged +82% YoY to $24.77 Billion, with segment operating income tripling to $8.8 Billion and backlog topping $514 Billion.
* CapEx Scrutiny: Full-year 2026 CapEx guidance was raised to $195B–$205B ($44.9B deployed in Q2 alone), as aggressive server and data center commitments continue to weigh on short-term free cash flow.
* Next Earnings Date (Q3 2026): Tentatively scheduled for Wednesday, October 28, 2026 (after market close), with consensus modeling an EPS of ~$2.99.
📊 Technical Breakdown (1D Timeframe):
Zooming into the daily chart, price action is currently sitting right inside a high-interest confluence pocket:
1️⃣ Trendline B & C Confluence with 200 EMA: The price is bouncing directly off the rising 200-day EMA ($325.01 USD) . This dynamic baseline has proven to be an institutional line in the sand for Google, holding strong previously on March 30 and July 24. Right here, we also observe a potential false breakdown of Trendline B with price finding support along Trendline C .
2️⃣ Fibonacci "Golden" Accumulation Zone: Measuring the major expansion swing from the $271.54 low up to the $405.28 peak, the price area between $322.63 (61.8% Fib) and $338.41 (50% Fib) marks a textbook accumulation zone. Current prices around $328 sit squarely within this high-probability demand territory.
3️⃣ Oscillators & Momentum Dynamics: Both MACD and RSI (sitting at 38.58) continue to trade in a subdued, corrective posture, compressing without violent swings in either direction. Crucially, neither oscillator is flashing bearish divergence on this bottoming structure, meaning selling pressure is running out of steam rather than accelerating.
4️⃣ Volume Structure: Trading volume has remained low (5.15M–5.55M), which has been a consistent theme across technical inflection points for GOOG this year. While lack of volume doesn't immediately validate an explosive reversal, it indicates an exhaustion of active selling supply.
🎯 Trading Thesis & Execution Plan:
The current structure offers an attractive risk-to-reward setup for early long positions, backed by a technical rebound across Trendlines B and C, the 61.8% Fibonacci zone, and the 200-day EMA.
* Target 1 (TP1): $397 – $405 USD (Confluence of the 61.8% Fibonacci extension and retest of the recent macro highs).
* Target 2 (TP2): $448 USD (Full measured Wave 5 impulse extension).
* Invalidation / Stop Loss: A decisive daily close below the 200 EMA and the Trendline B/C cluster around $320 USD completely invalidates the long thesis, suggesting a deeper structural correction.
Are you bidding the 200 EMA bounce on Google here, or waiting for a breakout above Trendline A? Share your views below! 👇
---
*⚠️ Disclaimer: This analysis is strictly for educational purposes and intended solely to intellectually enrich our trading community. It does NOT constitute financial or investment advice. Always perform your own research and manage your risk strictly.*
 Long
Long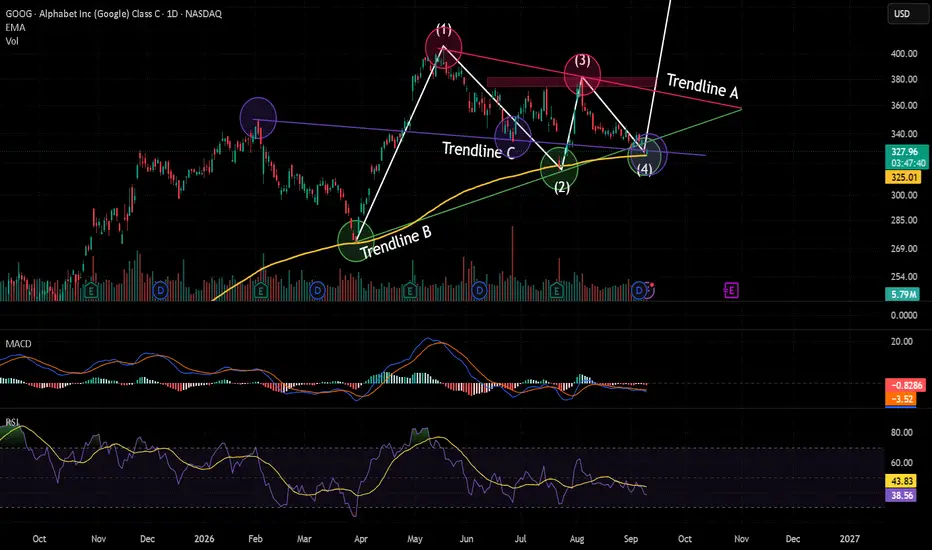
A Texas Democrat bought Procter & Gamble Co. shares. Support.A Texas Democrat bought Procter & Gamble Co. shares. PG shares are holding support at $141.70. BlackRock increased its stake in PG.
Procter & Gamble (NYSE: PG) ➡️ has corrected by nearly -24% from its high on November 11, 2024. I reviewed the stock's historical behavior and found a rather interesting pattern.
➖ If the price touched a 5 SMA during a correction on the 3-week timeframe, measuring the same size from that point often reveals a statistical bottom. I have marked this on the chart for the recent years.
➖ I noted strong support from the 3-month chart's mirror level. The price is holding this support, and judging by the fact that large funds like BlackRock are accumulating positions in this range around $141.70.
Politicians
Texas Democrat Lloyd Doggett bought PG shares on August 16, 2026; the trade data was published on September 8, 2026 (a very successful politician, judging by the purchase chart, I will keep an eye on him).
Entry point and targets?
Entry point: $142.34, we are right at the support of $141.70.
Nearest target for this move: $159.00, a modest +11.70%.
I send my regards to Aladdin from BlackRock 😀🧞.
For educational purposes only. Not financial advice. 🫡
NYSE:PG #BlackRock #Democrat #Texas
 Long
Long
9/10/26 - $zvia - Another cheap option9/10/26 :: VROCKSTAR :: NYSE:ZVIA
Another cheap option
- i like the can rebrand (skinny can + good visual)
- problem is i can't see myself drinking it regularly. i've tried it on multiple occasions and perhaps i'm just too far indoctrinated by the big-cola HFCS or mexican cola mafia
- nevertheless, this is a large net cash co (on first look), doesn't burn, seems to be in the right zipcode of low sugar, no fake heart-attack-chemical sugar (it's stevia-deriv)
- think given the SG&A, it's hard for co to stand alone ex some flavor breakthru and it's best option is a take out tbh
- at $1.25... hard to see much downside, and upside is probably a 2x on a takeout. fair value in my estimation is something as simple as:
- $160M in sales, $80M in GP and $80M in SG&A looks like $80M in sales to an acq (strip out bad channels, re-align, possibly), $40M in GP and $20M in SG&A or $20M in profit. take out another $5-10M for restructure + tax and you're looking at $10M run rate cash business. put a 15% cash hurdle on it and no growth (which you'd not buy it if you didn't assume growth) and you're at 10/.15 = $70M equity which compared to the $50M (round numbers here) is about 40% upside or $1.75... that's probably base case fair value today all else equal. so to buy it you'd need to pay minimally $2 probably $2.5+ (esp given the size)
- similar to NASDAQ:GRAB logic, it's a name that can sit as a 50 bps or 1% position and i don't need to babysit it much. better than cash. interesting spot to sit while i do more work.
- flagging for the patient special situation people.
- lmk if you've tried the product or have a view on the stock or above thesis, anon, k?
V
 Long
Long