US10Y Is Rising Again: Could 5.1% Trigger Pressure Across GlobalThe U.S. 10-Year Treasury Yield ( TVC:US10Y ) is one of the most important benchmarks for global interest rates and financial conditions.
A strong rise in US10Y can affect U.S. stocks, Gold, Silver, Bitcoin, and the broader crypto market.
Could US10Y continue rising toward 5.1% and create another wave of pressure across financial markets?
Macro Outlook
US10Y represents the yield investors receive from holding a 10-year U.S. Treasury bond and is widely used as a benchmark for long-term interest rates.
Its market impact can be summarized simply:
U.S. Stocks: Higher yields increase borrowing costs and pressure valuations, particularly in growth and technology stocks.
Gold & Silver: Higher yields—especially real yields—and a stronger U.S. Dollar generally create pressure on non-yielding precious metals.
Bitcoin & Crypto: Rising yields can tighten financial conditions, strengthen the Dollar, and reduce risk appetite.
For this reason, US10Y is an important macro indicator to monitor alongside the U.S. Dollar Index(DXY).
Technical Analysis
On the daily time frame, US10Y is approaching an important Resistance Zone after moving inside an Ascending Channel for approximately 190 days.
From an Elliott Wave perspective, the U.S. 10-Year Treasury Yield appears to be completing the main Wave X inside the Ascending Channel.
💡 Educational Note: Rising Treasury yields generally indicate tighter financial conditions, which can reduce demand for risk assets and increase pressure on equities, precious metals, and cryptocurrencies.
Considering recent U.S. economic data, persistent inflationary pressures, and geopolitical risks in the Middle East, I expect US10Y to continue moving higher.
The next major upside target could be around 5.1%.
If this scenario develops, higher Treasury yields could remain an important risk factor for the S&P 500, Nasdaq, Gold, Silver, Bitcoin, and the broader crypto market.
Target: 5.1%
Do you think the U.S. 10-Year Treasury Yield can reach 5.1%?
🟢 Yes
🔴 No
📌 U.S. 10-Year Treasury Yield(US10Y), Daily time frame.
🚀 If this analysis helps your trading plan, a BOOST would help more traders discover it.  Long
Long
Yields Surging in Tandem: Extended Momentum Test Key CeilingReality Check
We’ve been bullish on Yield. Many posts on that. However, our earlier expectation for a temporary pause or consolidation across treasury yields simply did not play out. Instead of cooling off, upside momentum accelerated sharply, blowing straight through intermediate levels much faster than anticipated.
However, looking at the daily timeframes now, the technical posture has shifted from a healthy trend expansion into heavily stretched territory. Both the 10 yr and 2 yr yields are pressing into critical overhead resistance with technical indicators flashing clear exhaustion signals.
Why Both Yields Rising Together Matters
A fast, simultaneous advance across the curve creates dual pressure on the broader financial system:
10 Yr: TVC:TNX is now printing well above the peaks seen during the regional banking stress in early 2023. Higher back end rates erode the market value of legacy bonds and fixed rate loan books sitting on balance sheets.
2 Yr: The front end broke its 2023 base and went vertical. Higher front end yields force institutions to compete aggressively for cash against high money market returns, keeping severe upward pressure on deposit funding costs.
The speed of this move is what creates friction. Fast velocity prevents balance sheets from repricing orderly before funding costs jump.
Key Scenarios Going Forward
Let’s try again (High Probability):
With daily oscillators this extended, the setup favors a breather, a mean reversion or sideways consolidation back toward the rising short term moving averages. For the 2 year, a rest would allow market participants to digest the breakout above the 2023 trend band without instantly triggering deeper liquidity stress.
Continuation Risk:
If yields ignore overbought readings and produce daily closes firmly above the upper horizontal ceilings without hesitation, it signals an aggressive macro repricing where technical overextension takes a back seat to raw liquidity demands.
TGtg!
US 10-Year Notes Near 19-Year Highs at 5%The benchmark 10-year US Treasury note is approaching a major milestone, and this is the type of move that can have consequences across the macro landscape, from USD to stocks to commodities.
The 5% level is important as this is what establishes the current high, and it traded for just one morning on October 23rd of 2023. At the time, there was a bit of pain starting to show in stocks as the rally that started a year earlier was pulling back, and the big fear was an oncoming maturity wall of US debt would force an influx of fresh supply to pay off principal. The US Treasury Secretary at the time, Janet Yellen, shifted much of that borrowing to shorter-term issues and invariably that kicked the can down the road, and this is now a problem for current US Treasury Secretary Scott Bessent.
A move above the 5% level means the upcoming maturity wall in US debt will bear a higher interest expense, and if taxes aren't going up, that only presses towards larger deficits, which means more borrowing and even more supply and less reason for buyers to want to hold that paper.
Of course, the US Treasury is not without options, such as we saw from the larger buyback announcement a few weeks ago. But a move above that 5% mark can drive several other key markets when or if it happens, and so far, we've come just one single basis point away from a test there.
The big level above that is 5.25%, which traded twice back in 2006 and 2007 before yields ultimately collapsed around the Financial Collapse, driven by an influx of safe haven flows rushing into the relative safety of USTs. - JS Russia In Trouble! Dutch Disease!Russia is walking into a wartime version of Dutch disease:
Energy cash flows + defense spending temporarily mask weakening civilian productivity and diversification.
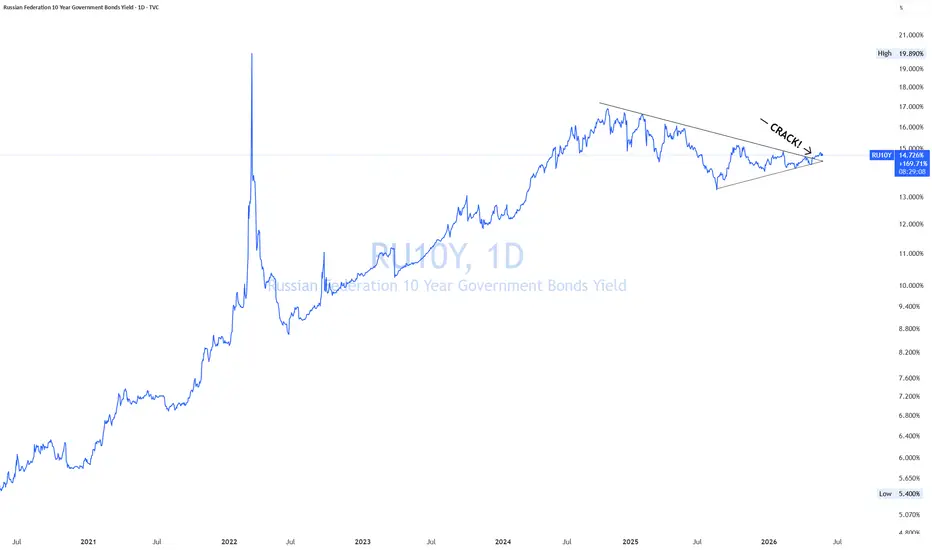
High yields despite controls are the tell.
Resource dependence feels strong… until the economy forgets how to do anything else.
High commodity revenues + state-directed spending + defense concentration can temporarily prop up nominal growth while quietly hollowing out productive diversification.
Dutch disease is when a country becomes so dependent on one dominant export sector that the rest of the economy slowly weakens underneath it.
In Russia’s case:
Oil, gas, and commodities bring in large foreign revenues.
The state then channels that money heavily into defense, government spending, and politically favored sectors.
The ruble and domestic cost structure become distorted around that resource flow.
Labor, capital, and talent get pulled toward energy and military production instead of diversified civilian industries.
The result:
Civilian manufacturing weakens,
innovation slows,
productivity outside the commodity sector lags,
imports become structurally necessary,
and the economy becomes increasingly dependent on commodity prices staying high.
Russia’s version is more dangerous because it’s layered with:
sanctions, (Trump is easing to help)
wartime spending,
capital controls,
labor shortages,
and elevated interest rates.
So instead of classic Dutch disease where a strong currency kills industry, Russia risks a “state-war-resource dependency loop” :
oil/gas fund the state,
the state funds war,
War absorbs labor/resources,
civilian sectors weaken,
dependence on commodities grows even more.
That’s why high bond yields matter. They’re often the market quietly saying:
“This growth may not be structurally healthy.”
If you enjoy the work: 👉 Drop a solid comment. Let’s push it to 7,000 and keep building a community grounded in raw truth, not hype.  Long
Long
Long 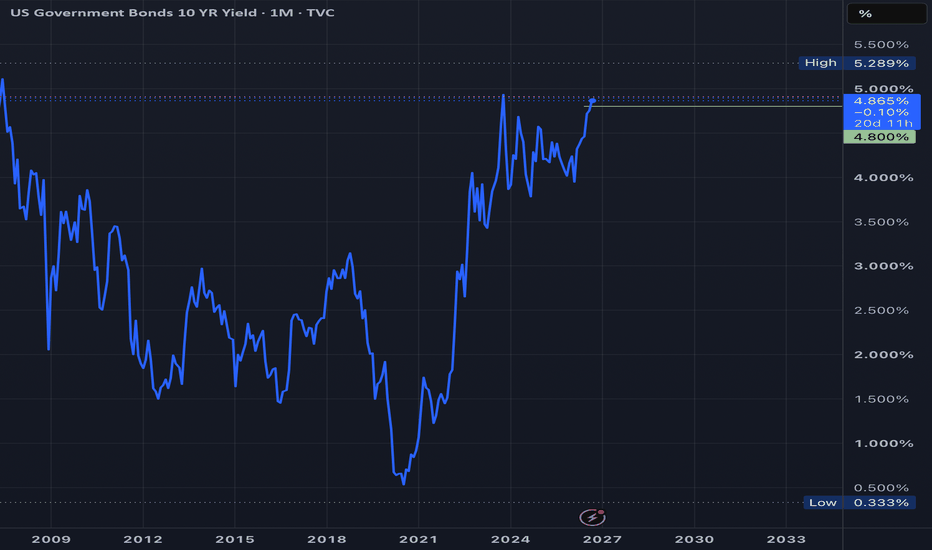
Long 
USA/JAPAN/FRANCE, the public debt challengeThe rise in long-term bond yields is currently a major fundamental challenge in the Western world. The accumulation of budget deficits each year is fueling public debt, which now exceeds 100% of GDP in most major Western economies.
This public debt generates an annual interest burden that takes up an increasingly large share of government spending, thereby reducing the financing available for the real economy.
In the United States, for example, the annual debt service burden related to interest payments represents 18% of the federal budget.
It is essentially because of this public debt trajectory that long-term yields are following a structurally upward trend, putting increasing pressure on governments and therefore on companies.
But the public debt situation and public debt service burden vary from one economy to another.
I therefore turned to a comparative analysis of the situations in the United States, Japan and France. When it comes to public debt, each of these three countries has both strengths and weaknesses.
France has public debt of around 117% of GDP, with an interest burden representing approximately 13% of the government budget. The French problem is above all the combination of a high budget deficit, weak economic growth and rising interest rates. Debt dynamics are therefore particularly difficult to stabilize without reducing the deficit.
The table below reveals the main information regarding public debt service in three major Western countries: the United States, Japan and France.
The United States presents a different situation. With public debt at around 125% of GDP, the level of indebtedness is high, but above all, the budget deficit remains extremely large. The interest burden has already reached approximately 18% of the federal budget, representing a genuine risk to US fiscal credibility. The United States nevertheless retains a considerable advantage: the dollar is the world's main reserve currency and the Treasury market remains extremely deep and liquid.
Japan is yet another different case. Its public debt reaches approximately 245% of GDP, by far the highest level among the three countries. Yet its interest burden represents only around 10.5% of the budget, notably thanks to still relatively low interest rates. The Japanese risk is therefore less about the current level of the interest burden than about the speed at which it could increase if long-term yields continue to rise.
Finally, foreign ownership is another important factor. It is much higher in France, at around 56%, than in the United States, at around 30%, and Japan, at around 12.5%. A strong reliance on foreign investors can make debt financing more sensitive to a loss of confidence.
Ultimately, Japan has the largest debt, the United States has the heaviest interest burden, and France currently appears particularly vulnerable to the combination of a high deficit, weak growth and dependence on foreign investors.
DISCLAIMER:
This content is intended for individuals who are familiar with financial markets and instruments and is for information purposes only. The presented idea (including market commentary, market data and observations) is not a work product of any research department of Swissquote or its affiliates. This material is intended to highlight market action and does not constitute investment, legal or tax advice. If you are a retail investor or lack experience in trading complex financial products, it is advisable to seek professional advice from licensed advisor before making any financial decisions.
This content is not intended to manipulate the market or encourage any specific financial behavior.
Swissquote makes no representation or warranty as to the quality, completeness, accuracy, comprehensiveness or non-infringement of such content. The views expressed are those of the consultant and are provided for educational purposes only. Any information provided relating to a product or market should not be construed as recommending an investment strategy or transaction. Past performance is not a guarantee of future results.
Swissquote and its employees and representatives shall in no event be held liable for any damages or losses arising directly or indirectly from decisions made on the basis of this content.
The use of any third-party brands or trademarks is for information only and does not imply endorsement by Swissquote, or that the trademark owner has authorised Swissquote to promote its products or services.
Swissquote is the marketing brand for the activities of Swissquote Bank Ltd (Switzerland) regulated by FINMA, Swissquote Capital Markets Limited regulated by CySEC (Cyprus), Swissquote Bank Europe SA (Luxembourg) regulated by the CSSF, Swissquote Ltd (UK) regulated by the FCA, Swissquote Financial Services (Malta) Ltd regulated by the Malta Financial Services Authority, Swissquote MEA Ltd. (UAE) regulated by the Dubai Financial Services Authority, Swissquote Pte Ltd (Singapore) regulated by the Monetary Authority of Singapore, Swissquote Asia Limited (Hong Kong) licensed by the Hong Kong Securities and Futures Commission (SFC) and Swissquote South Africa (Pty) Ltd supervised by the FSCA.
Products and services of Swissquote are only intended for those permitted to receive them under local law.
All investments carry a degree of risk. The risk of loss in trading or holding financial instruments can be substantial. The value of financial instruments, including but not limited to stocks, bonds, cryptocurrencies, and other assets, can fluctuate both upwards and downwards. There is a significant risk of financial loss when buying, selling, holding, staking, or investing in these instruments. SQBE makes no recommendations regarding any specific investment, transaction, or the use of any particular investment strategy.
CFDs are complex instruments and come with a high risk of losing money rapidly due to leverage. The vast majority of retail client accounts suffer capital losses when trading in CFDs. You should consider whether you understand how CFDs work and whether you can afford to take the high risk of losing your money.
Digital Assets are unregulated in most countries and consumer protection rules may not apply. As highly volatile speculative investments, Digital Assets are not suitable for investors without a high-risk tolerance. Make sure you understand each Digital Asset before you trade.
Cryptocurrencies are not considered legal tender in some jurisdictions and are subject to regulatory uncertainties.
The use of Internet-based systems can involve high risks, including, but not limited to, fraud, cyber-attacks, network and communication failures, as well as identity theft and phishing attacks related to crypto-assets.
Education 
Long 
France/Germany yield spread on red alertAs France’s 10-year government bond yield has reached the same level as Italy’s 10-year government bond yield, the question of the trajectory of French public debt is becoming increasingly important. This issue is all the more significant because France is the second-largest economy in the Eurozone and a major global power.
Among the worrying factors at present are a budget deficit that remains well above the European 3% target, an interest burden that accounts for more than 13% of the government’s total budget, and a dominant share of public debt held by foreign investors.
Another warning indicator: the spread between French and German 10-year government bond yields is now at its highest level since 2012!
The chart below shows the long-term yield spread between France and Germany.
Let us examine the current situation of French public debt, the negative factors, but also the positive elements that could eventually allow for a structural improvement in the situation.
The first point to remember is the sheer size of the debt. At the end of the first quarter of 2026, French public debt reached €3.536 trillion, equivalent to 117.5% of GDP. This trend is concerning because the ratio stood at 98% at the end of 2015. France therefore needs to stabilize its public finances at the same time as the cost of its debt is increasing.
The debt interest burden is precisely one of the main risks. It is expected to reach €59.3 billion in 2026, an amount now higher than the budget allocated to national defense. More importantly, this burden is expected to continue rising over the coming years if interest rates remain high.
The table below presents the main characteristics of French public debt, including the weight of debt servicing in the government’s total budget and the share of public debt held by foreign investors.
The second risk is investor confidence. Around 55.9% of long-term debt securities issued by French public administrations are held by non-residents. This means that any deterioration in the perception of French sovereign risk can quickly translate into higher required yields and therefore a wider spread versus Germany.
However, not everything is negative. France still has a diversified economy, a large tax base, a relatively long average debt maturity, and benefits from membership in the Eurozone. Above all, a lasting reduction in the budget deficit, combined with stronger economic growth, could gradually reverse the trajectory of public debt.
The France/Germany spread should therefore be monitored as a genuine barometer of investor confidence. Stabilization would be a first positive signal. Conversely, a continued widening of the spread would indicate that investors are demanding an increasingly higher risk premium to finance France. At the beginning of September, the spread is trading around 90 basis points, levels close to those observed during previous periods of severe stress in French government debt.
DISCLAIMER:
This content is intended for individuals who are familiar with financial markets and instruments and is for information purposes only. The presented idea (including market commentary, market data and observations) is not a work product of any research department of Swissquote or its affiliates. This material is intended to highlight market action and does not constitute investment, legal or tax advice. If you are a retail investor or lack experience in trading complex financial products, it is advisable to seek professional advice from licensed advisor before making any financial decisions.
This content is not intended to manipulate the market or encourage any specific financial behavior.
Swissquote makes no representation or warranty as to the quality, completeness, accuracy, comprehensiveness or non-infringement of such content. The views expressed are those of the consultant and are provided for educational purposes only. Any information provided relating to a product or market should not be construed as recommending an investment strategy or transaction. Past performance is not a guarantee of future results.
Swissquote and its employees and representatives shall in no event be held liable for any damages or losses arising directly or indirectly from decisions made on the basis of this content.
The use of any third-party brands or trademarks is for information only and does not imply endorsement by Swissquote, or that the trademark owner has authorised Swissquote to promote its products or services.
Swissquote is the marketing brand for the activities of Swissquote Bank Ltd (Switzerland) regulated by FINMA, Swissquote Capital Markets Limited regulated by CySEC (Cyprus), Swissquote Bank Europe SA (Luxembourg) regulated by the CSSF, Swissquote Ltd (UK) regulated by the FCA, Swissquote Financial Services (Malta) Ltd regulated by the Malta Financial Services Authority, Swissquote MEA Ltd. (UAE) regulated by the Dubai Financial Services Authority, Swissquote Pte Ltd (Singapore) regulated by the Monetary Authority of Singapore, Swissquote Asia Limited (Hong Kong) licensed by the Hong Kong Securities and Futures Commission (SFC) and Swissquote South Africa (Pty) Ltd supervised by the FSCA.
Products and services of Swissquote are only intended for those permitted to receive them under local law.
All investments carry a degree of risk. The risk of loss in trading or holding financial instruments can be substantial. The value of financial instruments, including but not limited to stocks, bonds, cryptocurrencies, and other assets, can fluctuate both upwards and downwards. There is a significant risk of financial loss when buying, selling, holding, staking, or investing in these instruments. SQBE makes no recommendations regarding any specific investment, transaction, or the use of any particular investment strategy.
CFDs are complex instruments and come with a high risk of losing money rapidly due to leverage. The vast majority of retail client accounts suffer capital losses when trading in CFDs. You should consider whether you understand how CFDs work and whether you can afford to take the high risk of losing your money.
Digital Assets are unregulated in most countries and consumer protection rules may not apply. As highly volatile speculative investments, Digital Assets are not suitable for investors without a high-risk tolerance. Make sure you understand each Digital Asset before you trade.
Cryptocurrencies are not considered legal tender in some jurisdictions and are subject to regulatory uncertainties.
The use of Internet-based systems can involve high risks, including, but not limited to, fraud, cyber-attacks, network and communication failures, as well as identity theft and phishing attacks related to crypto-assets.
Japanese Long-Term Rates: Is It Really Dangerous?The marked upward trend in Western bond yields since 2022 has become a major fundamental concern for markets. Oil prices, inflation, budget deficits and public debt are all factors pushing long-term yields higher, particularly in Europe, the United States and Japan.
For the Japanese economy, the situation could become complicated because public debt represents more than 240% of GDP, while interest payments are taking up an increasingly large share of the government’s annual budget.
The chart below shows Japan’s public debt as a percentage of GDP. This data is available on TradingView under the ticker JPGDG.
It should be remembered that the fiscal situation is also very challenging in the United States, where interest payments on existing public debt now represent 18% of federal government revenues.
But let us return to Japan, where the 10-year government bond yield has just reached the 3% threshold, its highest level since 1996!
The chart below shows the daily Japanese candlesticks of the Japanese 10-year government bond yield. It has been following a powerful upward trend since 2022 and has just reached 3%, its highest level since 1996.
Is this rise in Japanese long-term yields dangerous for the global economy, and above all, what factors would be necessary to definitively break this upward trend? A resumption of Japanese government bond purchases by the BoJ? A collapse in oil prices? A more accommodative Fed?
The first element to consider is the particular structure of Japanese debt. Unlike the United States, a very large share of this debt is held by domestic investors, notably the Bank of Japan, banks and insurance companies. This limits the risk of a sudden flight of foreign capital and makes Japan less dependent on external financing.
But this does not mean that rising yields have no consequences. The issue is rather the gradual refinancing cost of the debt. A large proportion of existing bonds were issued when interest rates were extremely low. As they mature and are refinanced, they will be replaced by bonds offering higher yields, mechanically increasing the government’s interest burden.
This is therefore more of a medium-term threat than an immediate risk of a solvency crisis.
The second determining factor remains BoJ policy. After years of yield curve control and massive bond purchases, the Bank of Japan is now seeking to gradually normalize its monetary policy. An overly rapid acceleration in this normalization process could trigger another surge in long-term yields.
Conversely, a more accommodative BoJ, with a slower pace of reduction in its bond purchases, could help stabilize the market.
The chart below shows Japanese bond yields, the BoJ’s balance sheet and the BoJ’s policy rate.
The third factor to monitor is the price of oil. A sustained decline in oil prices would reduce inflationary pressures in Japan and give the BoJ greater room for maneuver. A geopolitical easing that allows the Strait of Hormuz to fully reopen could therefore indirectly help calm Japanese yields through a reduction in the energy and inflation premium.
Finally, the trajectory of US yields remains essential. If the Fed becomes significantly more accommodative and US yields begin to decline, the pressure exerted on global bond markets could also ease.
The rise in Japanese yields therefore needs to be monitored, but it is still too early to speak of a crisis. The real danger would emerge if rising yields became self-reinforcing: higher interest costs, larger deficits, more bond issuance and therefore even greater upward pressure on yields.
To sustainably break this dynamic, the ideal scenario would be a combination of several factors: Japanese inflation normalizing, lower oil prices, a BoJ stabilizing its bond market and a more accommodative Fed. It is this combination, rather than a single isolated event, that could genuinely allow Japanese long-term yields to return to a more stable trajectory.
The data below shows that the market is anticipating a BoJ rate hike on September 18.
DISCLAIMER:
This content is intended for individuals who are familiar with financial markets and instruments and is for information purposes only. The presented idea (including market commentary, market data and observations) is not a work product of any research department of Swissquote or its affiliates. This material is intended to highlight market action and does not constitute investment, legal or tax advice. If you are a retail investor or lack experience in trading complex financial products, it is advisable to seek professional advice from licensed advisor before making any financial decisions.
This content is not intended to manipulate the market or encourage any specific financial behavior.
Swissquote makes no representation or warranty as to the quality, completeness, accuracy, comprehensiveness or non-infringement of such content. The views expressed are those of the consultant and are provided for educational purposes only. Any information provided relating to a product or market should not be construed as recommending an investment strategy or transaction. Past performance is not a guarantee of future results.
Swissquote and its employees and representatives shall in no event be held liable for any damages or losses arising directly or indirectly from decisions made on the basis of this content.
The use of any third-party brands or trademarks is for information only and does not imply endorsement by Swissquote, or that the trademark owner has authorised Swissquote to promote its products or services.
Swissquote is the marketing brand for the activities of Swissquote Bank Ltd (Switzerland) regulated by FINMA, Swissquote Capital Markets Limited regulated by CySEC (Cyprus), Swissquote Bank Europe SA (Luxembourg) regulated by the CSSF, Swissquote Ltd (UK) regulated by the FCA, Swissquote Financial Services (Malta) Ltd regulated by the Malta Financial Services Authority, Swissquote MEA Ltd. (UAE) regulated by the Dubai Financial Services Authority, Swissquote Pte Ltd (Singapore) regulated by the Monetary Authority of Singapore, Swissquote Asia Limited (Hong Kong) licensed by the Hong Kong Securities and Futures Commission (SFC) and Swissquote South Africa (Pty) Ltd supervised by the FSCA.
Products and services of Swissquote are only intended for those permitted to receive them under local law.
All investments carry a degree of risk. The risk of loss in trading or holding financial instruments can be substantial. The value of financial instruments, including but not limited to stocks, bonds, cryptocurrencies, and other assets, can fluctuate both upwards and downwards. There is a significant risk of financial loss when buying, selling, holding, staking, or investing in these instruments. SQBE makes no recommendations regarding any specific investment, transaction, or the use of any particular investment strategy.
CFDs are complex instruments and come with a high risk of losing money rapidly due to leverage. The vast majority of retail client accounts suffer capital losses when trading in CFDs. You should consider whether you understand how CFDs work and whether you can afford to take the high risk of losing your money.
Digital Assets are unregulated in most countries and consumer protection rules may not apply. As highly volatile speculative investments, Digital Assets are not suitable for investors without a high-risk tolerance. Make sure you understand each Digital Asset before you trade.
Cryptocurrencies are not considered legal tender in some jurisdictions and are subject to regulatory uncertainties.
The use of Internet-based systems can involve high risks, including, but not limited to, fraud, cyber-attacks, network and communication failures, as well as identity theft and phishing attacks related to crypto-assets.
US 30-Year Yield: Critical Juncture Ahead of Inflation DatLast week's push to new highs (~5.30%) has brought us right up against a major confluence zone: the 61.8% retracement of the 1995–2020 decline at 5.34%, sitting almost on top of the 2007 high at 5.40%.
Weekly/daily RSI is showing divergence here, pointing to fading upside momentum — so we're allowing for some consolidation or a pullback near-term.
The bigger picture stays constructive: the weekly Ichimoku cloud has supported this market since 2020 (Chikou span above price, price above the cloud). That structural bull trend only comes into question on a weekly close back below the cloud, currently around 4.75%.
A weekly close above 5.40% opens the door toward 6%.
Educational purposes only, not trading advice — always do your own research.
Disclaimer:
The information posted on Trading View is for informative purposes and is not intended to constitute advice in any form, including but not limited to investment, accounting, tax, legal or regulatory advice. The information therefore has no regard to the specific investment objectives, financial situation or particular needs of any specific recipient. Opinions expressed are our current opinions as of the date appearing on Trading View only. All illustrations, forecasts or hypothetical data are for illustrative purposes only. The Society of Technical Analysts Ltd does not make representation that the information provided is appropriate for use in all jurisdictions or by all Investors or other potential Investors. Parties are therefore responsible for compliance with applicable local laws and regulations. The Society of Technical Analysts will not be held liable for any loss or damage resulting directly or indirectly from the use of any information on this site.

BOND YIELDS ↑ DOES GOLD HAVE TO FALL?XAUUSD: Rising Bond Yields Do Not Necessarily Mean Gold Will Fall
Traders are often familiar with a simple formula:
Rising bond yields → Gold falls.
Falling bond yields → Gold rises.
Because bonds pay interest, while gold does not.
But the market is not always that simple.
What Are Yields?
Let’s use a simple example.
You buy a house for approximately $670,000 and rent it out for approximately $1,025 per month.
In one year, the income you receive is:
$1,025 × 12 months = $12,300 per year
The formula is:
Yield = Annual income ÷ Asset value
Therefore:
$12,300 ÷ $670,000 ≈ 1.84% per year
Simply put:
You invest approximately $670,000 and earn approximately $12,300 per year → the yield is approximately 1.84%.
What Happens If the House Price Changes?
Assume the rental income remains approximately $12,300 per year.
But the house price falls from approximately $670,000 to $395,000.
Now:
$12,300 ÷ $395,000 ≈ 3.12%
The house price falls → The yield rises.
Conversely, if the house price increases:
The asset price rises → The yield falls.
Bonds work in a similar way:
Bond prices fall → Yields rise.
Bond prices rise → Yields fall.
But This Is What Matters for Gold Traders:
Don’t Just Ask:
Are yields rising or falling?
Ask:
WHY ARE YIELDS CHANGING?
Case 1: Yields Rise Because the Economy Is Strong
For example:
The U.S. economy is performing well.
The labor market is strong.
Inflation is high.
The market believes the Fed will keep interest rates higher for longer.
In that case:
Bond yields rise.
Gold may come under pressure.
This is the scenario traders commonly encounter.
But There Is Another Scenario:
Yields are still rising.
But not because the economy is strong.
Instead, the market is becoming increasingly concerned about:
Inflation.
Government debt.
Budget deficits.
The government needing to borrow too much money.
Investors may start thinking:
“If you want me to lend you money for 10 or 30 years, the current yield is not attractive enough.”
They demand higher yields.
And:
Bond prices fall → Yields rise.
Yields are still rising.
But the story behind the move is completely different.
And That Is When Gold Does Not Necessarily Have to Fall.
Because this time, rising yields may be accompanied by:
MARKET ANXIETY.
If investors become increasingly concerned about:
Government debt.
Budget deficits.
Inflation.
Financial risks.
Then gold may still attract buying interest.
Conversely, Falling Yields Do Not Necessarily Mean Gold Will Rise Solely Because of Interest Rates.
We must also ask:
WHY ARE YIELDS FALLING?
If yields fall because the market expects the Fed to cut interest rates:
→ This may support gold.
But if yields fall because money is flowing into bonds as a safe haven amid market fears:
→ Gold may rise as well.
CONCLUSION
Rising bond yields do not necessarily mean gold will definitely fall.
Falling bond yields do not necessarily mean gold will definitely rise.
The same change in yields...
But the underlying reasons can be completely different.
As a trader, don’t just look at the number.
Look at why the number is changing.
And the most important question is always:
WHY?
What is the market expecting?
Or:
What is the market worried about? US10Y Rising Yields on a new massive Bull CycleAt the start of this year (January 02, see chart below) we gave a bullish call on the U.S. Government Bonds 10YR Yield (US10Y), expecting a rebound on its 1M MA50 (blue trend-line) and break-out above the 3-year Triangle:
That break-out happened in April and technically this is the start of a new Bullish Leg towards the 10-year Higher Highs trend-line.
After all, the market has entered a new massive Bull Cycle following the April 2022 bullish break-out above both the 1M MA200 (orange trend-line) and the Lower Highs trend-line, holding as Resistance since 1987!
Expect bond yields to keep rising, perhaps even more aggressively than now. Risky assets, like stocks won't be unaffected.
---
** Please LIKE 👍, FOLLOW ✅, SHARE 🙌 and COMMENT ✍ if you enjoy this idea! Also share your ideas and charts in the comments section below! This is best way to keep it relevant, support us, keep the content here free and allow the idea to reach as many people as possible. **
---
💸💸💸💸💸💸
👇 👇 👇 👇 👇 👇 Long 
The Bond Market Is Sending a Warning🚨 A Major Structural Shift Is Happening in the Bond Market
Is the era of cheap money and ultra-low yields really over?
Financial markets have experienced no shortage of major events in recent years.
From the pandemic and the historic inflation shock to aggressive central bank tightening, geopolitical conflicts, and the explosive rise of artificial intelligence, investors have had plenty to focus on.
But one of the most important developments may currently be unfolding in a place that many market participants are not watching closely enough:
The bond market.
While attention remains focused on geopolitical tensions, equities, AI, and central bank policy, the bond market may be sending a much bigger message to the entire financial system.
And that message is simple:
We may be entering a new era of higher interest rates and higher bond yields for longer.
If this is truly a structural shift rather than a temporary market move, the consequences could extend far beyond fixed income—affecting equities, currencies, gold, commodities, real estate, and the valuation of high-growth companies.
📉 The End of an Era?
For more than a decade, global markets became accustomed to a very different economic environment.
An environment characterized by:
• Extremely low interest rates
• Low and relatively stable inflation
• Abundant liquidity
• Aggressive monetary stimulus
• Massive central bank bond purchases
This was the era of cheap money.
Following the 2008 financial crisis—and later the COVID-19 pandemic—central banks injected enormous amounts of liquidity into the global economy and pushed interest rates toward historically low levels.
But several years later, the consequences of that environment, combined with new economic and geopolitical realities, are becoming increasingly visible.
The new global backdrop includes:
🔴 More persistent inflation
🔴 Rapidly rising government debt
🔴 Large fiscal deficits
🔴 Higher military and geopolitical spending
🔴 Demographic pressures and rising social costs
🔴 Growing government borrowing requirements
And this combination could be driving a fundamental transformation in the global bond market.
🌍 Rising Yields Are Becoming a Global Story
One of the most important aspects of the recent move is that rising bond yields are not limited to a single country.
Major government bond markets around the world have come under pressure simultaneously.
Recent market levels highlighted in this discussion include:
🇺🇸 U.S. 10-Year Yield: approximately 4.80%
🇩🇪 German 10-Year Yield: approximately 3.37%
🇫🇷 French 10-Year Yield: approximately 4.24%
🇬🇧 UK 10-Year Yield: approximately 5.26%
🇯🇵 Japanese 10-Year Yield: approximately 3.02%
This is an important development.
When yields rise sharply in one country, the explanation may be domestic.
But when government bond markets across several major economies experience rising yields at the same time, investors should consider whether something larger is happening.
This may not be a country-specific story. It may be a global structural shift.
⚠️ So What Is Actually Driving Bond Yields Higher?
One of the most important answers can be summarized in one phrase:
Fiscal deficits.
Many of the world's largest economies are spending significantly more than they generate in revenue.
That gap has to be financed.
And in most cases, the answer is:
More borrowing and more government bond issuance.
When governments need to finance larger deficits, they issue more debt.
That increases the supply of bonds.
The basic relationship is straightforward:
More Bond Supply ⬆️
Bond Prices ⬇️
Bond Yields ⬆️
But increasing supply is only part of the story.
The more important issue may be growing investor concern about the long-term financial outlook of governments.
💣 Term Premium: The Part of the Story Markets Cannot Ignore
An investor buying a long-term government bond is not simply making a decision about today's interest rates.
They are making a judgment about the future.
The future of inflation.
The future of government debt.
The future of fiscal deficits.
The future of policymaking.
And increasingly, the future of geopolitical stability.
Because of these uncertainties, investors may demand additional compensation for holding long-term bonds.
This additional compensation is often described as the:
Term Premium
If investors believe that the risks associated with holding a 10-year or 30-year government bond are increasing, they can demand higher yields—even if the central bank does not raise interest rates.
This is a crucial point.
Central banks can cut short-term interest rates, while long-term bond yields remain elevated.
Why?
Because the market itself may demand a higher return for financing governments over the long term.
🏛️ When the Bond Market Pushes Back Against Fiscal Policy
This brings us to another important concept:
Bond Vigilantes
The term refers to a situation where bond investors effectively push back against government fiscal policy by selling government bonds or demanding higher yields.
If investors begin to believe that:
• Government debt is rising too quickly
• Fiscal deficits are becoming unsustainable
• Policymakers lack a credible plan to control spending
• Inflation risks are increasing again
They may require significantly higher yields to continue financing government borrowing.
This can create a difficult feedback loop:
Larger Fiscal Deficits
⬇️
More Bond Issuance
⬇️
Higher Bond Yields
⬇️
Higher Interest Costs
⬇️
Even Larger Fiscal Deficits
This is one of the most important long-term risks that global markets may need to monitor.
🌍 Geopolitical Risk: A Potential Inflation Accelerator
Now add another major factor to the equation:
Geopolitical uncertainty.
Prolonged geopolitical conflicts can have direct consequences for global energy and commodity markets.
They can lead to:
🛢️ Higher energy prices
📈 Rising commodity costs
🚢 Supply chain disruptions
🔥 Increased inflationary pressure
📊 Higher inflation expectations
And this creates an additional challenge for central banks.
If inflation begins to rise again because of energy and commodity shocks, the ability of central banks to aggressively cut interest rates could become limited.
This could leave the global economy facing a particularly difficult combination:
Slower economic growth + persistent inflation + higher borrowing costs
That is not an ideal environment for financial markets.
🔥 Why Does This Matter for Stocks?
Bond yields are among the most important variables in the valuation of financial assets.
When risk-free yields rise, the present value of future cash flows declines.
This is particularly important for assets whose valuations depend heavily on earnings expected far into the future.
That means higher bond yields can place additional pressure on:
• Growth stocks
• Technology companies
• Highly valued equities
• Real estate
• Highly leveraged companies
In other words:
The bond market can tighten financial conditions even without another central bank rate hike.
And that could become one of the biggest challenges for equity markets.
🟡 What Could This Mean for Gold and Commodities?
An environment characterized by:
• Rising government debt
• Persistent fiscal deficits
• Geopolitical uncertainty
• Inflationary pressure
could increase investor interest in assets traditionally viewed as hedges against financial and geopolitical risk.
However, there is an important complication.
Higher real yields can create short-term pressure on gold.
That means gold could find itself caught between two powerful forces:
🔺 Inflation, fiscal risks, and geopolitical uncertainty
versus
🔻 Higher real yields and tighter financial conditions
This could create significant volatility across precious metals and commodity markets.
⚡ The Bigger Question: Are We Entering a “Higher for Longer” Era?
The most important question is not whether bond yields can rise for a few days or weeks.
The real question is:
Has the structure of the global bond market fundamentally changed?
If the answer is yes, the global economy may not easily return to the conditions that defined the previous decade.
That could mean:
❌ Ultra-low yields may no longer be the normal environment.
❌ Cheap money may no longer be easily available.
❌ Governments may face permanently higher borrowing costs.
❌ Extremely high asset valuations could face increasing pressure.
At the same time:
✅ Higher yields could become a more permanent feature of the global economy.
✅ Investors may demand greater compensation for long-term risks.
✅ The bond market could play an increasingly important role in determining the direction of other asset classes.
🎯 The Bottom Line
What is happening in the bond market today may be far more important than a temporary move in yields.
The simultaneous rise in government bond yields across major economies—at a time of rising debt, persistent fiscal deficits, and growing geopolitical uncertainty—could be signaling the beginning of a new financial regime.
A regime defined by:
Higher Rates for Longer
But the most important point may be this:
This time, the story may not be entirely about central banks.
The bond market itself may be demanding higher compensation for financing increasingly indebted governments.
And if that trend continues, its consequences could spread across the entire financial system—from Wall Street to currencies, gold, equities, commodities, and the broader global economy.
📌 In the coming weeks and months, one of the most important charts for every trader and investor may not be a stock index or Bitcoin.
It may be the chart of government bond yields. Education 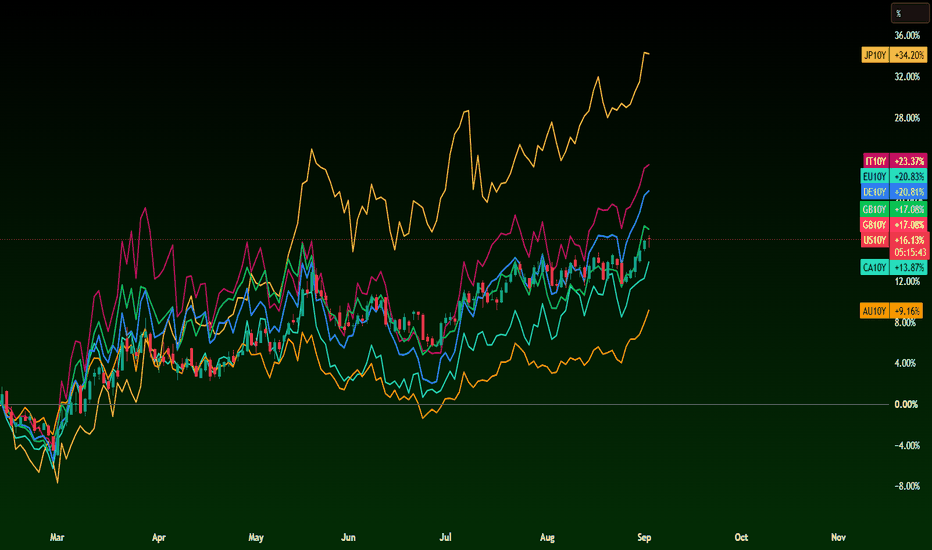
US 10 Yr Yield: The Final Squiggle and the TINA Tug of WarTake a look at the battle playing out between the 4 hour and the Daily charts on the 10 Yr Treasury.
Daily, the chart saw a sudden blast of buying energy pushing yields right up against 4.80 percent. But when you zoom in to the 4Hr timeframe, the picture tells a different story.
Right now, the 4 hour chart is painting a bearish engulfing candle after tapping that 4.80 percent mark. Yields could pull back to test support or an EMA (one of the colored moving avgs), one last quick pop to trap late breakout buyers, and then roll over into the September and October window.
Daily momentum is exhausted, printing lower momentum peaks on both RSI and TTM while yields struggle to make a clean, sustained breakout through this multi month ceiling.
The Squiggle Roadmap: One Last Fakeout Pop?
Markets love to sweep liquidity and trap late traders before making their real move.
That timing lines up with the macro schedule. The Treasury ramps up its expanded debt buyback operations to absorb long bond supply, putting a natural lid on how far yields can climb heading into the Fed meeting.
Where Does TINA Fit In?
For years, the market lived by the TINA rule: There Is No Alternative to equities.
Some say TINA is gone because risk free paper yields near 5 percent. But is it really dead? If true inflation is running hotter than stated figures, a 5 percent bond still locks in negative real purchasing power. Under that view, money is eventually forced back into companies with real pricing power and hard cash flows because bonds cannot outrun true cost of living increases.
In the short term, however, nearly 5 percent on cash creates a real headwind for stock multiples because big funds can park capital safely while waiting out volatility.
The Bottom Line
TINA is not dead, but it is facing a major short term test. We are watching for that final squiggle on yields to exhaust itself against heavy overhead resistance. Once the daily chart confirms a real rejection, the stage is set for a rate pullback into autumn. The Bond Market Is Pricing More Than a Fed Hike
Market: TVC:US10Y U.S. 10-Year Treasury Yield
Current condition: Bullish yield breakout above 4.744%, testing the 4.78–4.80% resistance zone
The U.S. 10-year Treasury yield is back near 4.78%, breaking above a resistance area that had repeatedly stopped the market around 4.74–4.75%.
The obvious explanation is simple: the Federal Reserve has turned more hawkish.
But that is only part of the story.
If this were purely a Fed-hike trade, we would expect most of the pressure to sit at the front end of the curve. Instead, longer-dated yields are also pushing aggressively higher, the curve is steepening, oil is back above $90, global bond markets are selling off together, and investors are asking for more compensation to own duration.
That changes the interpretation completely.
The market is no longer asking only:
“Will the Fed hike again?”
It is increasingly asking:
“What yield do I need to own a 10-year bond in a world of sticky inflation, heavy government borrowing and higher global rates?”
That is a much bigger question.
First, What Are We Actually Looking at?
The 10-year Treasury yield is often described as the market’s view of future interest rates. That is useful, but incomplete.
Conceptually, a long-term yield can be broken into two broad components:
Expected short-term rates + term premium
The first part reflects where investors think Fed policy and short-term rates will average over time.
The second is the extra compensation investors demand for taking long-duration risk, inflation uncertainty, changing real rates, fiscal policy, bond supply and the possibility that the world looks very different several years from now.
This distinction is the key to understanding the current breakout.
Chair Kevin Warsh changed expectations for the policy path.
Oil and fiscal concerns are changing the price investors demand for duration.
Both are pushing yields higher, but through different channels.
Warsh Lit the Match
The latest repricing began with a clear message from the Fed.
Warsh argued that inflation remains too high, the labor market is still compatible with full employment, consumer and investment demand remain healthy, and financial conditions are difficult to describe as genuinely restrictive.
He highlighted PCE inflation running at 3.7% over twelve months and roughly 4.1% over six months, while unemployment remained around 4.1%.
For the bond market, the implication was straightforward:
The Fed may not be finished.
That immediately pushed traders toward a much higher probability of another rate increase in September.
And importantly, the first large reaction appeared in the short end.
That makes sense.
The 2-year Treasury is tightly linked to expectations for the next several Fed meetings. Change the expected policy path, and the 2-year usually reacts first.
Last week was largely a Fed repricing story.
Today is becoming something broader.
Then Oil Changed the Question
Brent crude moving back above $90 matters for bonds because energy shocks do more than lift next month’s inflation print.
They alter the distribution of future inflation.
If an oil shock is brief, the Fed can potentially look through part of it. But if higher energy prices feed transportation costs, manufacturing inputs, services prices and household expectations, investors have to consider a more persistent inflation regime.
For a 2-year note, the question is mainly:
Does this force another Fed hike?
For a 10-year bond, the question is wider:
Does this mean inflation, nominal growth and policy uncertainty remain higher for longer?
That second question feeds directly into the term premium.
This is why a sustained energy shock can push the long end higher even without an endless series of Fed hikes.
The 10-year is not simply pricing the next FOMC meeting. It is pricing the uncertainty around the next decade.
The Curve Is Telling Us Where the Pressure Comes From
This is where the yield curve becomes much more useful than the headline 10-year yield.
The 2-year is trading around 4.36%.
The 10-year is near 4.78%.
The 30-year is around 5.27%.
So the 2s10s spread is roughly +42 basis points, while the 30-year trades almost another 50 basis points above the 10-year.
The curve is positively sloped - and the long end remains under significant pressure.
Why does that matter?
A pure hawkish-Fed shock often pushes short rates up faster than long rates. That tends to flatten the curve.
But when long yields rise aggressively as well, investors are telling us that the problem extends beyond the next policy decision.
That is usually where inflation uncertainty, stronger nominal growth, fiscal supply and term premium enter the story.
This makes today’s market much more interesting than a simple “Fed hawkish, yields up” headline.
And It Is Not Just America
There is another clue: the selloff is global.
Japanese 10-year yields have reached levels not seen in decades. German and other European sovereign yields are also moving higher.
That matters because global bond markets compete for capital.
When foreign sovereign bonds suddenly offer meaningfully higher yields, Treasuries become less exceptional. Global investors do not have to accept yesterday’s U.S. yield when comparable alternatives now offer better returns.
So U.S. yields must adjust.
In other words, part of today’s move is not about the Fed at all.
It is about the global price of duration moving higher.
That is an important distinction for the dollar as well. Rising U.S. yields normally support USD when the move increases America’s relative rate advantage. But when Japanese and European yields are climbing at the same time, that relative advantage becomes less powerful.
Higher Treasury yields do not automatically mean a proportionally stronger dollar.
Then Comes the Supply Problem
There is another force sitting quietly behind the move: Treasury issuance.
The U.S. government expects to borrow roughly $739 billion in privately held net marketable debt during the July–September quarter, above its previous estimate.
The simple version is “more supply pushes yields higher.”
The more useful version is this:
Every new Treasury security must find a buyer.
If the amount of duration being issued rises faster than investors' willingness to absorb it at current prices, bonds have to become cheaper.
Cheaper bond prices mean higher yields.
The adjustment continues until the market clears.
This is one reason fiscal policy affects the long end differently from the front end. The Fed largely controls the overnight policy rate. It does not directly determine the yield investors require to absorb enormous amounts of 10-, 20- and 30-year government debt.
That price is discovered in the market.
And when supply is high while inflation uncertainty is rising, investors tend to demand a larger term premium.
Why the Driver of the Yield Matters
Two markets can both show a 4.78% 10-year yield and still send completely different signals.
Suppose yields rise because economic growth expectations improve.
That can be reasonably constructive for cyclicals and risk assets.
Now suppose the same yield rises because investors demand more compensation for inflation uncertainty and government borrowing.
That is much less comfortable.
And if the increase comes mainly through real yields, the consequences can be especially powerful.
Higher real yields raise the discount rate applied to future cash flows. That puts pressure on assets whose valuation depends heavily on earnings far into the future - particularly high-duration technology and growth shares.
It can also challenge gold because the opportunity cost of holding a non-yielding asset rises.
This is why traders should never stop at:
“The 10-year is rising.”
The better question is:
“Which component is rising - expected policy rates, inflation expectations, real yields, or term premium?”
That is where cross-asset analysis begins.
The Chart Says the Market Has Accepted Higher Yields
Now the macro story becomes visible in price.
For weeks, the 10-year yield repeatedly struggled near 4.744%.
That area was genuine resistance because the market tested it several times and failed.
Now it has broken.
This is important from a CMT perspective because resistance represents a zone where supply was previously strong enough to stop the advance. Once the market pushes through and holds above it, the balance of pressure has changed.
The old ceiling becomes the first potential floor. So 4.744% is no longer just a former swing high. It is now the first structural support under the breakout. That is the polarity principle in action.
4.78–4.80% Is the First Real Test
The yield is now trading almost exactly around the 127.2% Fibonacci expansion at 4.778%.
At the same time, the upper Bollinger Band sits near 4.80%. That creates an immediate technical resistance zone around:
4.78–4.80%
This is where the current move becomes interesting. A clean push above the zone would suggest that the market is accepting a new, higher yield regime rather than simply overshooting the previous resistance.
If that happens, the next Fibonacci projections sit near:
4.821% - 161.8% expansion
and then:
4.869% - 200% expansion
These are not guaranteed targets. They are potential reaction zones where the balance between fresh bond selling and duration demand should be reassessed.
Momentum Is Supporting the Breakout
The Percentage Price Oscillator is giving the breakout technical credibility.
The PPO line is above its signal line, both are above zero, and the histogram is expanding positively. That combination tells us more than a simple bullish crossover.
Momentum is strengthening in an already positive regime.
The Bollinger Band Width is also expanding rapidly after a period of compression.
This is exactly the behaviour technicians normally want to see after a resistance breakout:
structure breaks first, then momentum accelerates, then volatility expands.
That sequence is currently intact.
There is one important trap to avoid, however.
The yield is sitting near the upper Bollinger Band.
That does not automatically mean it is “overbought” and ready to reverse.
Strong trends often ride the outer band. The warning comes when the market stops making progress while momentum deteriorates and volatility expansion fades.
We do not have that combination yet.
The Support Map Matters More Than Chasing the High
The first support is now 4.744%, the broken swing high.
A shallow retest of that area would not damage the bullish structure. In fact, a successful retest could strengthen it by showing that former resistance has turned into support.
Below that sits a much more interesting confluence zone around 4.68–4.70%.
Why?
Because the 61.8% Fibonacci level near 4.696% sits close to the rising 200-period WMA around 4.68%.
That gives the area two independent technical references: Fibonacci structure and dynamic trend support.
Below both sits the August swing low around 4.619%. That is the level where the bullish yield structure would become much harder to defend.
So the hierarchy is straightforward:
Above 4.744%: breakout remains intact.
Below 4.744%: momentum cools, but trend structure can survive.
Below 4.68–4.70%: the breakout loses significant quality.
Below 4.619%: the broader bullish yield structure is damaged.
Four Regimes Traders Should Understand
The cleanest outcome for higher yields would be strong growth, firm labor demand and persistent price pressure. That combination would validate both a higher Fed path and a higher nominal-growth regime. In that environment, 4.821% and potentially 4.869% become realistic technical tests.
A more difficult outcome would be weak growth but stubbornly high prices. That is a stagflationary mix, and it can be surprisingly hostile to long-duration bonds because the Fed has less freedom to ease while inflation uncertainty remains elevated.
The cleanest bullish case for Treasury prices would be weaker labor demand combined with cooling manufacturing prices. That could pull the 10-year back below 4.744% and expose the 4.68–4.70% confluence zone.
But there is a fourth regime that deserves more attention: weak labor data alongside persistent oil pressure and rising global yields.
In that case, the front end may rally while the long end refuses to follow. That would tell us the problem has moved away from the Fed and deeper into term premium. And that may be the most important signal of all.
What the Bond Market Is Really Saying
The 10-year Treasury is not simply forecasting the next Fed decision. It is clearing the market for long-term money.
Expected Fed policy matters.
Inflation matters.
Real growth matters.
Oil matters.
Treasury supply matters.
Foreign bond yields matter.
The term premium ties all of them together.
Last week, Warsh pushed the market toward a higher expected policy path.
Now oil, global yields and fiscal supply are pushing investors to demand more compensation for holding duration.
The technical breakout above 4.744% tells us those forces have become strong enough to change the market structure.
The next battlefield is 4.78–4.80%.
Acceptance above it opens 4.821%, followed by 4.869%.
Failure there would shift attention back toward the 4.744% breakout level.
But the bigger lesson is not whether the 10-year eventually prints 4.8%, 4.9% or 5%.
It is learning to identify why it is moving.
If short and long yields rise together because the market expects stronger growth and tighter Fed policy, that is one regime.
If the long end keeps rising while the front end stabilizes or falls, that is another and potentially more important regime.
The curve tells us the source of the pressure.
The chart tells us when the market accepts it.
And the fundamentals explain why investors are demanding a different price for duration.
That is how the bond market should be read: not as one yield, but as a system.
Education