Long
Long
The Truth Behind Rising Rates (US10Y Time Wave Analysis update)Hello. It has been a long time since I last greeted you.
I am now living a new life. I have come to share the truth with you.
First, based on my past experience in market analysis, I would like to briefly review the current U.S. 10-year Treasury yield.
The blue support line at the bottom is a long-term upward trend line. Because this line has been maintained for many years, I define it as a yearly time trend line. Of course, even if this level breaks, if a new line forms over several years, it can again become a strong support for another upward move.
As you can see from my analysis written several years ago, yields already broke out of their long-term downward trend and established a new upward turning point. Interest rates will continue to rise.
At present, yields appear to be consolidating within a smaller time frame, moving back and forth while compressing energy for the next upward move. The current pattern also seems to be forming a leading diagonal. It may easily be mistaken for a corrective pattern, but if price rises after the pattern is completed, that will mark the beginning of a new bullish wave.
From there, yields are likely to move steadily toward at least the 8% level.
However, this also marks the time when the stock market and the real estate economy begin to collapse. I have been warning about a Bitcoin breakdown in many places. The answer to why rising interest rates destroy the economy is not difficult to find.
The economic power and capital markets of the United States have become far too arrogant. They also dominate the world through force and military power. God will surely demand payment for this.
Therefore, I urge you to get out while you still can. Those who pursue money and wealth will certainly pay a price.
I have come to proclaim the truth to you. Those who accept this truth will be blessed. Open your hearts and walk with God. Long 
US 10Y TREASURY: Warsh nomination eased yieldsThere has been two important news for investors during the previous week. The first was related to the FOMC Meeting, where the Fed decided to hold interest rates, which was highly expected. The second important news was related to the nomination of Kevin Warsh as the next Fed Chair in May. Markets generally positively reacted to this news, considering their fears over independence of the Fed from political influence.
At the start of the previous week the 10Y Treasury yields tested 4,2%, however, soon reverted back toward the higher grounds. The highest weekly level was at 4,27%, however, closing level is 4,24%. The rise in rates reflected traders pricing in a potential shift in policy direction. Warsh’s blend of past hawkish criticism of the Fed’s balance sheet and mixed views on rate cuts has contributed to uncertainty, prompting slight upward pressure on 10Y yields even as short-term rate expectations moved differently. For the moment, further relaxation of 10Y yields is quite possible. In this sense, yields could test for one more time the 4,2%. The week ahead brings JOLTs and Unemployment data for December, which might increase volatility a bit.
Short 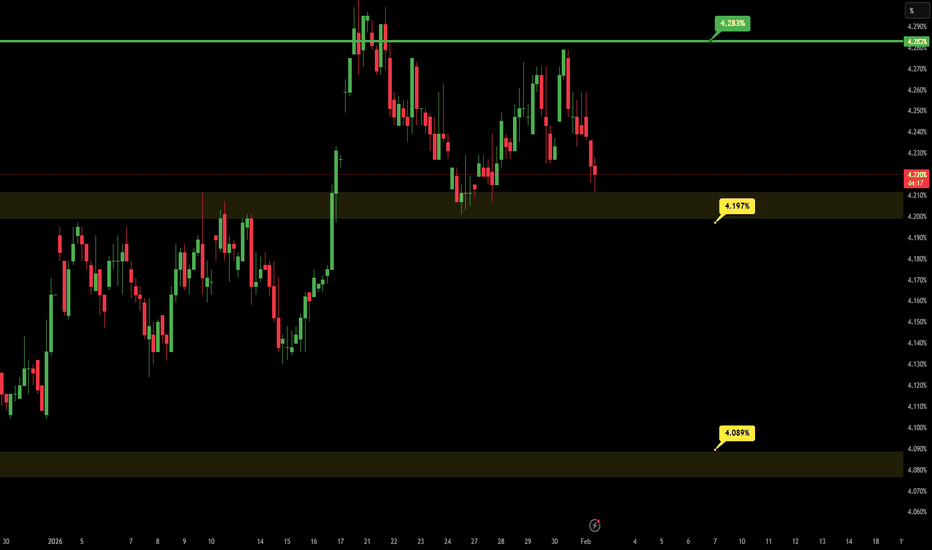
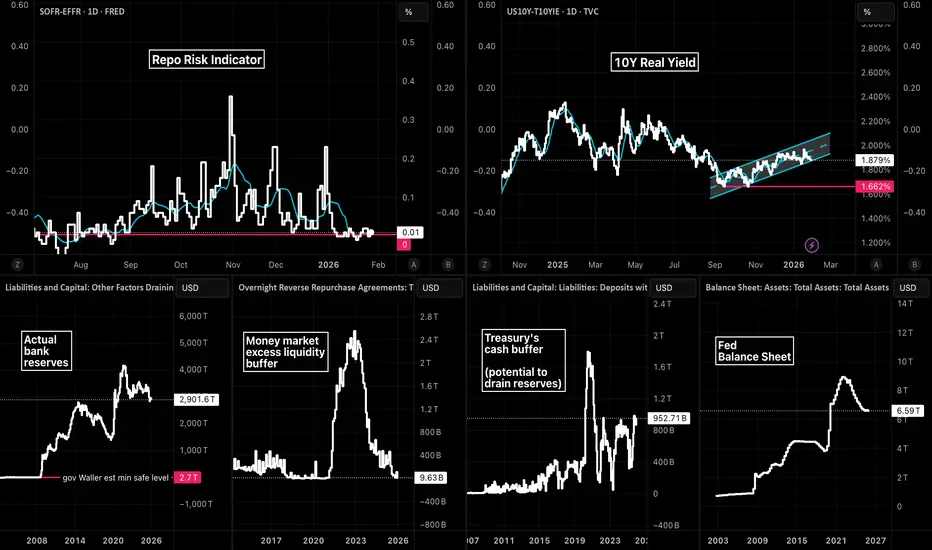
Liquidity Trickle at RiskThis dashboard is built around a simple idea: short-term funding can look calm while liquidity support quietly fades . The top-left panel, FRED:SOFR − FRED:EFFR , is the “plumbing alarm.” When it rises, secured funding is getting more expensive relative to unsecured funding—often a sign that cash is getting scarce in the places that matter. Right now, that spread is muted, which tells us the system isn’t showing acute overnight stress yet.
But the buffers underneath the plumbing are thinner than they look.
RRP usage is near depleted , meaning the money-market “shock absorber” that used to soak up Treasury issuance is largely gone. With that buffer drained, a TGA rebuild ( FRED:WDTGAL rising) is more likely to show up as a direct drain on bank reserves rather than being offset by cash rotating out of RRP. That’s why FRED:WRESBAL matters: it’s the remaining cushion.
So why have we seen risk assets wobble even without a repo-spread flare-up?
Because the market is trading the marginal impulse—and that’s increasingly about the Fed’s balance sheet .
The second chart is the focal point: after the post-COVID QT downtrend, the recent action looks like milder QT / a small balance-sheet “trickle” rather than an aggressive, continuous drain. Even a small easing in the slope can matter at the margin for the most liquidity-sensitive corners of the market.
That’s where expectations around leadership and posture enter. Kevin Warsh is widely perceived as hawkish on the balance sheet —more inclined toward discipline, faster normalization, and less tolerance for “stealth easing.” If markets start pricing a higher probability of that kind of balance-sheet stance, the implication is straightforward:
the recent trickle of liquidity support could stop—or reverse.
That expectation alone can drive what you’re seeing: a selloff concentrated in speculative silver, crypto, and high-beta equities , because those assets tend to be the first to reprice when the perceived liquidity impulse turns down. You don’t need SOFR − EFFR to spike for that to happen; often the speculative complex moves first, and the plumbing follows only if conditions truly tighten.
How to read the dashboard from here:
If FRED:WDTGAL rises while RRP stays pinned, watch FRED:WRESBAL for drawdown.
If reserves slide and funding tightens, FRED:SOFR − FRED:EFFR is your alarm.
If the balance-sheet “trickle” fades and real yields remain firm, the path of least resistance stays pressure on the speculative complex.
Education 
Long 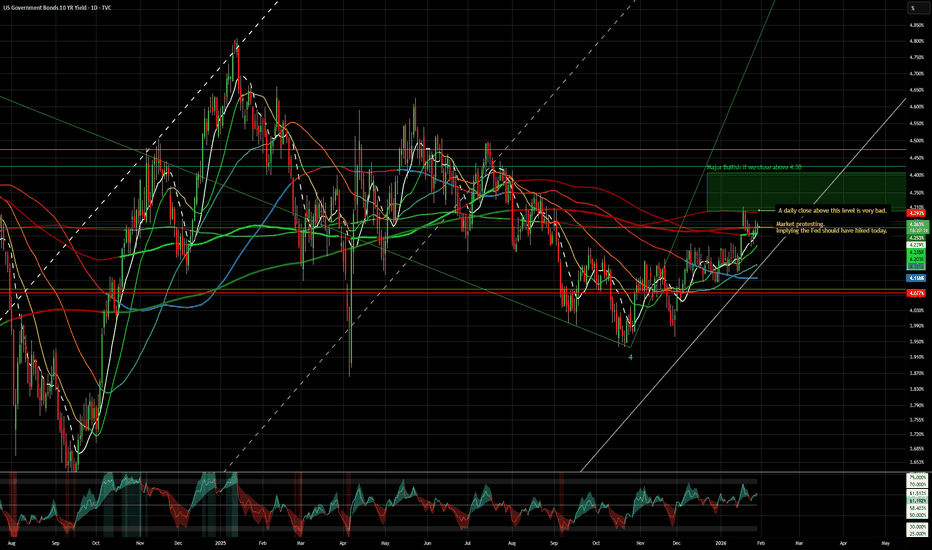
T bonds crashing Since the Fed began easing policy and trimming the federal funds rate, short-term borrowing costs have indeed drifted lower as expected. However, long-term Treasury yields — like the 10- and 30-year — have stubbornly stayed high or even climbed, pushing bond prices down. That’s the opposite of what “textbook” rate cuts usually do, but markets aren’t textbook right now.
The disconnect comes from the fact that Fed rate cuts only directly influence short-term rates, not the entire yield curve. Longer maturities reflect market expectations about inflation, growth, fiscal policy, government debt issuance and global demand for U.S. debt over decades — all of which can outweigh the effect of near-term Fed action.
Investors remain concerned about persistent inflation above target, heavy Treasury supply, fiscal deficits and weaker foreign demand, so they’re demanding higher yields for long-dated bonds to compensate for those risks. A higher yield means a lower bond price, i.e., a crash in long bonds even as benchmark policy rates fall.
In short: the Fed may be cutting the short-end to support growth, but the market is pricing the long-end based on inflation and risk premia farther out in time — and that’s keeping yields elevated and long bonds under pressure.  Short
Short
Short 
US 10Y TREASURY: Fed will hold rates? The previous week was full of news, both political and economical, bringing higher volatility to US Treasury yields. As the 4,2% was clearly broken, yields continued their path toward the higher grounds, reaching the peak weekly level at 4,31%. Still, some easing during the second half of the week brought yields slightly back, closing the week at 4,23%. Investors are still weighting the broader state of the U.S. economy and potential impact of current both political and geopolitical developments. In any case, economic signals currently remain mixed, increasing the probability of further higher volatility.
As for weekly macro data posted, the GDP Growth rate final for Q3 was standing at 4,4%, which was positive for the U.S. economy. Fed's favorite inflation gauge, the PCE Price Index in November was at the level of 0,2% for the month and 2,8% on a yearly basis, and was generally in line with market expectations. The next FOMC meeting is scheduled for the week ahead, where on Wednesday, its members will decide on interest rates. As per CME Fed WatchTool, current odds are 95% that the Fed will hold interest rates at this meeting. As for potential yield levels in a week ahead, there is some probability that the 4,2% support might be shortly tested, but generally, now that the 4,2% is definitely broken, the yields will seek higher grounds. Current levels that are in the spot line are between 4,30% and 4,35%.
Macro Structure Snapshot – Rates, Dollar & Yield Curve Alignment1) Short-Term Rates (2Y)
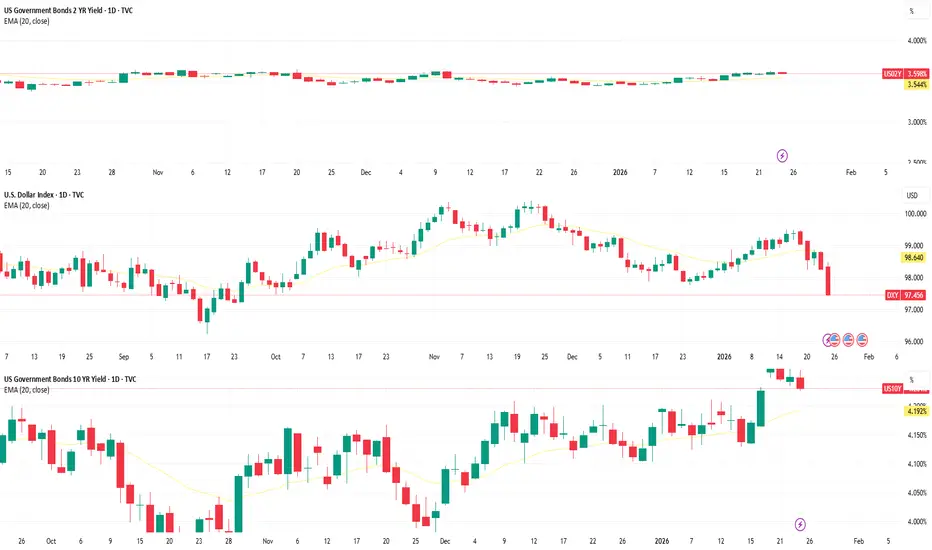
Short-term yields remain flat and stalled, reflecting continued compression and equilibrium. Momentum is muted, signaling ongoing digestion rather than directional intent. This reinforces a neutral short-term rate regime, keeping near-term liquidity pressure contained.
2) U.S. Dollar Index (DXY)
The dollar continues to unwind lower, now trading near 97.45, with the 20 EMA showing clear downward curvature. Momentum remains negative, confirming continued cooling rather than stabilization. Structurally, this maintains a risk-supportive macro backdrop, as dollar weakness typically alleviates pressure across broader asset classes.
3) Long-Term Rates (10Y)
Long-term yields remain constructive, holding higher with the 20 EMA maintaining smooth upward momentum. This reflects improving structural participation and supports a gradual re-expansion in macro trend energy, particularly relative to the continued stalling in short-term rates.
4) Macro Alignment
Macro structure continues to reflect a controlled regime transition:
Short-term rates compressed
Dollar trending lower
Long-term yields stabilizing and advancing
This alignment supports a constructive macro backdrop, where volatility remains restrained while broader structure slowly rebuilds.
5) What I’m Monitoring
I’m watching for:
Continued 2Y compression vs 10Y expansion, and
Whether DXY downside momentum persists,
as this combination often precedes broader directional clarity across equities, commodities, and crypto risk cycles.
⭐️Final Clarity Note⭐️:
This remains a structure-driven environment, where macro alignment favors stability, gradual risk expansion, and regime transition, rather than abrupt directional shifts. Compression continues to be the dominant force, with energy slowly rebuilding beneath the surface. Short 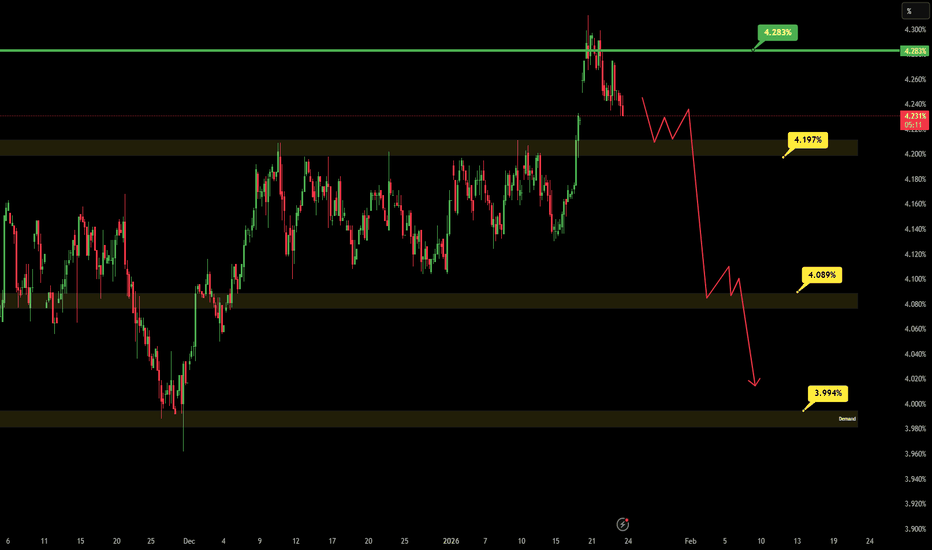
Want to Know Where Gold is Heading? Look at JP10Y!Want to Know Where Gold is Heading? Look at JP10Y!
+0.89 correlation: Did you know about this relationship between Japanese bonds and gold?"
One of the most overlooked indicators by gold investors is Japanese Government Bonds (JP10Y). When we examine the price movement over the past 5 years, a surprising relationship emerges: wherever JP10Y goes, gold follows!
📊 Correlation Analysis
The correlation coefficient between the two instruments is at +0.89 level, which means a very strong positive relationship.
On the chart, the red (JP10Y) and yellow (XAU/USD) lines move almost parallel. When JP10Y enters an uptrend, gold ounce seriously follows it, especially since January 2024, gold has caught a strong bull trend together with the rise in JP10Y.
🧠 So Why Does This Relationship Exist?
Why does gold rise when Japanese bond yields go up?
Japan kept interest rates very low for years, almost at 0% level. That's why investors borrowed cheaply from Japan and invested this money in high-interest countries. This strategy is known as "Carry Trade" and was very profitable for years.
Now the situation has changed. Japanese bond yields have started to rise and borrowing from Japan is becoming expensive. Investors are beginning to review their carry trade positions, saying "this business is not that profitable anymore."
When JP10Y rises, investors think: carry trade risk is increasing, uncertainty in markets may rise, and I may need to flee to safe haven. Also, when JP10Y rises, the Japanese Yen strengthens, a strong Yen puts pressure on the dollar, and a weak dollar pushes gold up because gold is priced in dollars.
As a result, when JP10Y rises, both the safe haven search and dollar weakness feed gold.
💡 Important Note for Investors
JP10Y can be used as a leading indicator for gold.
When JP10Y is in an uptrend, the expectation of a rise for gold may strengthen, if a sudden drop is seen in JP10Y, a correction may occur in gold, and the breakdown of correlation can be an early warning signal for a trend change.
📌 Conclusion
When investing in gold, it's not enough to just look at the dollar, the FED, or geopolitical events. Indirect indicators like JP10Y can also seriously affect your portfolio strategy. Critical level to watch: JP10Y holding above 1,5 may give a positive signal for gold.
Thanks for reading. US 10‑Year Yield: Time to Pay Attention Again Back on January 6tack on January 6th, I suggested keeping a close eye on the US 10‑year yield because it looked like it was starting to wake up. A couple of weeks on, that move is finally materialising.
What’s interesting here?
- We’ve broken above previous highs
- A small base has completed
- Price has pushed above the 200‑day moving average
- And we now have a buy signal on the cloud, exactly what we highlighted earlier this month
So where could this go?
Using the recent structure as a measured move gives us roughly 27 points of upside, pointing toward a minimum target around 4.47%.
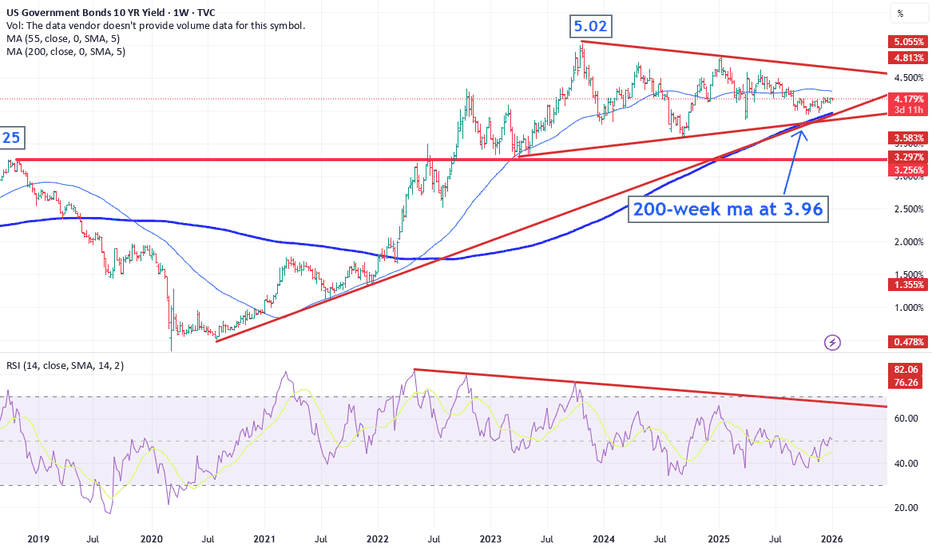
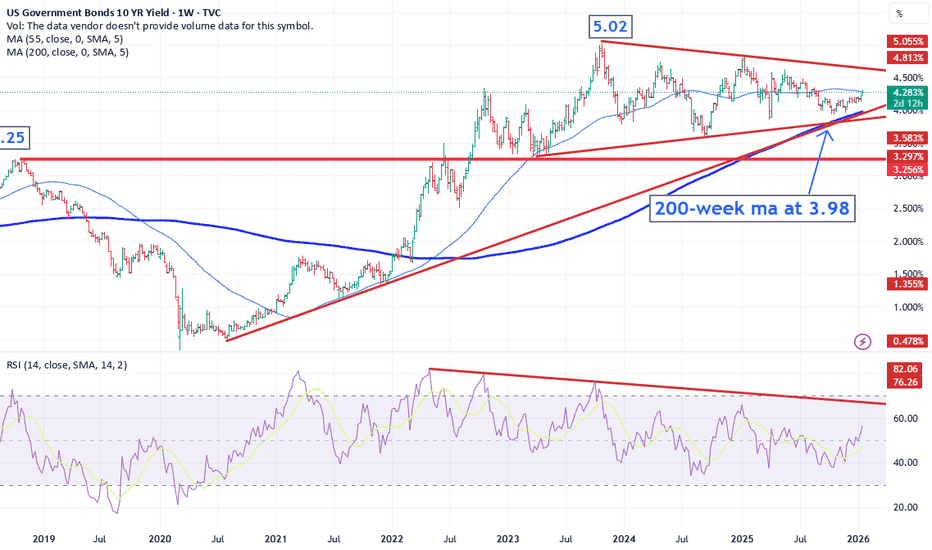
Zooming out to the weekly chart, the broader picture becomes even more compelling. The entire market remains supported by the 200‑week moving average at 3.98%, and for several years we’ve been trapped in a sideways, converging range. With momentum shifting, the risk now skews to the upside.
Within that long‑term range, there’s scope for a move toward ~4.61%, which aligns with the top of the structure.
🔍 Bottom line:
The US 10‑year is waking up. It’s getting interesting again. And it deserves a spot back on your radar.
Disclaimer:
The information posted on Trading View is for informative purposes and is not intended to constitute advice in any form, including but not limited to investment, accounting, tax, legal or regulatory advice. The information therefore has no regard to the specific investment objectives, financial situation or particular needs of any specific recipient. Opinions expressed are our current opinions as of the date appearing on Trading View only. All illustrations, forecasts or hypothetical data are for illustrative purposes only. The Society of Technical Analysts Ltd does not make representation that the information provided is appropriate for use in all jurisdictions or by all Investors or other potential Investors. Parties are therefore responsible for compliance with applicable local laws and regulations. The Society of Technical Analysts will not be held liable for any loss or damage resulting directly or indirectly from the use of any information on this site.
Long
Long 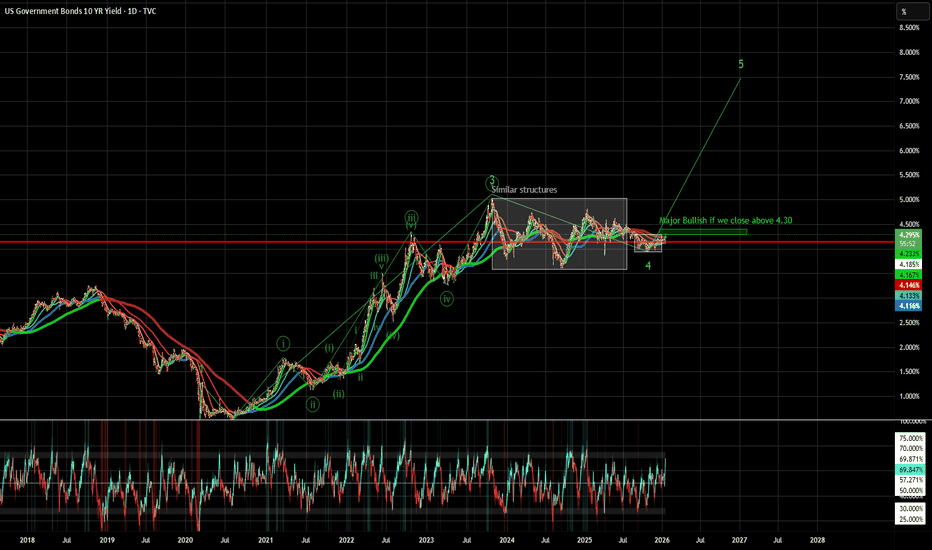
Short 
US 10Y TREASURY: 4,2% is broken, pending confirmationThe 10Y US Treasuries were testing the 4,2% level since September 2025, while this level was finally and strongly broken to the upside on Friday. The 10Y yields closed the week at 4,231%. Why is this event so important at this moment, when the market is talking about Fed rate cuts? The thing is that the Fed can impact short term rates, but investors are determining what returns they want for holding US Treasury bonds for the long term period. This is sort of market communication which is noting its expectations over sustained inflationary pressures, which could keep borrowing costs elevated and limit the scope for future Fed rate reductions. For investors, this implies a cautious stance on bonds and potential pressure on rate-sensitive assets like gold and long-duration equities.
From a technical analysis perspective, this breach indicates that the 4,2% will become the new supporting level and that further moves of 10Y yields could only be to the upside. As per charts, the next resistance level lies somewhere around 4,3% - 4,35% levels. Current geopolitical and political situations must be taken into account. Markets are not happy with uncertainties, so the current talks regarding US takeover of Greenland, and not contributing to a better US economic outlook. Also, the DOJ probe on Fed Chair Powell is also something that is not making markets happy, so they will naturally contract, until the view for the future looks better.
For the week ahead, now that the 4,2% is broken, this level will be tested again, in which sense, the breakout will be confirmed. If the 4,2% is confirmed, this will become the new supporting level for 10Y Treasury yields. In case that yields pull back below the 4,2%, then yields will search back levels around 4,1%-4,15%, but at this moment, there is low probability for such momentum.
US 10Y TREASURY: Crossroad ahead of inflation data The 10Y Treasury yields rose near multi week highs during the previous week, moving around 4,16% and 4,21% as markets digested the latest US jobs data on Friday. Yields initially climbed on the mixed December payrolls data, with modest job gains, but a drop in the unemployment rate reinforced expectations that the Fed is unlikely to cut rates imminently. The December jobs report showed weaker payroll growth than expected, with only 50K jobs added, yet the unemployment rate unexpectedly fell to 4,4%. This combination boosted short-term rate expectations and helped push 10Y yields higher.
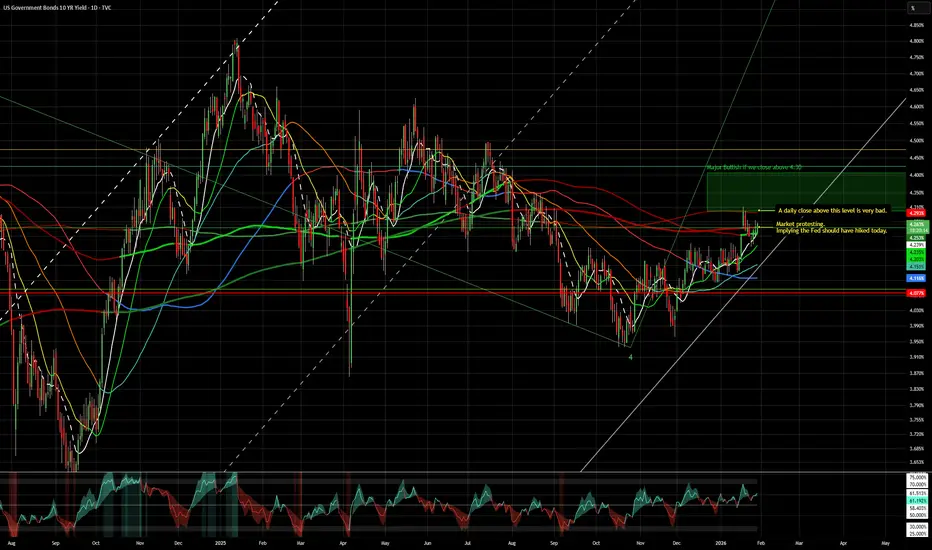
The 10Y yields are currently on a tricky part of charts. Friday's move above the 4,20% strong resistance level, indicates that there is potential for higher levels in the coming period. However, on the opposite side, a short term reversal is also quite probable. The week ahead brings US inflation data, which might trigger some higher volatility in the US Treasury market. At this moment, the level of 4,14% has the highest probability of occurrence in the coming short term period. However, considering mixed jobs data from this week and expected inflation figures in the week ahead, surprises should not be overseen.
The Yield Curve: A Forex Trader’s Early Warning SystemTradingView added the Yield Curves tab (found at the bottom right of your chart) to their UI last Year and constantly improved upon it. At first glance, it looks like a tool just for bond traders. But even though I am not a bond trader (yet), I started wondering: Can we use this as an early indicator for Forex trading?
The short answer is YES . While Forex traders usually watch price action and news, bond yields often move before the news hits the screen. In this write-up, I will show you how to use this "hidden" signal to stay one step ahead of the market.
First things first: How to Recreate My Charts
If you want to track this yourself on TradingView, search for these two symbols:
- US10Y - US02Y: This shows the "Spread" the gap between long and short rates.
- FRED:DFF: This shows the actual daily interest rate set by the Federal Reserve.
By overlaying these, you can see exactly when the bond market (the Spread) moved before the Fed (the Rate).
The Basics: What is a Bond Yield? (The Seesaw Rule)
To understand the chart, you only need to know Bond prices and yields move like a seesaw.
- When traders buy bonds: The price goes up, and the yield goes down.
- When traders sell bonds: The price goes down, and the yield goes up.
Why do we care? Yields represent the "market's opinion" on interest rates. If yields are falling, the market is betting that the Fed will cut interest rates soon. If yields are rising, the market expects rates to stay high. Because interest rates drive currency value, the yield curve is the ultimate indicator of what "Smart Money" is doing before the news goes public.
The Simple Math (The "Seesaw")
Bond yields and bond prices move on a seesaw. When one goes up, the other must go down because the interest payment (the "coupon") is fixed.
Think of a bond as a fixed contract that never changes. If you own a bond that pays exactly $50 a year, that $50 is locked in.
- Scenario A: You buy a bond for $1,000 that pays $50 interest. Your yield is 5% ($50 / 1,000).
- Scenario B: (Low CPI): Suddenly, a low inflation (CPI) report comes out. Investors get excited because they think the Fed will cut interest rates soon. They rush to buy your bond. Because everyone wants it, the price of your bond rises to $1,100.
The Result: The bond still only pays that fixed $50. But because the new buyer paid $1,100 for it, their yield is now only 4.5% ($50 / 1,100).
Simple English: You are paying more money (higher price) to get the same fixed reward. Therefore, your percentage of profit (yield) goes down.
Summary so far:
Low CPI: The market anticipates lower interest rates in the future.
The Action: Traders rush to lock in today's higher rates by buying bonds.
The Result: Bond prices go up.
The Math: Higher price for the same interest = Lower Yield.
This is why you will see the US10Y yield drop on your TradingView chart the second a "cool" inflation report hits the news.
Setting the Scene: The "Early Indicator" Theory
In a healthy economy, a 10-year bond should pay more than a 2-year bond. Why? Because lending money for 10 years is riskier than lending it for 2 years. This is a "Normal" curve.
An Inverted Curve happens when the 2-year yield is higher than the 10-year yield. This is the market’s way of saying: "We think the Fed has pushed rates too high for the 'Now,' and they will be forced to cut them in the 'Future' to save the economy."
The Timeline: 2019 to Today (Context to the Chart Above)
1. Aug. 2019: Pre-Covid Jitters The spread touches 0. The US-China trade war was slowing global growth. The bond market warned of a slowdown months before the pandemic.
2. Mar. 2020: Pandemic Shock The Fed cuts rates to 0.1%. The spread spikes as the market expects a massive recovery.
3. Mar. 2021: The "Transitory" Trap Inflation starts rising. The Fed says it’s temporary and keeps rates at 0.1%, but the spread starts falling. The bond market knew the Fed was wrong and that rate hikes were coming.
4. Mar. 2022: The Pivot The Fed finally hikes rates. The "Cheap Money" era ends. The 2-year yield spikes to keep up with the Fed.
5. Jun. 2022: Inflation Spike (KEY EVENT) (9.1%) Inflation hits a 40-year high. This is the "Panic Point." Investors realize the Fed must hike aggressively to break inflation.
6. Jul. 2022: The Great Inversion The spread falls below 0. The market signals a recession is coming. For the first time since 2008, the market decided that the "Now" was more risky than the "Future.”
7. Jul. 2023: The Bottom (KEY EVENT) (Soft Landing Bet) The spread hits its lowest point (-1.08%). Inflation drops to 3%, but jobs stay strong. The market starts betting that we might avoid a crash. The spread begins to rise.
8. 2022–2024: The Long Wait The longest inversion in history (26 months). The economy was "immune" to high rates because of 3% mortgages and corporate cash.
9. Sep. 6, 2024: The Un-Inversion (KEY EVENT) (Soft Landing Confirmed) The Golden Signal. The curve turns positive. This wasn't because of a crash, but because inflation was defeated. The bond market confirmed the Soft Landing 12 days before the Fed’s first 0.50% cut.
10. Jan. 2026: Normalization We are here today. The spread is stable at +0.68%. The Fed rate is 3.50%. The curve is healthy again.
The Takeaway
The Rule: The bond market represents "Smart Money."
The Signal: A rising spread usually means the market expects rate cuts or economic strength.
For Forex: If the spread rises before the Fed cuts, it’s an early signal to look for Dollar weakness.
The next time you see the US10Y - US02Y line making a big move on your chart, don't wait for the Fed meeting. The bond market has already made its decision. If the spread is rising, the market is "pricing in" a weaker dollar or a rate cut. As Forex traders, that is our cue to look for setups.
Think of it this way: The spread is a "Confidence Meter."
Falling Spread: "We are worried the Fed is hiking too much."
Rising Spread: "We are excited the Fed is finally cutting rates to help the economy."
*** Congratulations for making it this far! Let me know in the comments if you use or plan to use these early indicators. Education 
US 10‑Year Yield: Quiet… but waking up?The range may look dull, but there are signs of life. The 10‑year has broken above its short‑term downtrend from June, yet it’s still capped by the September high at 4.20% and the 200‑day MA around 4.23%.
Price has now pushed above the Ichimoku cloud, with the lagging line following — a subtle but meaningful shift ahead of NFP and rising geopolitical tensions.
On the weekly chart, strong support from the 2020 uptrend and the 200‑week MA at 3.96% keeps the structure intact. A break above 4.24% could open the path toward the long‑term channel top near 4.61%.
One to keep firmly on the radar.
Disclaimer:
The information posted on Trading View is for informative purposes and is not intended to constitute advice in any form, including but not limited to investment, accounting, tax, legal or regulatory advice. The information therefore has no regard to the specific investment objectives, financial situation or particular needs of any specific recipient. Opinions expressed are our current opinions as of the date appearing on Trading View only. All illustrations, forecasts or hypothetical data are for illustrative purposes only. The Society of Technical Analysts Ltd does not make representation that the information provided is appropriate for use in all jurisdictions or by all Investors or other potential Investors. Parties are therefore responsible for compliance with applicable local laws and regulations. The Society of Technical Analysts will not be held liable for any loss or damage resulting directly or indirectly from the use of any information on this site.