Government bonds
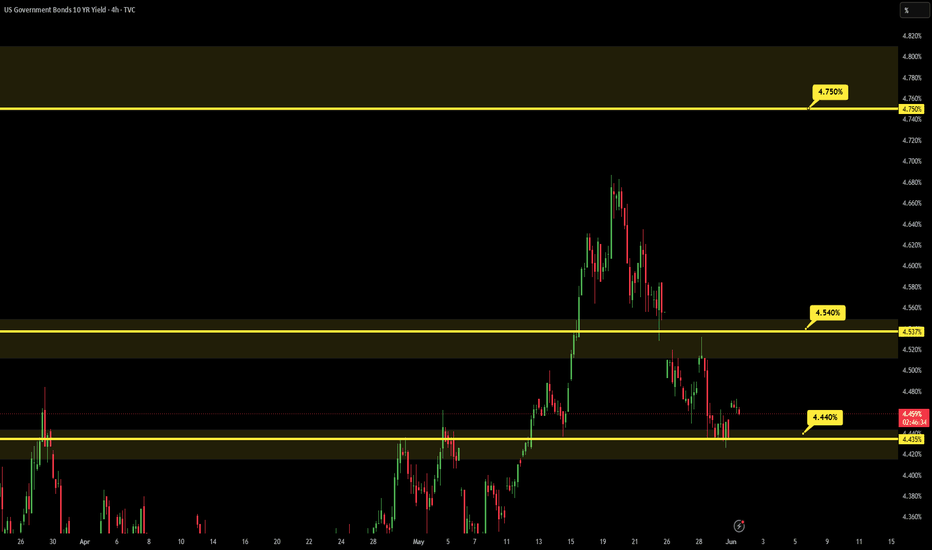
US 10Y TREASURY: this week is all about jobsU.S. 10-year Treasury yields held relatively steady on Friday after retreating from recent highs, as easing tensions between the U.S. and Iran helped reduce inflation concerns tied to energy prices. Softer than expected inflation data, including the latest PCE report, also supported bond markets by reinforcing expectations that the Federal Reserve may avoid further rate hikes in the near term. At the same time, weaker first quarter GDP revisions pointed to slowing economic momentum, adding to de
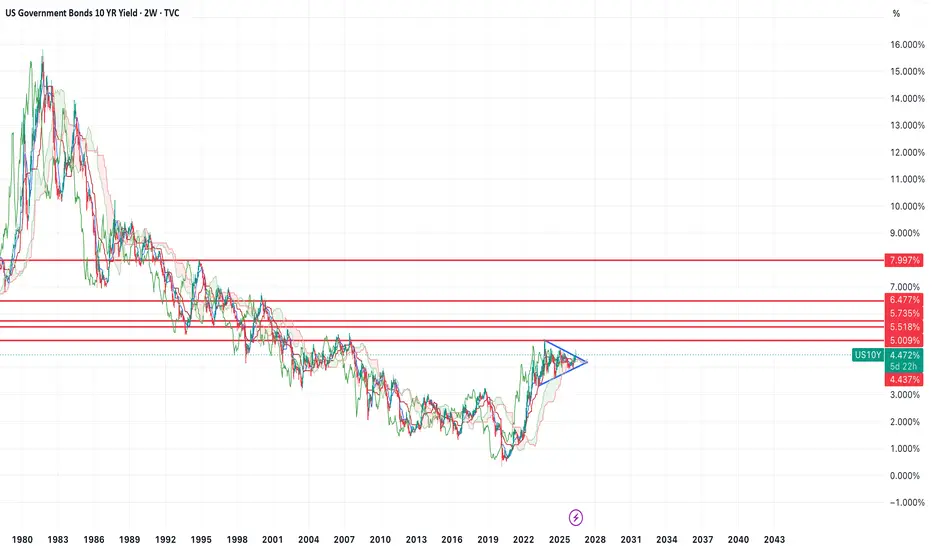
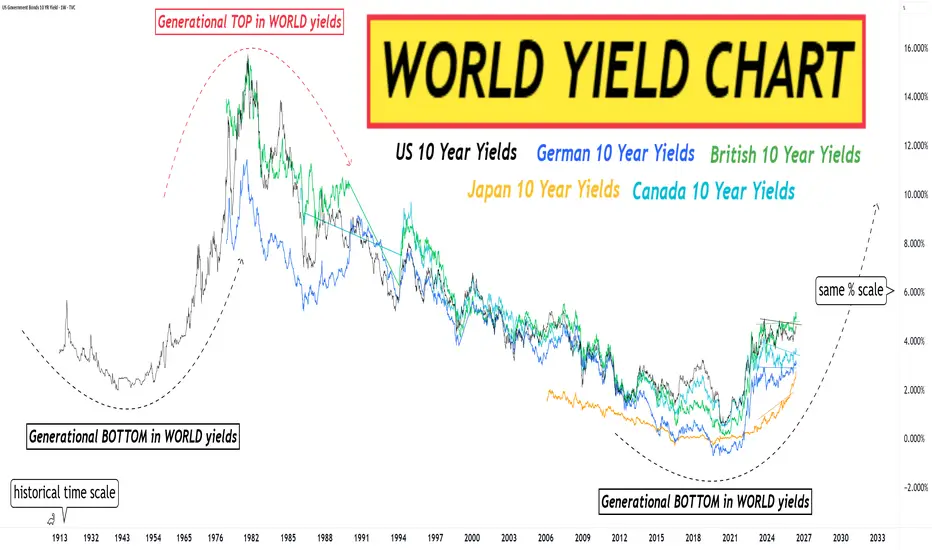
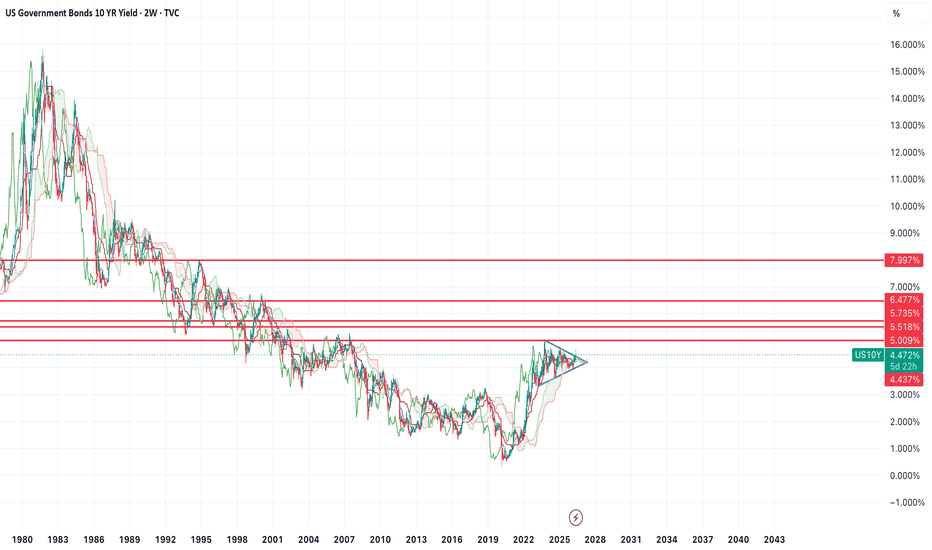
Rates set to make new highs?If we look at a long term chart of 10 year yields, it looks like we've broken out of a 3 year bull flag and look set to move higher.
I could see a move all the way up to the ~8% which would be the 50% retracement of the prior high from 1981.
Let's keep an eye on this over the coming months...
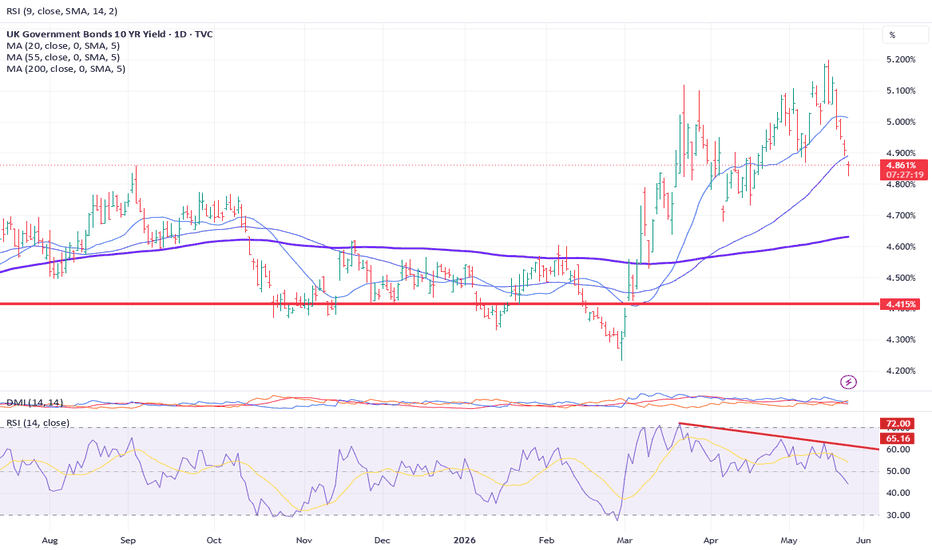
## UK 10-Year Yield: Momentum Cracking Below Key Moving Averages
The UK 10Y yield may finally be showing signs of exhaustion after the recent push towards 5.20%.
Technically, there are several developments worth paying attention to here.
The recent highs were accompanied by a notable RSI divergence — often an early warning that upside momentum is beginning to fade.
Price action has also now slipped back below both the 20-day and 55-day moving averages, suggesting bullish momentum is deteriorating short term.
On the weekly timeframe, yields also rejected
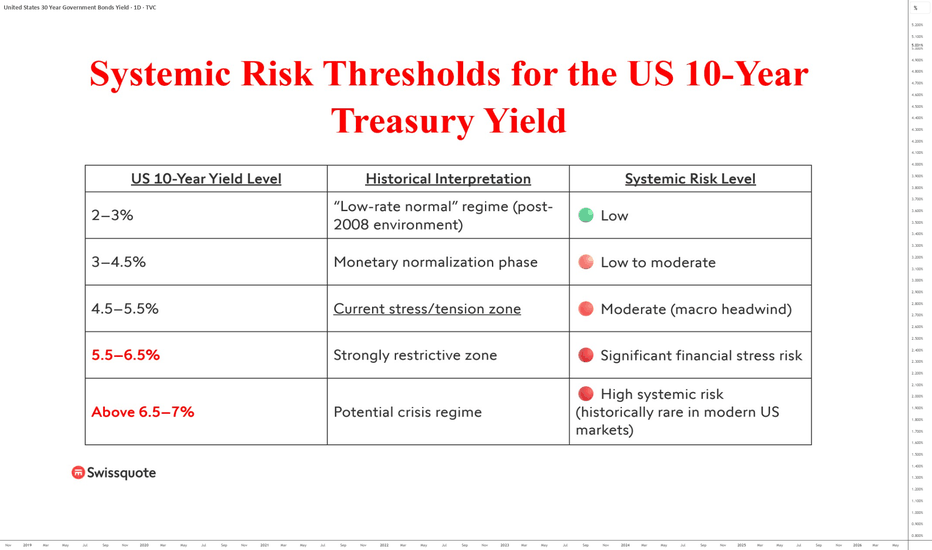
Interest rates: the systemic risk thresholdSince the start of military operations in the Middle East on February 28, long-term bond yields have risen sharply, particularly the long end of the yield curve. This increase in long-term interest rates is explained by a combination of fundamental factors, including rising energy prices, higher inflation, and rising inflation expectations.
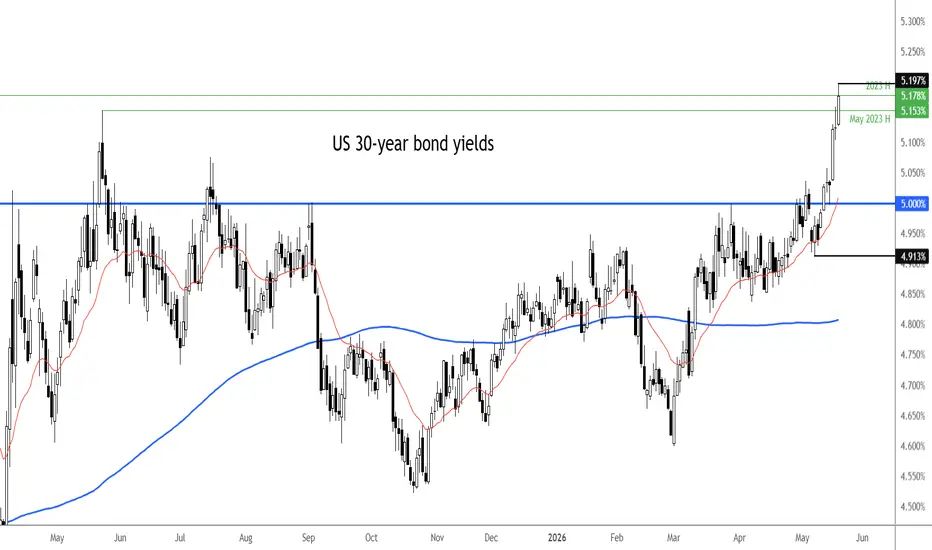
As the US 30-year Treasury yield has returned to its October 2023 highs, exceeding the 5% threshold, should we fear a systemic risk for the economy, the sta
Global Capital Is Flowing Into BondsHello to all TradingView followers and traders 🌍📈
Hope your trades are always filled with profits, clarity, and smart decision-making 💚🔥
Today we’re taking a look at one of the most important indicators in the global financial system: US10Y (U.S. 10-Year Treasury Yield) — a market that directly impacts stocks, gold, the U.S. dollar, and even crypto markets 🏦💵📊
Fundamental Overview of U.S. Treasury Yields 🧠🌎
The U.S. Treasury yield is considered one of the most important indicators of the Ameri
US 10Y TREASURY: focused on PCE dataU.S. Treasury markets remained volatile this week, with the 10-year Treasury yield holding near multi-month highs. On Friday last week 10Y yields reached 4,6% levels, however, Monday and Tuesday this week impact strong further movement toward the upside. The highest weekly level was at 4,69%, while yields are closing the week at 4,57%. Investors continue to reassess the outlook for inflation, Federal Reserve policy, and economic growth. Persistent inflation concerns, supported by elevated oil p
All depends on Us02y nowIf it breakout upwards then everything will go down; stocks, crypto, metals
If we backtest the US02y decades breakout and go down (so the FED can also justify a rate cut), then we will see a huge blow off top in everything; stocks; crypto; gold to 10k in the next 12-24 months
US10Y Is Pushing Higher _ And Other Markets Feel ItToday I’m back with a fresh U.S. 10-Year Government Bond Yield ( TVC:US10 ) view. This index is a major macro gauge, and when it trends higher it can pressure risk assets like US equities, Gold ( OANDA:XAUUSD ), Silver ( OANDA:XAGUSD ), and crypto, especially Bitcoin ( BINANCE:BTCUSDT ). It’s worth keeping on your chart. In the previous analysis , the bullish path played out, and key targets were reached.
Right now, US10Y has broken above its resistance line and is moving near a resistance
U.S. 2-Year Yield 1H
The 2-year yield is the cleanest rate-market expression of today’s theme. It has repriced higher over the past week, but the latest chart shows consolidation rather than a fresh breakout.
Yield is near 4.093%, sitting between short-term support at 4.061% and resistance at 4.112%. The broader range is 4.013% to 4.139%, with price holding above the rising trendline but failing to extend through the upper Bollinger band. PPO is flat, which shows that rate momentum has paused after the prior move
Bank of America flips yen call Bank of America Securities has revised its outlook on the Japanese yen, moving from a bearish to a neutral stance and lowering its 2026-end USDJPY forecast to 152 from 157.
The bank highlights that while the yen has softened toward the 160 level, improving structural fundamentals could support a less negative view.
At least two specific catalysts could push the bank to an outright bullish position: Japan's 10-year government bond yield approaching 3%, or Brent crude falling below $90 per bar
US10Y bullish prediction is still intact from previous chart The united states 10year treasury at 4.627% in the fx window. The monthly chart shows enormous upswing potential based on the breakout of the monthly supply roof ,on technical i need a pull back as retest candle to the broken supply roof to go long and target 5.2%
the flip side will be a break and close of the current ascending trendline and the target will be 3.3%-3.4% zone .
the structure is showing me a bullish potential
what is US10Y???
The 10-year Treasury note is a debt security issued by
Bond yields get dangerously highTrump on time for Iran: 2-3 days, maybe til early next week. That's what he said when reporters asked him about until when those planned additional strikes on Iran were being delayed until.
Trump's remarks means the upward pressure on oil remains. And that's one of the of the biggest reasons behind the dollar's strength.
The other is the the rise in US Treasury yields. In fact, the US 30-year Treasury yield has now climbed to 5.197% today, marking its highest level since July 2007.
If yields
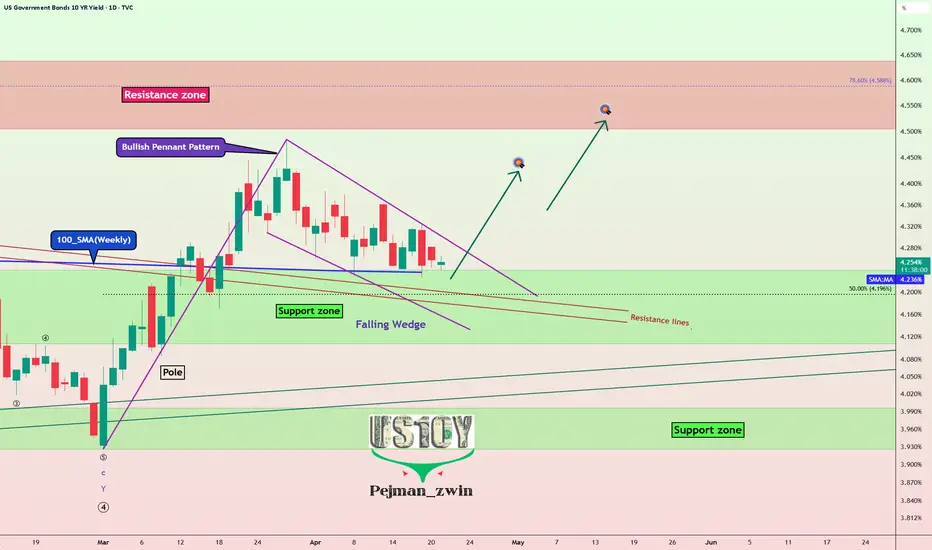
US10Y Is Waking Up — Major Markets Could Feel It!Today, we’re taking a closer look at the U.S. 10-Year Government Bond Yield ( TVC:US10 ) on the daily timeframe. This metric reflects the return investors earn from holding 10-year U.S. Treasury bonds and serves as a key indicator of market sentiment toward the U.S. economy. Because of its importance, movements in this yield play a major role in shaping capital flows across different asset classes and influencing overall financial conditions.
------------
Let’s look at US10Y on the daily timef
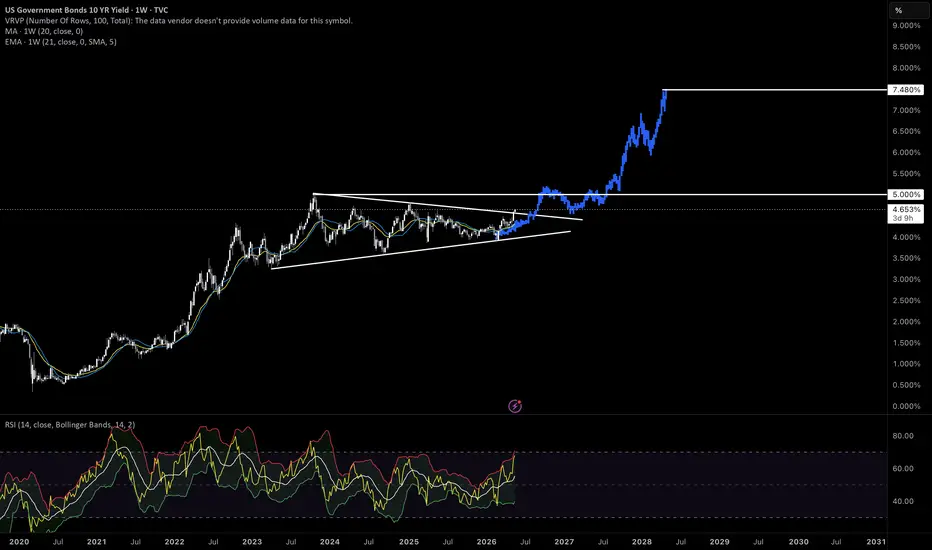
US10Y: BreakoutThe US10Y is breaking out of this multi-year consolidation pattern. If we break above the previous high at 5.00%, we could potentially see 7.50%. Using a measured move, 7.48% is possible in early 2028.
With the stock market starting to show some erratic behavior, and my current belief that we'll see prices a lot lower Q3/Q4 of this year, it lines up that people will look to bonds instead of the stock market. Bonds will have a higher return, while stocks will continue to decline.
The economy
US10Y Massive Weekly Close Breakout - 5% Next !?THE US10Y IS THE BEACON OF TRUTH IN FINANCIAL MARKETS.
As predicted, the 10Y yield is back above 4.6% and have officially entered the danger zone.
The US Guvament has to refinance ~$9.8T of debt this year with the biggest intra-year cliffs in February and August.
I think we all remember what happened to CRYPTOCAP:BTC in February; don’t be surprised if we see the same in August.
If yields stay elevated for the next couple of Weekly Closes outside of this massive 6-year bull pennant, then I
US 30Y approaching 2023 highBond yields rising again today, bad news for gold and other zero yielding assets like silver and Bitcoin, as well tech and other growth stocks. All to do with oil. Oil initially rallied sharply, extending the 10% gains from last week, after Trump warned Iran that the clock is ticking and that there “won’t be anything left” if there is no progress soon in the stalled U.S.-Iran talks. Prices then dropped $5 from its highs to turn red on reports Iran's oil sanctions during the negotiation period wi
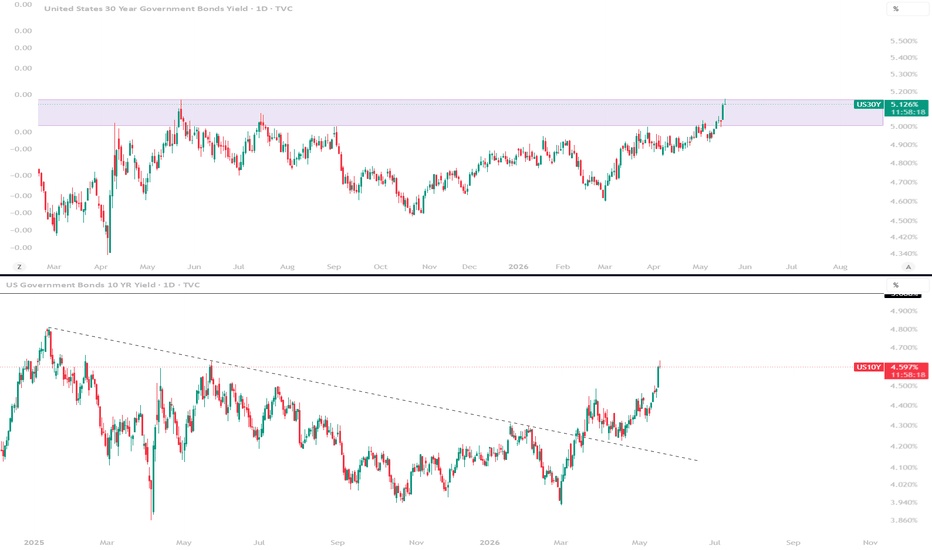
Bad signal for markets: US bond yields keep rising Charts above:
• US 10Y Treasury yield
• US 30Y Treasury yield
And both are starting to look dangerous.
Yields continue moving higher, breaking resistance levels and accelerating upward.
This is one of the most important macro signals for global markets.
🤔 Why does it matter?
When bond yields rise → money becomes more expensive.
That means:
• borrowing costs increase
• liquidity tightens
• debt becomes harder to service
• investors reduce exposure to risk assets
That’s why rising yields h
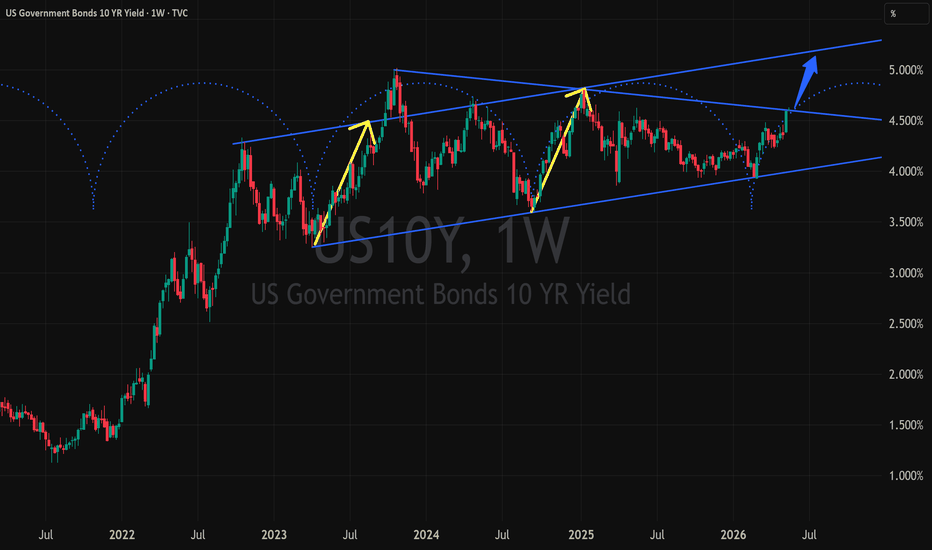
US Bond Yields Break Ascending Broadening WedgeUS10Y — "US Bond Yields Break Out of Consolidation! A Fresh Alarm for Risk Assets?"
Date: May 18, 2026
We need to take our eyes off stocks and crypto for a moment to analyze the global proxy for borrowing costs: the 10-Year US Treasury Yield (US10Y). The weekly chart is flashing a major warning signal that could soon rattle investment portfolios worldwide. Let’s break down what price patterns and time cycles are revealing.
________________________________________
🔍 1. Technical Analysis
• B
US 10Y TREASURY: Higher for longer expectationsU.S. 10-year Treasury yields surged as stronger than expected inflation data reinforced expectations that interest rates will stay elevated for longer, complicating the policy outlook for newly appointed Fed Chair Kevin Warsh. Markets increasingly see persistent inflation fueled by rising energy prices and geopolitical tensions as key drivers behind the bond selloff. The benchmark 10Y yield climbed toward 4.6% on Friday, reflecting investor concerns that inflation pressures may prevent the Fed