US interest rates Point & Figure says long term 14.1%At present, the Point & Figure (PnF) vertical count, using a 0.1 box size on a close-only basis, projects a very long-term target of 14.1% on the US 2-Year Treasury yield.
One of the reasons I pay close attention to the US 2-Year yield is my belief that the market leads the Federal Reserve, not the other way around. In particular, I believe the Fed largely follows the direction of the US 2-Year Treasury yield, which acts as the market's collective expectation of future monetary policy and infla
Government bonds
US interest rates target long term 14.1% At present, the Point & Figure (PnF) vertical count, using a 0.1 box size on a close-only basis, projects a very long-term target of 14.1% on the US 2-Year Treasury yield.
One of the reasons I pay close attention to the US 2-Year yield is my belief that the market leads the Federal Reserve, not the other way around. In particular, I believe the Fed largely follows the direction of the US 2-Year Treasury yield, which acts as the market's collective expectation of future monetary policy and infla
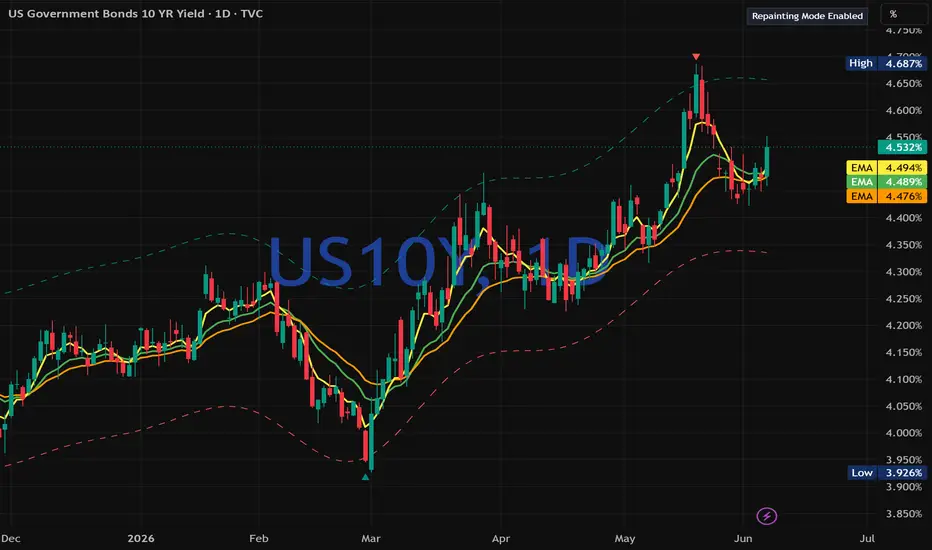
US10Y Holds Near 4.50%....US10Y Holds Near 4.50% — Breakout in Yields or Another Rejection Ahead?
US10Y is currently trading around the 4.48%–4.50% area after a period of choppy consolidation. The yield has recovered from the mid-June low near 4.42%, but it is now facing resistance around the 4.50% region. This area is important because a sustained move above it could signal renewed upside pressure in yields, while another rejection may keep the market locked inside the current range.
From a market structure perspectiv
Central Banks' Actions — Why Global Inflation Is Here to StayOver the past few months, I've repeatedly pointed your attention to the US bond market. Yields on 10-year and 30-year US Treasury bonds remain at levels that typically signal expectations of higher inflation and higher interest rates for a prolonged period of time.
But the most interesting part is that this is not just an American story.
If you look at the UK, Germany, Japan, and most other major economies 🔍
You'll notice the same trend. Long-term government bond yields are sitting near mu
US 10Y TREASURY: Yields rise on rate-hike risksU.S. Treasury yields moved higher this week as markets reacted to the Federal Reserve’s more hawkish tone following Chair Kevin Warsh’s first policy meeting. Although rates were left unchanged, the Fed signaled that additional tightening remains possible if inflation proves persistent, prompting investors to reassess the outlook for monetary policy. This shift reinforced expectations of a “higher-for-longer” rate environment, pushing benchmark yields, the 10Y Treasury, upward closing the week at
UK Debt - 30 year bond yields - 2 possible pathways...there maybe trouble ahead...
Keeping an eye on the 10 and 30 year bond yields with two possible routes over the next 5 years.
Route one continuation up to 10% from 5% as a 5 wave move. But this would be at odds with the stock market looking very strong till 2029.
Route two - ABC correction for a larger wave B followed by an wave C made up of 5 waves, to get to 10%
Route two would point to a possible top in the stock market in 2029, then a large correction as wave C moves to 10%.
UK 10
EU10Y EURO 10YEAR TREASURY BOND YIELD EU10Y IN CONTEXT.
Deposit facility 2.25 %
Main refinancing operations (fixed rate) 2.40 %
Marginal lending facility 2.65 %
EU10Y are influenced by ECB rate expectations, inflation outlook, growth, and quantitative tightening. The ECB under Lagarde remains data-dependent, with a more cautious stance than the hawkish Fed under Warsh.
• Lower German yields relative to policy rates reflect expectations of eventual easing or stable policy if Eurozone growth lags. Real yields (nominal minus infl
US10Y — Hawkish Fed, Resistance Ahead—Continuation or Pullback?Following yesterday’s FOMC communication and the market’s interpretation of Kevin Warsh’s conference as relatively hawkish, Treasury markets reacted by repricing expectations toward a more restrictive path ahead. Markets focused less on the unchanged rate decision and more on the stronger commitment to price stability and reduced expectations for near-term easing. Short-term Treasury yields moved higher as investors reassessed future policy expectations.
From a technical perspective, US10Y re
US10Y (United States government 10 year treasury bond yield)US10Y refers to the U.S. 10-Year Treasury Note Yield (also called the 10-year Treasury yield). It is a key benchmark interest rate representing the yield (return) on the U.S. government’s 10-year debt obligation. 
• Current level Approximately 4.43%–4.44%
• It serves as a major economic indicator, influencing mortgage rates, corporate borrowing costs, stock valuations, and currency strength (e.g., higher US10Y often supports USD in pairs like GBP/USD). 
Bond Price vs. Bond Yield: The Invers
US 10Y TREASURY: Oil decline lifts bonds U.S. Treasury yields moved lower over the week, with the 10Y benchmark easing to 4,43%, as markets reacted to improving geopolitical sentiment surrounding a potential U.S.–Iran agreement. Hopes that a deal could reopen the Strait of Hormuz helped drive a sharp decline in oil prices, reducing near-term inflation concerns tied to energy costs and easing pressure on the long end of the curve. While headline inflation has remained elevated due to earlier energy shocks, recent developments suggest th
US10Y UNITED STATES GOVERNMENT 10YEAR TREASURY BONDYIELD.The United States government 10year treasury yields rejected by monthly Supplyroof at 4.671%,break and close above this zone could target 5.0% yearly.
Core PPI m/m 0.4% 0.5% 0.7%
USD PPI m/m 1.1% 0.7% 1.1%
Unemployment Claims 229K 220K
• Headline PPI m/m: Actual 1.1% (vs. forecast 0.7%, previous 1.1%). This came in notably hotter than expected. Year-over-year, it rose to 6.5% (highest since late 2022), driven heavily by energy/goods prices — especially a big jump in gasoline (~23% contribution t
US 10Y TREASURY: Macro drives yield bounce The U.S. 10-year Treasury yields were traded higher on Friday, moving back to 4,53% level. Market participants focused on labor-market indicators throughout the week, seeking clues about the future path of Federal Reserve policy. While softer economic data initially supported expectations for rate cuts, stronger-than-expected payroll figures released later reinforced the view that the Fed may keep interest rates elevated for longer, limiting the decline in yields and supporting the U.S. dollar.
Why Bond Yields Jumped After NFPThink of Treasury yields as the market's prediction of where interest rates are headed.
### Before NFP
The market was thinking:
"The economy may be slowing, so the Fed could cut rates soon."
If rates are expected to fall:
* Existing bonds with higher rates become more valuable.
* Investors buy bonds.
* **Bond prices rise.**
* **Yields fall.**
### After Strong NFP
The jobs report said:
> "The economy is still strong."
Now traders think:
* Fed may cut rates later than expected.
* Intere
US10Y yield is breaking out of 2y downtrend...get ready US10Y yield is breaking out of 2y downtrend...formed bullish flag, testing support=trend line, it will be a wake up call for many at: 5-5.2%
The information and publications are not meant to be, and do not constitute, financial, investment, trading, or other types of advice or recommendations
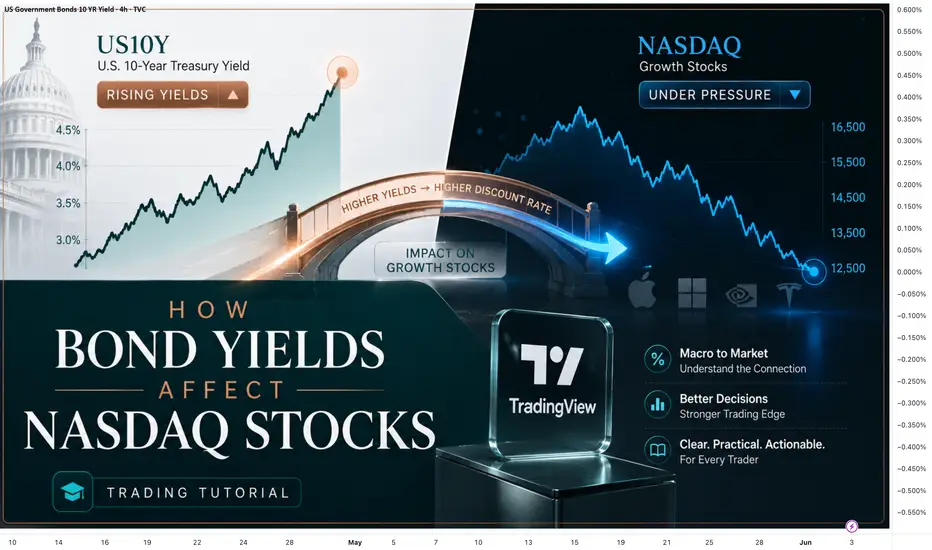
How Bond Yields Affect NASDAQ StocksMany traders watch only the stock chart, but sometimes the real pressure on the market comes from outside the chart.
One important thing NASDAQ traders should understand is the relationship between bond yields and growth stocks.
NASDAQ is heavily influenced by technology and growth companies. These companies are often valued based on future earnings. When bond yields rise, the market starts discounting those future earnings more aggressively. In simple words, higher yields can make future prof
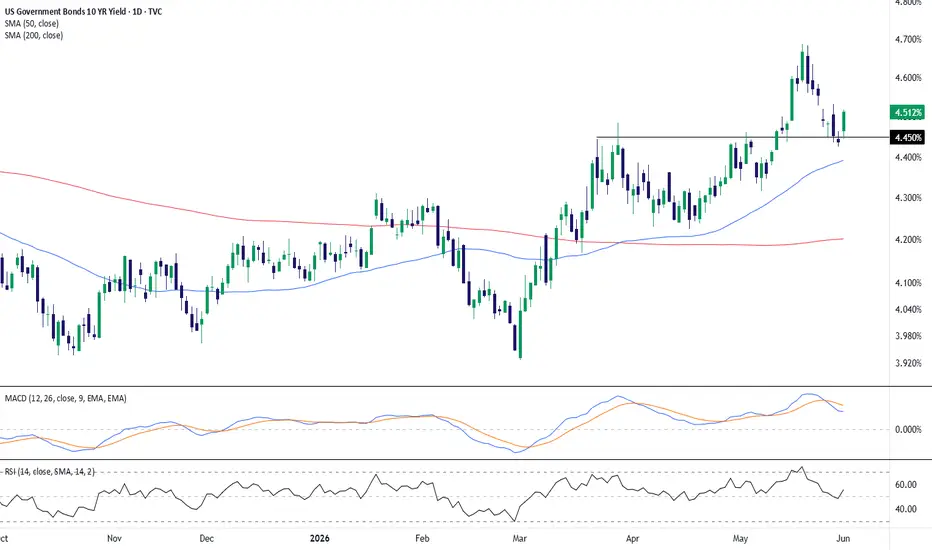
US 10Y Yield Holds Above Key Moving Averages as Momentum CoolsThe US Government Bonds 10-Year Yield remains in an elevated structure on the daily chart, with price holding above both the 50-day SMA near 4.39% and the 200-day SMA near 4.20%. This keeps the broader technical backdrop constructive, as the shorter-term average continues to trend above the longer-term average following the earlier upside shift.
Recent price action shows a pullback from the May high near the 4.70% area, followed by stabilization around the prior breakout zone near 4.45%. The la