• Products
  • Community
  • Markets
  • Brokers
  • More
Get started
  • Markets
  • /USA
  • /Stocks
  • /Ideas
Time for a Ride UBER is testing the lower boundary of a multi-year ascending channel on the monthly chart. RSI has cooled far more than price, a classic hidden bullish divergence that often precedes the next leg up. Channel Bottom Retest: UBER has been trading within a well-defined ascending channel since the 2020 lows. Price is now back at the lower trendline, a level that has historically attracted buyers. This is the first clean test of channel support since the 2022 correction, making the zone structurally significant. RSI Has Cooled More Than Price — Hidden Bullish Signal: The key observation: while price has made a lower high from the 2025 peak ~$87 to current levels ~$72, RSI has declined even more aggressively from the 75+ zone all the way to 47.67 at the mid-line. The momentum indicator has "over-corrected" relative to price. This means sellers are exhausted and the risk/reward favors buyers at this juncture. Monthly Timeframe = High-Conviction Signal A channel support test on the monthly chart carries significant weight. Monthly candles filter out noise and represent genuine accumulation/distribution. A bounce from this level could easily deliver a 20–35% move back toward the channel midline or upper boundary. ⚠️ This is a technical trade idea for educational and informational purposes only. It does not constitute financial advice. Past chart patterns are not indicative of future results. Always manage your own risk and position size. DYOR
NYSE:UBERLong
by cksharma23
TESLA: Does the Bullish Hammer Signal a Structural Reversal?Technical Context TSLA has printed a bullish hammer at $337.24 , converging with descending parallel channel support and terminating an ABC zigzag decline (Wave W). RSI momentum at 34.70 indicates downside deceleration. As defined in Steve Nison's Japanese Candlestick Charting Techniques , this morphology fulfills the exact prerequisites for a valid, high-probability reversal signal. Bullish Scenario The thesis dictates the initiation of an upward connector Wave (X). The hammer's structure signals aggressive institutional accumulation at channel support, rendering it an actionable pivot without requiring subsequent structural confirmation. Trigger: Actionable at the current closing price of $347.16 . Target: A primary resistance zone spanning from $418.04 (0.5 Fibonacci retracement) to $437.10 (0.618 Fibonacci retracement, establishing confluence with the prior Wave B peak). Invalidation (Stop Loss): A daily close below the absolute low of the hammer at $337.24 . Disclaimer: This analysis is for educational purposes only and does not constitute investment advice. Please make your own decisions before making any trading decisions.
NASDAQ:TSLALong
by WaveXplorer
PLTR Daily Chart Analysis: Major Resistance Break Palantir Technologies (PLTR) is delivering a textbook breakout structure in early 2026. After a sharp multi-month correction, the stock has not only cleared a critical horizontal resistance but is now using it as a launchpad for higher prices. The momentum shift is clear and volume-confirmed. Key Observations from the Chart: - Sharp Correction Phase: From the January highs near 190+, PLTR sold off aggressively into February with heavy red volume (notice the massive red volume spike – classic capitulation). - Support Floor Held: The Support level @ 128.83 acted as rock-solid buying zone during the February low. Multiple tests with long lower wicks showed strong demand. - Explosive Breakout: In March, buyers stepped in hard. The tall green candles + blue breakout line smashed through the Resistance level @ 135.37 on strong volume. That level has now flipped cleanly to support — exactly what we love to see in a reversal. - Current Structure: Price is trading at 148.46 (+1.34% today) and has pulled back modestly from the ~161 swing high. This is healthy consolidation above the breakout zone. - Trendline/Moving Average: The purple curved line (likely a key moving average) has flattened after its earlier decline and is now curling slightly higher — confirming the broader momentum shift from bearish to neutral-to-bullish. Current Technical Picture: - Price has successfully retested the broken resistance (135 area) and is holding above it with conviction. - The March volume surge was the highest on the chart and was accompanied by strong green candles — institutional buying signal. - We’re now seeing higher lows forming after the breakout, with the blue arrow on the chart highlighting the new uptrend direction. - Next logical resistance sits near 150.00–155.00 (psychological round number + prior swing area), followed by a potential retest of the 161–166 zone. Bullish Bias: - Long setup: Current price action holding above 148 with daily close confirmation above the flipped resistance. - Target 1: 155.00 (next major resistance) - Target 2: 161.00–166.00 (previous swing high + extension) - Invalidation / Stop: Below 135.00 (former resistance, now support) or tighter below 128.83 if we lose the broader floor — protects against any failed breakout. Risk-reward remains very favorable here. The structure is clean, volume supports the move, and the downtrend from early 2026 is officially broken. This is a textbook “resistance becomes support” continuation setup. Palantir bulls are in control, and the next leg higher looks ready to unfold. What do you think, TradingView community? Is PLTR ready for a fresh leg toward 160+ or do you see distribution at these levels? Drop your analysis below 👇
NASDAQ:PLTRLong
by JayeshBorwankar
**NFLX Daily Chart Analysis: Classic Downtrend Breakout + Moment Netflix (NFLX) is showing one of the cleanest technical reversals we’ve seen in early 2026. After a multi-month downtrend, the stock has successfully broken and retested its major structure — and the latest candle is confirming buyer control. ### Key Observations from the Chart: - **Downtrend Termination**: The purple descending trendline (connecting December 2025 highs near 108 down to the March lows) has been decisively broken. Price is now trading comfortably above it — a classic trend-reversal signal. - **Major Support/Resistance Flip**: - **Support level @ 75.83** held perfectly during the February-March capitulation (multiple red candle tests). - **Resistance level @ 79.15** was smashed on massive volume in March — that horizontal now acts as major support. - **Breakout Candle**: The tall green volume spike in March (highest volume bar on the entire chart) was the catalyst. Buyers stepped in aggressively and cleared the 79–80 zone with conviction. - **Healthy Pullback & Retest**: After the initial surge, price pulled back into the 90–94 area (normal retest behavior) and is now bouncing with strong momentum (+3.25% today, currently at **98.66**). - **Momentum Indicator**: The lower blue line (likely a moving average or trend filter) has been slowly curling higher since late 2025 — confirming the broader momentum shift. ### Current Technical Picture: - Price has cleared the March breakout high and is pressing toward the next logical resistance zone near **104.00 – 108.00** (previous swing highs). - The blue upward arrow drawn on the chart perfectly captures the current structure: higher lows + higher highs forming after the breakout. - Volume profile supports the move — the March explosion was not a one-off; recent green candles are also showing above-average participation. **Bullish Bias** - **Long setup**: Current price action above 98.66 with daily close confirmation. - **Target 1**: 104.00 (next psychological level) - **Target 2**: 108.00 (full retracement of the downtrend) - **Invalidation / Stop**: Below 94.00 (recent swing low + retest zone) — protects against any failed retest. Risk-reward on this setup is attractive given the clear structure and volume confirmation. This is a textbook example of **“support becomes resistance → resistance becomes support → trend reversal”**. The downtrend is dead, and the new uptrend is just getting started. What do you think, TradingView community? Is NFLX heading back to triple digits or do you see any bearish divergence I’m missing? Drop your thoughts below 👇
NASDAQ:NFLXLong
by JayeshBorwankar
NVIDIA waiting for a new motive wavea wxy correction maybe end at $163, and price is building a new motive wave drive to 240 wating for a break of structure, if price get higher than 188 the entry buy can explore in a pullback after that Key Points to Watch: -188: A price breakout above this level is a key factor to consider when evaluating an upward scenario. -163: If the price falls below this level, the buy plan will be invalidated, and the wave analysis needs to be re-evaluated.
NASDAQ:NVDALong
by f2high
NYSE – S&P 500 | RTX Corporation | 04 Apr 2026Sustained Impulsive Structure → Expansion Phase Trend: Uptrend | Location: Upper Zone | Behaviour: Impulsive Structure assessed from earliest reliable data Secular advance → sustained impulsive structure Showing impulsive behaviour within trend Part of the S&P 500 Structural Census. For educational purposes. Structural market observation. Structure → Level → Trigger → Probability #SP500Census #MarketStructure #RTX
NYSE:RTX
by kacraj
NASDAQ – S&P 500 | Palantir Technologies Inc. | 04 Apr 2026Regime Shift Structure → Expansion Phase Trend: Uptrend | Location: Upper Zone | Behaviour: Impulsive Structure assessed from earliest reliable data Base formation → regime shift structure Showing impulsive behaviour within trend Part of the S&P 500 Structural Census. For educational purposes. Structural market observation. Structure → Level → Trigger → Probability #SP500Census #MarketStructure #Palantir
NASDAQ:PLTR
by kacraj
NYSE – S&P 500 | Chevron Corporation | 04 Apr 2026Sustained Impulsive Structure → Expansion Phase Trend: Uptrend | Location: Upper Zone | Behaviour: Impulsive Structure assessed from earliest reliable data Secular advance → sustained impulsive structure Showing impulsive behaviour within trend Part of the S&P 500 Structural Census. For educational purposes. Structural market observation. Structure → Level → Trigger → Probability #SP500Census #MarketStructure #Chevron
NYSE:CVX
by kacraj
NASDAQ – S&P 500 | Texas Instruments Incorporated | 02 Apr 2026Sustained Impulsive Structure → Maturity Phase Trend: Uptrend | Location: Upper Zone | Behaviour: Corrective Structure assessed from earliest reliable data Secular advance → sustained impulsive structure Showing corrective behaviour after advance Part of the S&P 500 Structural Census. For educational purposes. Structural market observation. Structure → Level → Trigger → Probability #SP500Census #MarketStructure #TexasInstruments
NASDAQ:TXN
by kacraj
NYSE – S&P 500 | Exxon Mobil Corporation | 02 Apr 2026Sustained Impulsive Structure → Expansion Phase Trend: Uptrend | Location: Upper Zone | Behaviour: Impulsive Structure assessed from earliest reliable data Secular advance → sustained impulsive structure Showing impulsive behaviour within trend Part of the NIFTY 750 Structural Census. For educational purposes. Structural market observation. Structure → Level → Trigger → Probability #NF750Census #MarketStructure #ExxonMobil
NYSE:XOM
by kacraj
Noble corporateion Plc analysisThis is only for learning purpose, its not tip or recommendation. I am going to buy this stock because 1. Got good move up. 2. giving good correction of 3 weeks. 3. volume is dead during correction 4. has outperformed the market. 5. Mid financials, mid valuation, good momentum score 6.net income QoQ is up 7.institution holding is unchanged. 8 has broken the high of 2 year 9.retesting the same zone. I am managing my risk by stop loss of 6.64%
NYSE:NELong
by amitsinghcs
22
GEV - Mean Reversion Long Setup | 57% Win Rate, 3.5 Profit FactSETUP NYSE:GEV just triggered a mean-reversion screen on the 1H chart. The idea: when selling gets overdone on high volume, a bounce follows more often than not. Screen conditions: - Close below VWAP - EMA(9) below EMA(20) - Volume above 20-period average - More than 60% of the last 20 candles were red That last filter is the key. It catches probability plays where bearish momentum is statistically stretched. When 12+ of the last 20 candles are red on above-average volume, the rubber band is pulled tight. BACKTEST CONTEXT Over the past 2 years, this exact setup triggered 30 times on GEV: - Win Rate: 57% - Avg Return per Trade: +2.6% - Profit Factor: 3.5 - Sample Size: 30 signals A 3.5 profit factor means winners were significantly larger than losers. The 3:1 reward-to-risk (6% target vs 2% stop) is doing the heavy lifting here. TRADE PLAN - Bias: Long - Entry: Current levels - Stop Loss: 2% below entry - Target: 6% above entry - Risk/Reward: 1:3 - Timeframe: Hourly WHAT WOULD INVALIDATE THIS A continued breakdown below the stop with expanding volume and no intraday recovery attempt. If the broader market is in a sharp selloff (not just GEV-specific weakness), this mean-reversion setup loses its edge. CONTEXT Finding high-conviction long setups in a market like this is rare. Most screens are flashing caution. When one stock shows a clean mean-reversion signal backed by 30 prior instances and a 3.5 PF, it stands out. Not every signal works, but the edge is clear over a large enough sample.
NYSE:GEVLong
by ChartMath
11
CSX Breaking Multi-Year Range – Retest Before ExpansionCSX is attempting a breakout from a multi-year resistance zone around 39–40, a level that has capped price for a long time. The initial breakout is in place, but price is now pulling back to retest the zone a critical phase where the market decides whether this is a true breakout or a trap. Holding above this level would confirm strength and open the path towards higher liquidity near 48–50, offering a potential 20% upside. However, failure to sustain above the breakout zone could push price back into consolidation. With structure shifting and accumulation already visible, the bias remains bullish — but confirmation is key.
NASDAQ:CSX
by Marketik
Tesla Sitting at Liquidity Zone – Reversal or Breakdown?Tesla is currently trading at a critical liquidity zone near the 350–360 range, where multiple equal lows have formed a classic area where stops accumulate. While this level may appear as strong support, it is more likely acting as a liquidity pool waiting to be swept before any meaningful move begins. A clean sweep below this zone followed by a sharp reclaim could trigger a strong reversal towards 400+ and potentially higher levels near 500. However, with structure still showing lower highs and momentum remaining weak, a direct bounce without liquidity grab is less likely. This makes the current zone a high-risk area for early entries and a key level to watch for confirmation.
NASDAQ:TSLALong
by Marketik
Microsoft Sitting at Demand – 30% Upside Setup in PlayMicrosoft is currently testing a major demand zone near 350–360 after a sharp correction from its highs. This level has historically acted as strong support, and with RSI deeply oversold, selling pressure appears exhausted. The setup now presents a potential mean reversion opportunity, with upside liquidity resting near the 470–480 zone nearly a 30% move from current levels. However, this is not a clean breakout scenario yet. Price is likely to stabilize and build a base before any sustained recovery. A reclaim of the 400–420 zone will be the first confirmation of strength, while failure to hold demand could delay the move further. With strong fundamentals still intact, this zone becomes a key area for accumulation rather than chasing.
NASDAQ:MSFT
by Marketik
AT&T Testing Major Supply After Strong RecoveryAT&T has rallied sharply from its demand zone and is now pressing against a key descending resistance around the 29 level. This zone has historically acted as supply, and price is currently sitting right below it making this a critical decision point rather than a confirmed breakout. A clean break and hold above 29–29.5 can unlock further upside towards 31–32, as liquidity above the trendline gets taken. However, this area is also prone to a potential trap a fake breakout followed by a pullback to shake out late buyers before continuation. With momentum building and demand structure intact, the bias remains bullish, but confirmation is key.
NYSE:TLong
by Marketik
Coca-Cola Holding Breakout Structure After Liquidity SweepCoca-Cola has already broken out of its ascending triangle and swept liquidity above previous highs, which confirms strength but the move isn’t done yet. Price is now pulling back towards the breakout zone near 74–75, which is a critical demand flip level. This phase decides whether the breakout sustains or turns into a trap. If price holds above this zone and builds support, continuation towards 82+ and higher liquidity levels becomes highly probable. However, a breakdown below this structure could trigger a short-term trap, shaking out late buyers before the next leg up. With defensive stocks gaining attention in uncertain macro conditions, accumulation remains intact — but patience here is key.
NYSE:KOLong
by Marketik
Best setup is developing in this stock Keep this stock on Radar When the trade activates for upside then put stoploss at 249 price When the trade activates for downside then put the stoploss at 255 price
NASDAQ:AAPL
by rajputnarendrasingh579
This stock will give 9 % move any one side Keep this stock on Radar it will give good move on any one side When the price takes support on our level then put your stoploss on swing low When the price brakes the our level then put the stoploss on swing high Any enquiry then don't hesitate to comment i will be there to support traders
NASDAQ:TSLA
by rajputnarendrasingh579
GooGSince 14th Apr 2025 there has been non-stop rally until Jan 2026. Only in Feb 2026 it has shown profit booking and the only reason for this selling is due to high disparity whicch has impacted means price reversal. below 294 closing basis it may try to hit 271 and after the bounce the second fall may come into affect. Later price may stabilize around 241 However I have concern for the gap formed between 2nd sep 2025-3rd Sep 2025 for price range of 211-232 which is important to get filled. one final rise is pending before fresh selling to get into action. therefore stop loss is far around 352
NASDAQ:GOOGShort
by SunilDhawan
11
AAPLAfter making high in Dec beginning it has shown gradual fall in price 12th feb and 25th feb is when it made clear signal that now 273 could be a resistance closing below 245 is when bear start showing fall in price. 224 could be first medium support but bear could break it later. Only between 215-192 it may start making base to consolidate 260 is stop loss for this view
NASDAQ:AAPLShort
by SunilDhawan
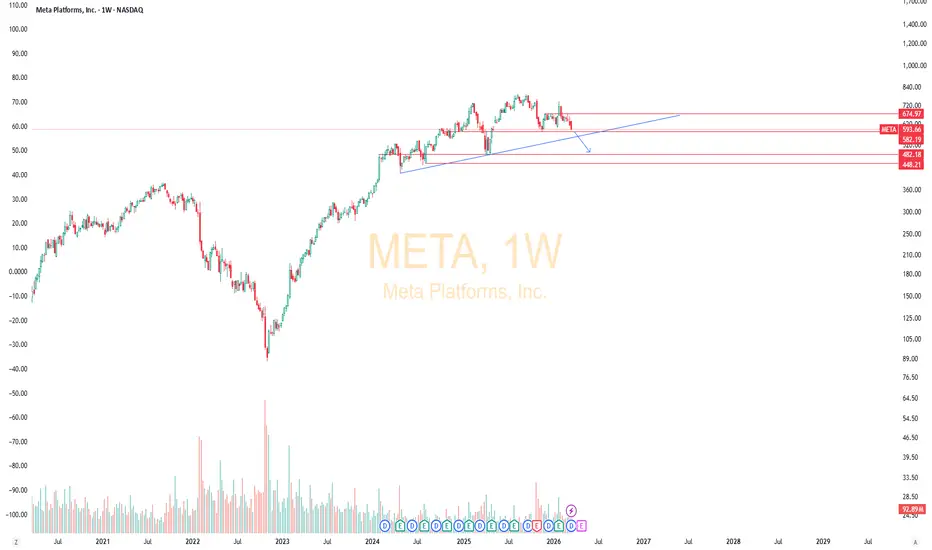
METAWhat happened in Oct 2025 and Nov 2025 is going to perform follow through selling now below 585 closing basis 550 may try to give support however it may not work and price may stabilize around 480 in worst case 450 would be final support. this setup could be ignored only above 675 all these levels are on closing basis.
NASDAQ:METAShort
by SunilDhawan
22
S&P 500 STRUCTURAL CENSUS | META | 20 MAR 2026Introduction META continues to operate within a sustained impulsive structure, with the long-term secular trend remaining intact. Structure Overview Structure: Sustained Impulsive Regime: Secular Uptrend (Active) Trend: Bullish Continuation Current Behaviour: Higher-range consolidation Context The 2022 decline functioned as a corrective reset within the primary trend, followed by a strong impulsive recovery. Currently, price is consolidating near the upper range, indicating compression after expansion rather than structural weakness. Disclaimer This is a structural observation, not a prediction or recommendation. #SP500 #META #MarketStructure #StructuralAnalysis #EwavesJournal #PriceAction #LongTermInvesting
NASDAQ:META
by kacraj
112233445566778899101011111212131314141515161617171818191920202121222223232424252526262727282829293030313132323333343435353636373738383939404041414242
…999999

Made by humans

Select market data provided by ICE Data Services. Select reference data provided by FactSet. Copyright © 2026 FactSet Research Systems Inc.Copyright © 2026, American Bankers Association. CUSIP Database provided by FactSet Research Systems Inc. All rights reserved. SEC filings and other documents provided by Quartr.© 2026 TradingView, Inc.

More than a product
  • Supercharts
Screeners
  • Stocks
  • ETFs
  • Bonds
  • Crypto coins
  • CEX pairs
  • DEX pairs
  • Pine
Heatmaps
  • Stocks
  • ETFs
  • Crypto coins
Calendars
  • Economic
  • Earnings
  • Dividends
  • IPOs
More products
  • Portfolios
  • Fundamental Graphs
  • Yield Curves
  • Options
  • Macro Maps
  • Pine Script®
  • MCP Server
Apps
  • Mobile
  • Desktop
Community
  • Social network
  • Wall of Love
  • Refer a friend
  • Creator program
  • House Rules
  • Moderators
Ideas
  • Trading
  • Education
  • Editors' picks
Pine Script
  • Indicators & strategies
  • Wizards
  • Freelancers
  • Marketplace
Tools & subscriptions
  • Features
  • Pricing
  • Market data
  • Gift plans
Trading
  • Overview
  • Brokers
  • Brokers comparison
  • The Leap
Special offers
  • CME Group futures
  • Eurex futures
  • US stocks bundle
About company
  • Who we are
  • Space mission
  • Blog
  • Help Center
  • Careers
  • Media kit
Merch
  • TradingView store
  • Tarot cards for traders
  • The C63 TradeTime
Policies & security
  • Terms of Use
  • Disclaimer
  • Privacy Policy
  • Cookies Policy
  • Accessibility Statement
  • Security tips
  • Bug Bounty program
  • Status page
Business solutions
  • Widgets
  • Charting libraries
  • Lightweight Charts™
  • Advanced Charts
  • Trading Platform
Growth opportunities
  • Advertising
  • Brokerage integration
  • Partner program
  • Education program
Community
  • Social network
  • Wall of Love
  • Refer a friend
  • Creator program
  • House Rules
  • Moderators
Ideas
  • Trading
  • Education
  • Editors' picks
Pine Script
  • Indicators & strategies
  • Wizards
  • Freelancers
  • Marketplace
Business solutions
  • Widgets
  • Charting libraries
  • Lightweight Charts™
  • Advanced Charts
  • Trading Platform
Growth opportunities
  • Advertising
  • Brokerage integration
  • Partner program
  • Education program
Look FirstLook First