Long
Long
 Long
Long
 Long
Long
 Long
Long
 Short
Short
Global Sanction Rules1. What Are Sanctions? — Definition and Scope
International sanctions are punitive measures imposed by one state, a group of states, or an international organization against a target state, group, organization, or individuals to influence their behaviour without using military force. They can include economic, financial, diplomatic, and trade restrictions and are among the most powerful peaceful tools available in international relations.
Sanctions can be multilateral (made by a group of countries or under an international body like the United Nations) or unilateral (imposed by a single country independently). They may also be regional, created by economic or political blocs such as the European Union.
2. Legal Basis: Who Can Legally Impose Sanctions?
United Nations Security Council (UNSC)
The UNSC is the only international body with explicit authority under international law to impose sanctions that all UN member states must comply with. Chapter VII of the UN Charter (Article 41) covers measures short of military action that the Council can take to maintain or restore international peace and security.
UN sanctions may include arms embargoes, financial restrictions, travel bans, and other measures targeted at states or non‑state actors considered threats to peace. Because they are mandated by the UNSC, they are binding on all UN members.
Regional and National Sanctions
Countries and regional blocs (e.g., the EU) also establish sanctions under their own laws or treaties. While these are legally binding within their jurisdictions, they are not automatically binding internationally unless backed by a UN mandate.
For example:
The EU Global Human Rights Sanctions Regime can impose visa bans or asset freezes on non‑EU officials responsible for gross rights violations.
The U.S. Global Magnitsky Act enables sanctions on foreign individuals for corruption and human rights abuses, affecting their access to U.S. financial systems.
3. Purposes of Global Sanctions
Sanctions are imposed for a number of political and security reasons:
a) Maintaining International Peace and Security
Sanctions are intended to deter acts that disrupt peace or violate international law — such as territorial invasions, aggression, or arms proliferation — without resorting to war. UNSC sanctions on Iraq after its 1990 invasion of Kuwait exemplify this.
b) Preventing Nuclear Proliferation and Terrorism
Targeted at countries or entities engaged in developing weapons of mass destruction or assisting terrorism, sanctions seek to cut off financing and material support. For instance, various sanctions against Iran aimed to curb its nuclear program.
c) Human Rights Enforcement
Many sanctions regimes now focus on individual accountability for human rights abuses. This includes travel bans and asset freezes on implicated persons, as seen under EU and U.S. measures.
d) Combating Corruption and Financial Crime
Financial sanctions can target individuals, companies, and banks involved in money laundering, corruption, or sanctions evasion. This is a core purpose behind the U.S. Global Magnitsky regime.
4. Types of Sanctions — Practical Rules in Operation
Global sanctions are not monolithic — they differ in scope and effect.
1) Financial Sanctions
These block access to global banking systems, freeze assets, and prohibit investment or financing. For targeted individuals or groups, this can be a crippling restriction.
2) Trade Sanctions
This includes bans on imports/exports of goods, technology, or services. It may target entire sectors (like energy or defense) or specific items such as dual‑use technologies.
3) Travel Bans
Individuals — often government officials, military leaders, or businesspeople — may be barred from entering sanctioning countries. This isolates them diplomatically and symbolically.
4) Arms Embargoes
These specifically prohibit the transfer of military equipment or weapons to a target. For example, the UN arms embargo reimposed on Iran affects arms sales.
5) Sectoral Sanctions
Rather than targeting an entire country, these focus on specific industries such as finance, energy, or transportation to undermine economic capabilities tied to harmful policies.
5. Enforcement Mechanisms and Implementation Rules
a) Domestic Enforcement
Sanctioning countries must implement their measures into domestic law, which includes mechanisms for monitoring compliance and penalizing violations. This may involve customs agencies, financial regulators, and immigration authorities.
b) Secondary Sanctions and Extraterritorial Reach
Some sanctions regimes — particularly U.S. ones — include secondary sanctions that punish foreign entities engaging with sanctioned targets. These extend the rules beyond the sanctioning country’s borders and create a compliance pressure on global businesses.
c) Multilateral Cooperation
Countries often harmonize sanctions to increase effectiveness. For example, EU member states collectively enforce bloc‑wide measures, and many follow UNSC resolutions.
6. Snapback Mechanisms — Special International Rules
Certain international agreements include automatic reinstatement clauses known as snapback provisions. These allow previously lifted sanctions to be reactivated if a party is deemed to have violated terms of an agreement. This was used in the context of Iran’s nuclear deal, where previously lifted sanctions were reimposed when obligations were thought to be breached.
7. Controversies and Criticisms
While sanctions are widely used as non‑military pressure tools, they are controversial:
a) Humanitarian Impact
Even when targeted, broad sanctions can harm civilians by disrupting economies and access to essential goods, especially in developing countries. Critics argue sanctions are a form of economic warfare.
b) Legitimacy and Unilateral Sanctions
Sanctions imposed without UN backing — especially by powerful countries on weaker states — raise questions about legality and fairness under international law. Countries like India have historically opposed unilateral sanctions as extra‑territorial impositions.
c) Effectiveness Debates
There is ongoing debate about whether sanctions achieve political goals or simply entrench opposition, force political realignment, or hurt ordinary citizens more than leaders. Often, comprehensive multilateral sanctions are believed to be more effective than isolated unilateral ones.
8. Examples of Global Sanctions in Practice
Iran
UN and multi‑country sanctions have focused on Iran’s nuclear and missile programs through arms embargoes, freezing assets, and financial restrictions. Snapback provisions have been used to reinstate sanctions after perceived treaty violations.
Human Rights Sanctions
The EU and U.S. lists include individuals and entities associated with gross human rights abuses — for example visa bans and frozen assets for violators worldwide.
Secondary Sanctions Risk
Countries like India face compliance decisions when secondary sanctions (e.g., on Russian oil importers) could affect trade decisions, shaping national policy choices under global sanction regimes.
9. Role of Global Governance and Future Trends
The effectiveness and legitimacy of global sanction rules often depend on multilateral cooperation and consensus. Global governance bodies like the UN and regional blocs play a major role in designing, recommending, and enforcing these regimes. As geopolitical competition increases, discussions about reform and fairer, legally grounded sanction practices continue.
Conclusion: Understanding the Rules
In essence, global sanction rules are the legal and political frameworks that govern the imposition of non‑military punitive measures in international relations. They originate from international law (primarily the UN), regional agreements (EU laws), and national legislation (like Magnitsky laws). They seek to preserve peace, punish abuses, enforce norms, and influence behaviour — but also raise complex questions about fairness, effectiveness, humanitarian consequences, and the balance of power in global governance.  Education
 Long
Long
 Long
Long
Navigating the Correction and Targeting the Next HurdleSMCI appears to be in the final stages of a significant corrective phase on the monthly and daily charts, following a strong impulse move. This analysis suggests we are working within a larger corrective structure, potentially a flat pattern that began in early 2025
Current Position: The stock price is currently situated near the upper boundary of a long-term ascending channel, which was broken out in 202,3 and the price has retested the upper channel and respected the same until now. Prices are attempting to find a solid base after a substantial decline from recent highs.
Correction Phase: The price action since early 2025 has been widely characterised by analysts as a corrective phase (Wave 4), unfolding as an expanded flat correction or similar structure.
Long-Term Trendline: The current price action is near a critical long-term trendline/demand zone. A potential fall below this area could signal a more significant technical breakdown towards lower support levels and bring the price back into the ascending channel, possibly around $27 -$23 or even $9 to the base of the channel.
Fibonacci Support and Targets
Strong Fibonacci and accumulated volume support in the current price vicinity, which may act as a launchpad for the next move up if the long-term trend holds.
Targeting the First Hurdle ($47 range): Based on Fibonacci extension/retracement levels, the first major technical hurdle or target for an upside move is identified around the $47 to $48 range.
A break and hold above the immediate resistance levels (e.g., $30.00, then $35.86) would be required to build momentum toward the $47 target.
SMCIs' earnings and commentary will probably be the decider of the next move.  Long
Long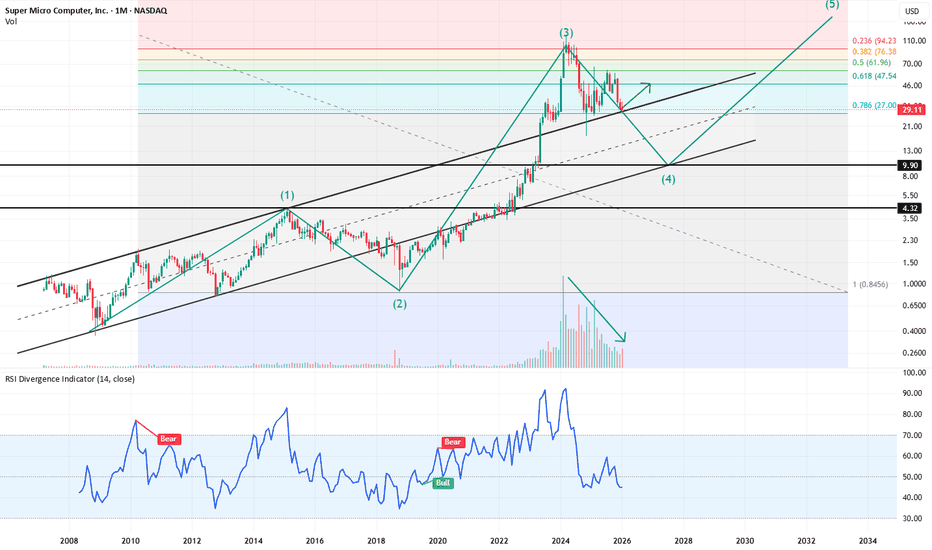
 Long
Long
 Long
Long
 Long
Long
 Long
Long
ANET | No Fireworks, Just Higher Prices to 178 target📡 Arista Networks, Inc. (ANET)
Calm Pullback, Serious Business | Bullish Continuation Setup
🧠 Let’s be honest…
Not every stock needs fireworks to make money.
Some just do the work quietly — and ANET is one of them.
After a healthy reset, Arista is back above key value and VWAP, telling us something simple but important: big money didn’t leave — it waited.
📊 What the Chart Is Saying (No Drama)
✔ Higher-timeframe uptrend still intact
✔ Pullback respected demand (no panic selling)
✔ VWAP reclaimed → acceptance, not rejection
✔ Overhead supply mostly chewed through
Translation: This is digestion, not distribution.
🎯 Trade Plan (Clean & Disciplined)
🟢 Buy Zone
$138 – $145
Where value lives, risk is defined, and emotions stay out.
🎯 Upside Targets
Target 1: $165
Target 2: $178
Stretch Target: $195 (if momentum keeps its foot on the gas)
🔴 Stop Loss
Below $128 (daily close)
If it breaks demand, we walk away — no hero trades.
⚖️ Risk–Reward Snapshot
Risk: ~8–9%
Upside potential: 20–28%
High-confidence upside: 10–14%
Not flashy. Just efficient.
🏢 Company Profile (Why Institutions Care)
Arista Networks builds high-performance networking gear that keeps modern data centers running at scale.
🧩 Core Products
Cloud networking switches
High-speed Ethernet platforms
EOS (software-driven network OS)
🤝 Customers
Hyperscale cloud providers
AI & data-center operators
Large enterprises moving serious data
If AI is the brain, ANET is part of the nervous system.
💼 Business Model in One Line
High-margin hardware + sticky software + exploding data demand
= repeat customers with deep pockets
No gimmicks. No hype cycles. Just infrastructure that has to work.
🧭 Final Take
ANET doesn’t need to scream to move higher.
As long as price holds above the $128–130 demand zone, the path of least resistance remains up. Pullbacks are opportunities, not warnings.  Long
Long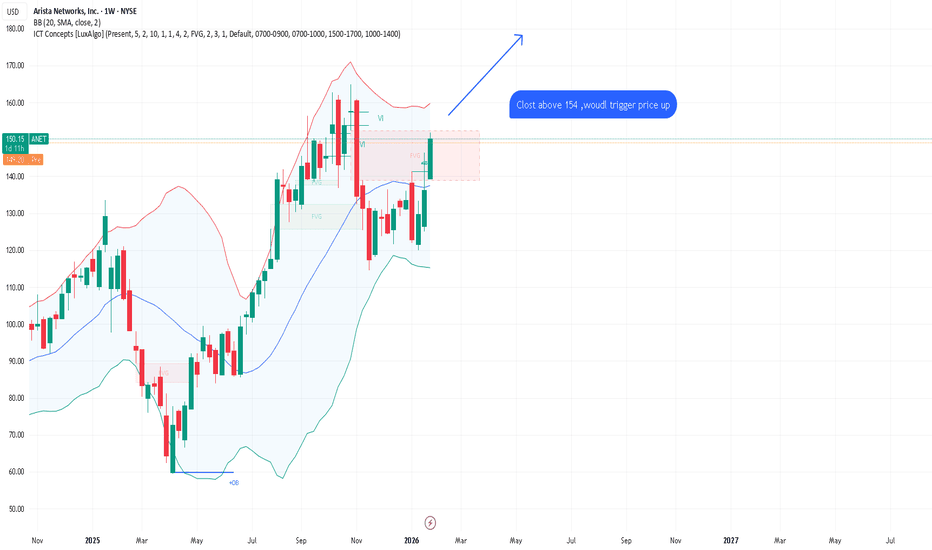
 Long
Long
 Long
Long
Fiscal Policy Risk and Its Impact on Debt Markets1. Understanding Fiscal Policy Risk
Fiscal policy risk refers to the uncertainty that arises from government budgetary actions, particularly when those actions impact the broader economy and financial markets. It is associated with the possibility that fiscal decisions—such as changes in tax rates, spending programs, or public debt issuance—may have unintended consequences on economic stability, inflation, and investor confidence.
Key elements of fiscal policy risk include:
Budget Deficits and Surpluses: When a government spends more than it collects in revenue, it runs a budget deficit, often financed through borrowing. Persistent deficits can raise concerns about fiscal sustainability, potentially leading to higher interest rates on government bonds. Conversely, surpluses may reduce borrowing needs, positively impacting debt markets.
Public Debt Levels: High levels of government debt relative to GDP can create risk perceptions among investors. Large debt stocks increase the likelihood of fiscal stress, which can lead to credit rating downgrades, rising borrowing costs, and lower demand for sovereign bonds.
Policy Uncertainty: Uncertainty about future fiscal measures—such as potential tax hikes, spending cuts, or structural reforms—can deter investment and destabilize markets. Unclear or inconsistent policy can increase volatility in debt markets.
Structural Imbalances: Fiscal policies that fail to address structural economic weaknesses, such as inefficient subsidies, high social welfare spending, or poorly targeted tax systems, can amplify risks over time. Markets often respond to these imbalances by demanding higher yields on government securities.
2. Debt Markets: An Overview
Debt markets, also known as bond markets, are platforms where governments, corporations, and financial institutions issue debt securities to raise capital. These markets are critical for economic functioning, as they provide governments with financing for infrastructure, social programs, and other initiatives.
Key components of debt markets include:
Government Bonds: Issued by central governments to fund deficits and manage liquidity. They are generally considered low-risk investments, particularly in stable economies.
Corporate Bonds: Issued by corporations to finance expansion, operations, or refinancing existing debt. Risk levels vary based on the issuer’s creditworthiness.
Municipal Bonds: Issued by local governments to fund public projects. Risk is influenced by the local government's financial health.
Sovereign Debt in Emerging Markets: Often carries higher risk due to political instability, currency fluctuations, and weaker fiscal frameworks.
Interest rates, inflation expectations, credit ratings, and global capital flows heavily influence debt markets. Fiscal policy plays a crucial role in shaping all these factors.
3. Interaction Between Fiscal Policy and Debt Markets
The relationship between fiscal policy and debt markets is complex and multidimensional. Changes in fiscal policy directly affect the supply of government debt, investor perceptions of risk, and the overall interest rate environment.
Impact on Interest Rates:
When governments increase borrowing to finance deficits, the supply of bonds in the market rises. If demand does not keep pace, bond prices fall, and yields rise.
Conversely, a reduction in borrowing or fiscal consolidation can lower interest rates by reducing supply pressures.
Influence on Inflation Expectations:
Expansionary fiscal policy, characterized by high spending or tax cuts, can stimulate economic growth but may also lead to higher inflation if the economy is near full capacity.
Higher expected inflation erodes the real returns on fixed-income securities, prompting investors to demand higher yields.
Tight fiscal policies, on the other hand, may ease inflationary pressures, stabilizing bond markets.
Credit Ratings and Market Perception:
Credit rating agencies evaluate a country’s fiscal position, including debt-to-GDP ratios, budget deficits, and debt servicing capacity.
A deteriorating fiscal position can lead to downgrades, increasing borrowing costs and reducing demand for government bonds.
Investors closely monitor fiscal sustainability as a measure of default risk.
Crowding Out Effect:
Large-scale government borrowing can absorb financial resources that might otherwise flow into private investment.
This “crowding out” can push up interest rates in broader debt markets, affecting corporate financing costs.
Market Volatility and Investor Confidence:
Sudden or unexpected fiscal measures, such as emergency spending or tax reforms, can create uncertainty and volatility in debt markets.
Transparent and credible fiscal policy frameworks tend to reduce risk premiums demanded by investors.
4. Types of Fiscal Policy Risk Affecting Debt Markets
Sovereign Risk:
This is the risk that a government may default on its debt obligations.
High debt levels, fiscal mismanagement, and political instability increase sovereign risk, leading to higher yields and lower bond prices.
Inflation Risk:
Expansionary fiscal policy can fuel inflation, which erodes the purchasing power of fixed-income returns.
Inflation-indexed bonds or higher yields often compensate investors for this risk.
Interest Rate Risk:
Fiscal deficits often prompt central banks to adjust monetary policy to control inflation, indirectly influencing interest rates.
Rising interest rates reduce the value of existing bonds, especially long-duration securities.
Liquidity Risk:
Fiscal uncertainty can make government bonds less liquid, especially in emerging markets where investor confidence is fragile.
Political and Policy Risk:
Policy changes stemming from elections, regime shifts, or coalition governments can introduce unpredictability.
Investors often demand a premium for exposure to countries with unstable fiscal policy environments.
5. Managing Fiscal Policy Risk in Debt Markets
Governments and investors adopt several strategies to mitigate fiscal policy risks:
For Governments:
Maintaining sustainable debt levels relative to GDP.
Implementing credible fiscal rules, such as limits on deficits or debt growth.
Enhancing transparency in budget formulation and debt management.
Using debt instruments with staggered maturities to manage refinancing risks.
For Investors:
Diversifying portfolios across countries and asset classes.
Monitoring fiscal indicators like debt-to-GDP ratios, budget deficits, and contingent liabilities.
Hedging interest rate and currency risks using derivatives.
Investing in inflation-protected securities to offset potential erosion in returns.
6. Global Perspectives and Recent Trends
In the wake of crises such as the COVID-19 pandemic, fiscal policy has become even more central to debt market dynamics. Governments around the world increased spending dramatically, leading to elevated deficits and debt levels. This expansionary fiscal stance caused varying responses in debt markets:
In developed markets, strong institutions and high investor confidence kept borrowing costs relatively low despite rising debt.
In emerging markets, increased borrowing and fiscal imbalances often resulted in higher yields and capital outflows, reflecting heightened fiscal policy risk.
Additionally, global investors now closely monitor sovereign fiscal health as part of risk assessment for emerging markets. Ratings agencies, economic think tanks, and international organizations provide guidance on fiscal sustainability, directly influencing capital flows into debt markets.
7. Conclusion
Fiscal policy risk is a critical determinant of debt market performance. Government decisions regarding spending, taxation, and borrowing influence interest rates, inflation expectations, and investor confidence. For debt markets, both in developed and emerging economies, fiscal sustainability, transparency, and credibility are essential for stable bond yields and efficient capital allocation.
Understanding fiscal policy risk requires analyzing macroeconomic indicators, debt levels, political dynamics, and global economic trends. Investors must remain vigilant to fiscal developments, while governments must manage policy choices carefully to avoid adverse market reactions. Ultimately, the interplay between fiscal policy and debt markets underscores the delicate balance between economic growth objectives and financial stability.  Education
Deglobalization & Supply Chain Shifts: A Comprehensive AnalysisUnderstanding Deglobalization
Deglobalization refers to the reduction in global interdependence in trade, finance, and production. Unlike globalization, which emphasizes interconnectedness and the free flow of goods, services, and capital, deglobalization involves a partial reversal of these processes. It does not imply complete isolation but reflects regionalization, reshoring, and diversification of supply chains to reduce vulnerability to global shocks.
Key drivers of deglobalization include:
Geopolitical Tensions: Conflicts between major powers, such as the U.S.-China rivalry, have introduced tariffs, sanctions, and restrictions on technology and trade. Companies are forced to rethink reliance on politically sensitive regions. For instance, semiconductor supply chains have seen significant reshaping due to export restrictions on advanced chips.
Pandemic Disruptions: The COVID-19 pandemic exposed vulnerabilities in global supply chains. Lockdowns, port closures, and labor shortages highlighted the risks of concentrated production in a few regions. Companies realized that efficiency-focused supply chains could be fragile, leading to a shift toward resilience and risk mitigation.
Rising Protectionism: Nationalist and protectionist policies, including tariffs and local content requirements, have incentivized companies to reduce dependence on foreign suppliers. Governments are increasingly promoting self-sufficiency in critical sectors such as energy, defense, and healthcare.
Technological Shifts: Automation, AI, and advanced manufacturing techniques reduce the cost advantage of low-wage countries. Companies can now consider reshoring production closer to end markets without sacrificing efficiency.
Implications for Global Supply Chains
Deglobalization has triggered major shifts in supply chain strategies, affecting sourcing, manufacturing, logistics, and risk management. These shifts can be categorized as follows:
1. Reshoring and Nearshoring
Reshoring involves bringing production back to the home country, while nearshoring shifts production to nearby countries within the same region. Companies are increasingly moving away from single-source suppliers in distant regions to reduce geopolitical and logistical risks.
Example: U.S. companies are increasingly sourcing electronics from Mexico or Southeast Asia instead of China.
Benefits include reduced transportation costs, shorter lead times, and better compliance with local regulations.
Challenges include higher labor costs and potential skill gaps in domestic manufacturing.
2. Diversification of Suppliers
Companies are no longer relying on a single country or supplier for critical components. Multi-sourcing strategies reduce the risk of disruption due to political conflicts, natural disasters, or pandemics.
Example: Automotive and electronics companies are diversifying chip suppliers across Taiwan, South Korea, the U.S., and Europe.
Diversification requires advanced supply chain analytics, forecasting, and relationship management to maintain efficiency.
3. Regional Supply Chains
There is a growing focus on regionalization, where companies develop supply chains within a geographic cluster. Regional trade agreements, such as the USMCA (United States-Mexico-Canada Agreement) and RCEP (Regional Comprehensive Economic Partnership in Asia), encourage localized production.
Regional supply chains reduce exposure to long-distance shipping risks, tariffs, and currency fluctuations.
They also promote sustainability by reducing carbon emissions associated with global logistics.
4. Increased Inventory and Buffer Stocks
Just-in-time (JIT) manufacturing, a hallmark of globalization, is being reconsidered. Companies are maintaining higher inventories and safety stocks to withstand supply disruptions.
This shift increases costs but ensures supply chain resilience.
Key industries adopting this approach include pharmaceuticals, semiconductors, and critical machinery.
5. Investment in Digital Supply Chains
Digitalization plays a central role in adapting to deglobalization. Advanced data analytics, AI, IoT, and blockchain enable companies to monitor global supply chain risks in real-time.
Example: Predictive analytics help firms anticipate disruptions, adjust production schedules, and optimize logistics.
Blockchain enhances traceability, crucial for compliance with new local content laws and sustainability regulations.
Sectoral Impacts
Deglobalization affects industries differently:
Technology and Electronics: Heavily dependent on global supply chains, these sectors are relocating production to secure chip manufacturing and critical components. The U.S. CHIPS Act incentivizes domestic semiconductor production.
Automotive Industry: Global auto manufacturing has been disrupted by semiconductor shortages. Companies are regionalizing production and investing in EV battery manufacturing closer to end markets.
Pharmaceuticals: COVID-19 highlighted dependence on China and India for APIs (Active Pharmaceutical Ingredients). Many countries are now investing in local production to ensure health security.
Consumer Goods: Companies are diversifying suppliers to avoid disruptions in goods such as clothing, electronics, and household products.
Economic and Strategic Implications
Deglobalization has wide-ranging consequences:
Higher Production Costs: Shifting production closer to home or diversifying suppliers increases labor, logistics, and compliance costs. This could result in higher consumer prices.
Supply Chain Resilience: Companies are willing to trade efficiency for reliability. Resilient supply chains are less prone to disruption from geopolitical or environmental events.
Shift in Trade Patterns: Emerging markets that previously benefited from globalization may face slower growth as global production becomes more regionalized.
Innovation and Competitiveness: Nearshoring and reshoring may stimulate innovation in domestic manufacturing, robotics, and automation, boosting long-term competitiveness.
Policy and Regulatory Focus: Governments are actively shaping industrial policies to ensure national security and self-reliance. Strategic sectors such as energy, defense, and healthcare will see sustained support.
Challenges and Risks
While deglobalization promotes resilience, it is not without challenges:
Cost Inflation: Regionalization and reshoring are expensive, potentially squeezing profit margins.
Complex Supply Management: Managing multiple suppliers across regions increases operational complexity.
Trade Tensions: Fragmentation of global trade can lead to inefficiencies and reduced economies of scale.
Environmental Concerns: While regionalization reduces shipping emissions, increased local production may increase energy consumption if production relies on carbon-intensive processes.
Future Outlook
The trajectory of deglobalization suggests a hybrid model for global supply chains:
Selective Globalization: Companies will retain global networks for certain low-cost, non-critical products while regionalizing critical components.
Resilience as Priority: Supply chain decisions will prioritize risk mitigation over cost efficiency.
Technological Integration: AI, automation, and digital twins will transform supply chain management, enabling agility and rapid response to disruptions.
Policy-Driven Strategies: Trade policies, subsidies, and geopolitical pressures will continue to shape supply chain structures.
In essence, the future of global supply chains will be less about maximizing cost efficiency and more about building robustness and adaptability. Companies that successfully balance efficiency with resilience will gain a competitive edge in an increasingly unpredictable global landscape.
Conclusion
Deglobalization represents a paradigm shift in the global economy, driven by geopolitical risks, pandemics, protectionism, and technological evolution. The shift is fundamentally reshaping supply chains through reshoring, nearshoring, diversification, and digitalization. While these changes entail higher costs and operational complexities, they also provide an opportunity to build resilient, flexible, and strategically secure supply chains. The companies and nations that adapt effectively to these changes will navigate the challenges of the post-globalization era while ensuring long-term sustainability and competitiveness.  Education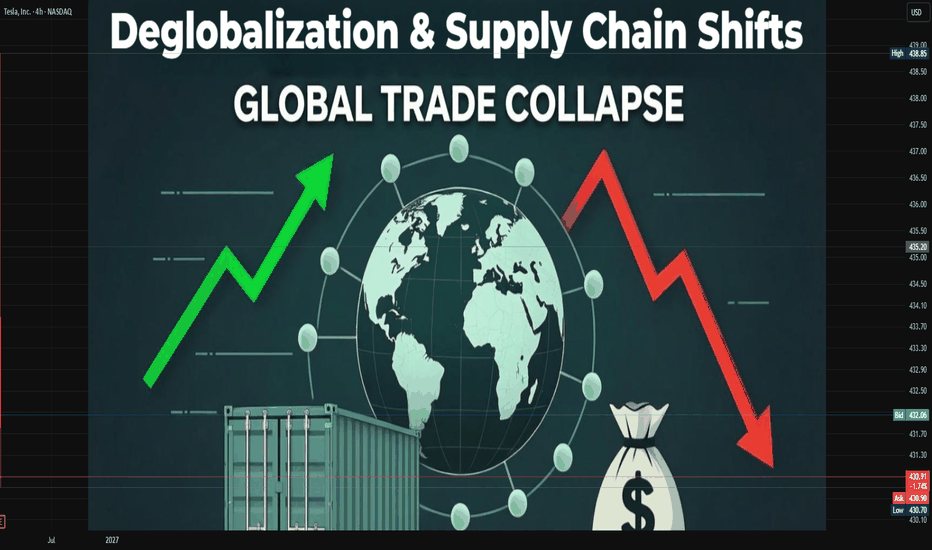
Zoom (ZM) Base Formation Meets ResistanceAfter a long period of weakness, ZM currently looks like a market in base-building mode, slowly working its way higher.
The structure is constructive, as price is forming higher lows, creating a rising foundation.
At the same time, price is now moving into a clear resistance zone around ~95–97, which is where progress or rejection will be decided.
Silent Flow identifies a new long signal, but the signal appears in a sensitive location, as it emerges directly below resistance.
A realistic bullish scenario would be: resistance test → controlled pullback (retest) → buyers step back in → another attempt higher.
A warning sign would be a pullback that becomes too aggressive and breaks the current upward structure (the most recent higher lows) in that case, the move was more of a push than a stable build.
The uncertainty is not about “bullish vs. bearish,” but about how the market reacts at this level: rejection with structure damage versus rejection with a clean retest.  Long
Long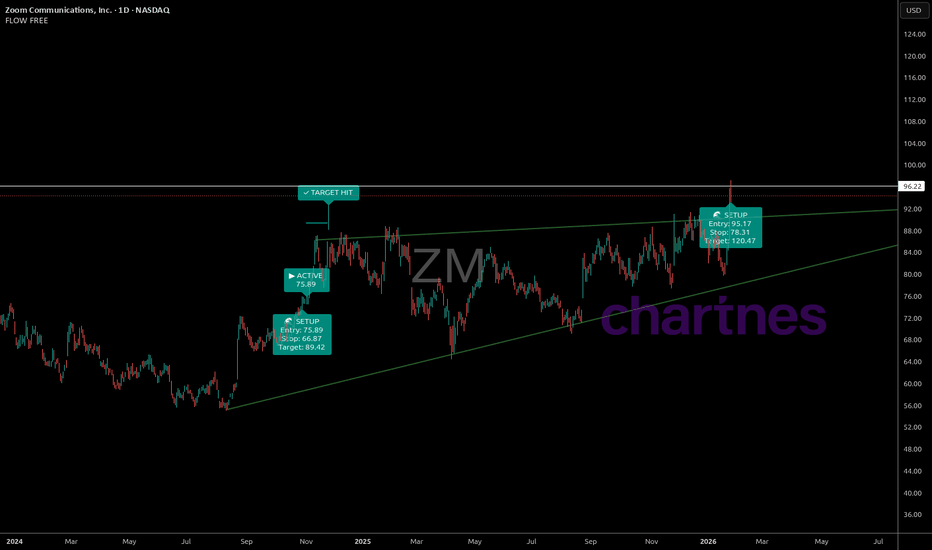
 Long
Long
$AG setting up for a rip your face off rally #tothemoonFirst Majestic is a hated stock as of now, it also has the largest short position in the entire silver miners listed in NYSE. Bad sentiments and frustrated investors is a great combination to identify when a sector bottoms.
Looking at the price action as of now, especially from $4.5 to $7.8 it looks like a strong bullish reversal. Also this is a institution move, smart money is buying silently. Also with silver heading to new highs, which means that silver miners are turning healthy. Many silver miners are making decent margins already around 15-20% OPM, the higher silver prices go the more Free Cash Flow will be generated which will directly impact bottom line. And, the valuations are dirt cheap.
Reasons why like like First Majestic :
- Acquired Gatos Silver recently, by this deal the net AISC improves, i feel it should be around $20-18. Before acquisition NYSE:AG AISC was $25, Gatos Silver being a low cost producer should now cumulatively bring the AISC down.
- They also announced a share repurchase program which is a positive.
- They are the only silver miner with a Mint capacity, First Mint Store. Unlike other mints, which are either government-owned or privately held. Good addition to capture the entire value chain.
Well at current valuation and where the silver price is at its hard for me to see the downside. So i may be biased. I will only exit this scrip if i see Silver go below $23. That is my exit criteria.
Disclaimer : This analysis is purely for education. As i am invested in this scrip I may be biased. Don't take this as an investment advice. Please consult your financial advisor before any speculative investments.  Long
Long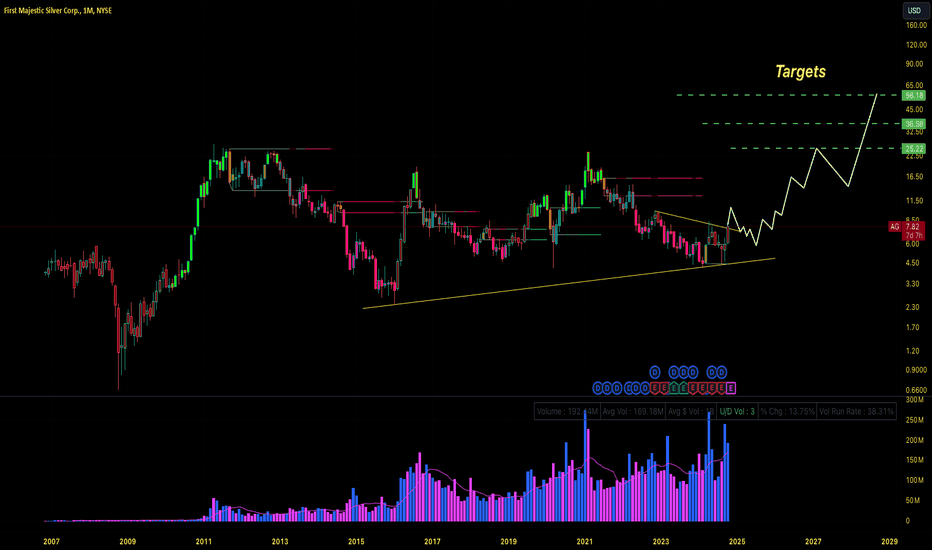
 Education