Trend reversal for Occidental Petroleum soon?
MACD is turning up for daily chart and weekly chart
Since March 2022 - Sept 2024, the price has been moving in this box range, if this time the price could be supported at the lowest point, the reversal of trend is expected
Fibonacci retracement for the long term trend was never more than 0.382 retracement and stay horizontal in the box range.
Support and resistant indicate with red and green lines at the right side
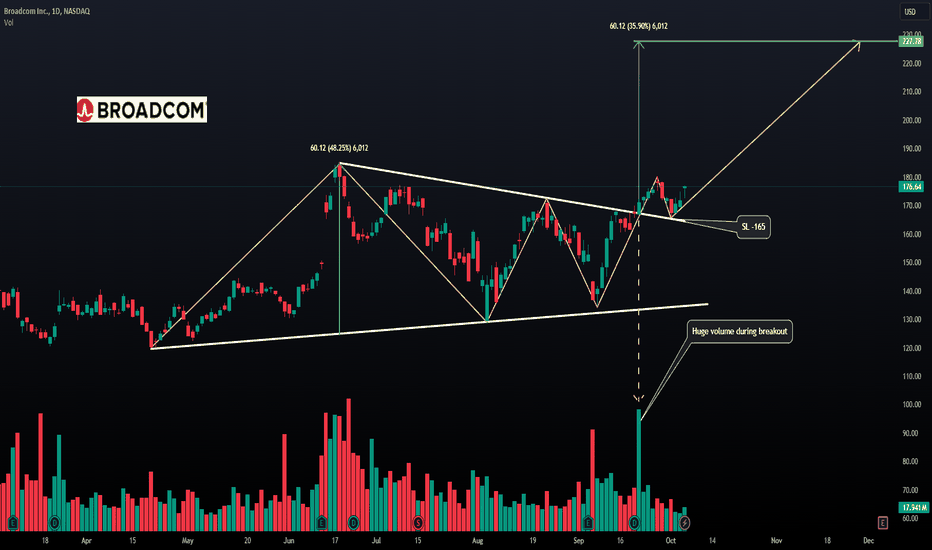
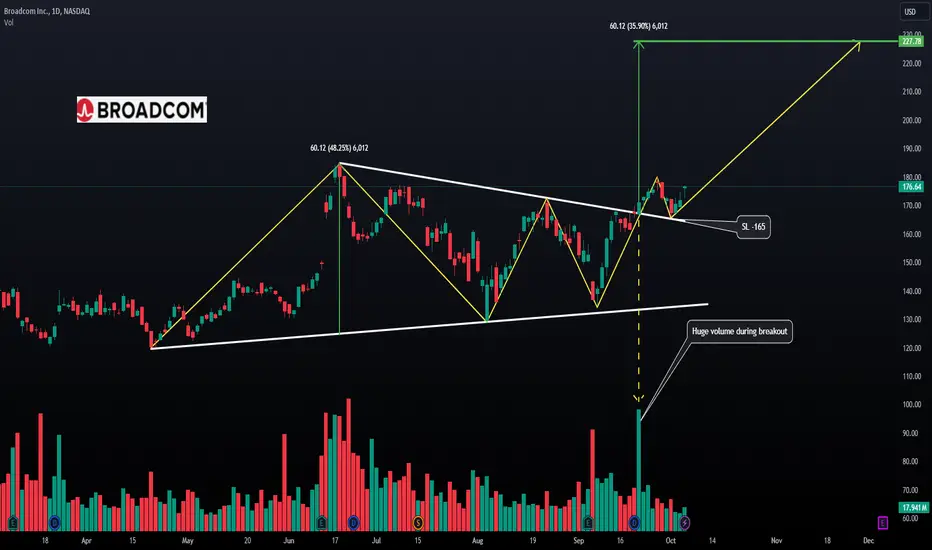
AVGO -Symmetrical triangle -Daily - Unusual volume **Broadcom Inc. (AVGO)** chart and presents a technical analysis of the stock on a daily timeframe.
Key highlights:
1. **Bullish Pattern**: The chart seems to show a series of bullish moves with higher highs and higher lows, which are connected by yellow lines. This pattern may be interpreted as an symmetrical triangle, a bullish continuation pattern.
2. **Breakout**: A breakout is indicated on the right side of the chart, which seems to have occurred on **high volume**, further supporting the bullish momentum.
Retested the breakout trendline and bounced.
3. **Measured Move Projection**: The breakout projection indicates a potential price target of **$227.78**, which is calculated from the height of the triangle (about $60.12 from the low). This is approximately **48.25%** higher than the start of the upward move.
4. **Stop-Loss (SL)**: A stop-loss level is mentioned around **$165**, to manage risk in case the breakout fails.
5. **Volume**: A significant increase in volume is noted at the breakout, which adds confidence to the strength of the move.
### Potential Scenario:
- If the breakout holds, the target of **$227.78** could be achieved in the next rally.
- However, a pullback or consolidation near **$165** could be possible before the price moves higher.
META - Cup and Handle - Daily - LongThis chart appears to be for Meta Platforms, Inc. (META) and features a technical analysis of the stock price movement on the daily timeframe.
Key components:
1. **Cup and Handle Pattern**: A bullish technical pattern is formed in the chart, indicating potential continuation of the uptrend. The "cup" is the rounded bottom, and the "handle" forms a consolidation before the breakout.
2. **Breakout**: The stock seems to have broken out of the handle's resistance zone, pushing higher, which confirms the bullish breakout.
3. **Price Targets**: Price targets are marked above the breakout:
- One at $638.55, which could be the result of projecting the height of the cup from the breakout level.
4. **RSI Indicator (Relative Strength Index)**: The RSI is around 79.40, showing the stock is in overbought territory, which could mean some consolidation or pullback before the next move.
5. **Volume**: A notable volume spike occurred during the breakout, adding further confirmation to the bullish momentum.
This setup suggests continued bullish momentum, but overbought conditions on the RSI might lead to short-term corrections.
QD // level // 1d (QD), here's a general approach:
Support Levels
Recent Lows: Identify the lowest price points in recent trading sessions. For instance, if QD recently dropped to around $1.50, that might serve as a support level.
Moving Averages: The 50-day or 200-day moving averages can act as dynamic support. If the stock price approaches these averages, they might provide support.
Historical Support: Previous lows where the stock has bounced back can also indicate potential support levels.
Resistance Levels
Recent Highs: Determine the highest points in recent trading. For example, if the stock peaked at around $2.00, that could serve as a resistance level.
Trend Lines: Drawing trend lines across recent highs can help visualize resistance areas.
Psychological Levels: Round numbers like $1.75 or $2.00 often act as psychological resistance.
QLong
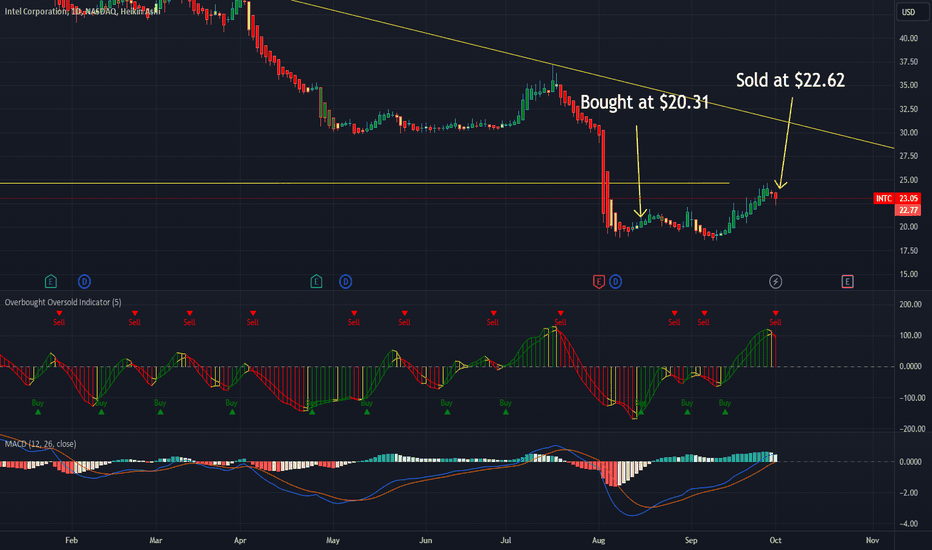
INTC Swing Complete.I wanted to test out some simple no-BS indicators on a swing trade. I ended up using the MACD cross and Overbought/Oversold indicators. I'd say it was pretty successful. The I had a support/resistance line (yellow) and would have been better off selling when it crept near that $24 area. That being said, it's important to read candles and formations for reversals etc. Using purely the indicators I'd say the trade was successful. I didn't have a bunch of money invested (for obvious reasons), but I still gained something like 8.4% of my original investment. So not bad. Hope this helps someone. NOTE: I plan to re-enter a position once a buy signal is posted. I think Intel is due for some more upside soon.
Not trading advice.
TSLA: Ready for a Space Trip?As per chart action we all can see that TSLA is now heading upwards journey.
with TSLA now, umbrella company SPACEX is also doing good in its segment and TSLA is getting better opportunity to do manufacturing and enter in developing countries like india etc.
Also with Giga Factory expansion and making New Tesla cell technology
with that they can use that technology to take advantege in their new products also.
With current price(260) with target of new high (around 420-440) and with SL of 140.
It does not constitute and cannot replace investment advice. We therefore recommend that you contact your personal financial advisor before carrying out specific transactions and investments.
For Tesla Inc. (TSLA) on a daily timeframe"Welcome to SkyTradingZone "
Hello Everyone 👋
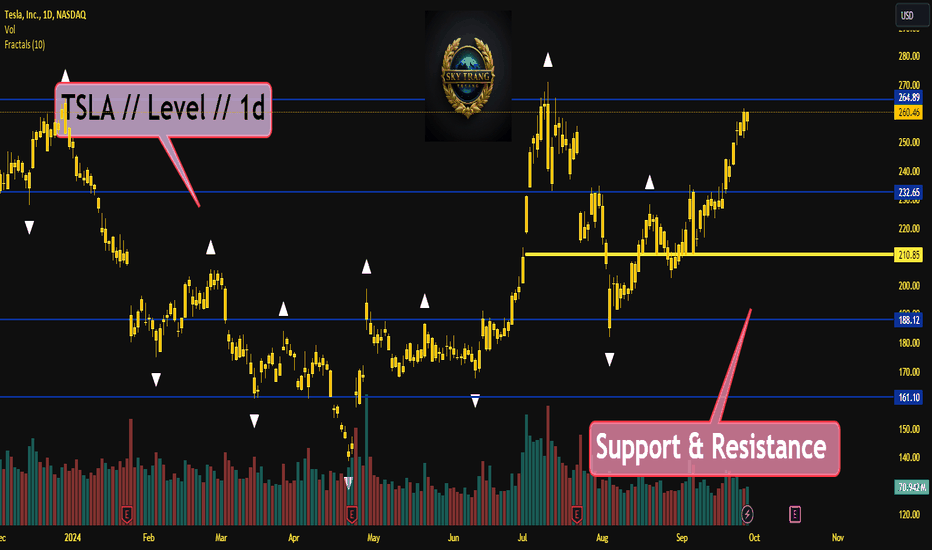
For Tesla Inc. (TSLA) on a daily timeframe, here are the key support and resistance levels:
Support Levels:
First Support (S1): Around $220.67
Second Support (S2): Around $221.98
Resistance Levels:
First Resistance (R1): Around $265.90
Second Resistance (R2): Around $239.30
Any idea where it is headed?KO (coca-cola) looks in wave 5 of its primary degree. We have concluded wave 4 near $ 21 in Apr 2009.
Now the wave 5th is in progression, lets see whether it follow the sequence.
The information provided in this analysis is for informational purposes only and should not be construed as financial advice or a recommendation to buy or sell any securities. Past performance is not indicative of future results. Investing involves risk, and there is no guarantee that any investment strategy will be successful.
It is strongly recommended that you consult with a qualified financial advisor before making any investment decisions.
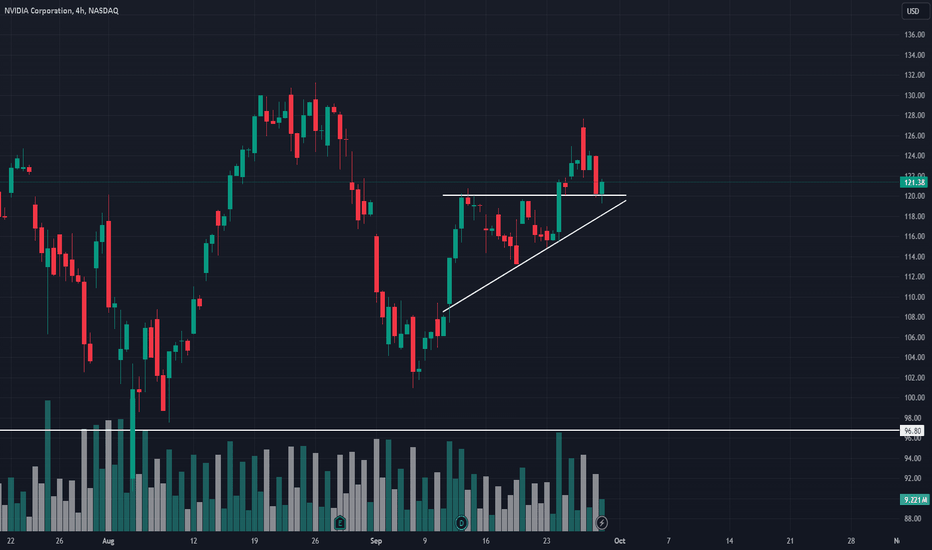
NVIDIA BREAKOUT RETEST AND READY TO GOImagine a symmetrical triangle forming on a stock chart. The price breaks out above the upper trendline, indicating a bullish breakout. Instead of entering immediately, you wait for the price to pull back and retest the broken trendline. Once the price holds above this level, you enter a long position, setting your stop-loss just below the retest level and your take-profit based on the triangle’s height.
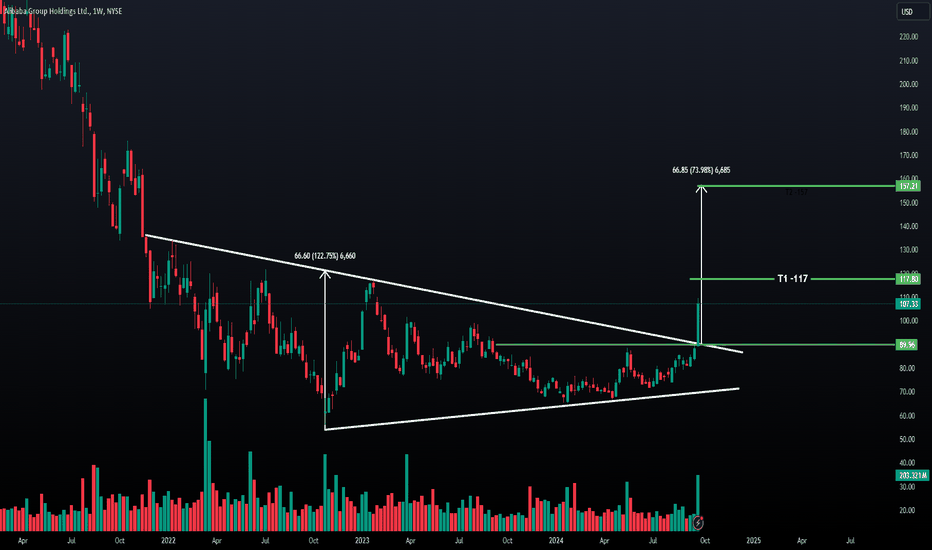
BABA - Symmetrical triangle breakout -Daily - LongThe pattern in the Alibaba (BABA) chart looks like a symmetrical triangle breakout, not a descending wedge. Here's how it aligns:
Symmetrical Triangle: This pattern consists of converging trendlines, where both the highs and lows are moving towards a point, forming a triangle. It typically indicates a period of consolidation before the price breaks out, either upward or downward.
Breakout: In this case, the price has broken out upwards from the symmetrical triangle, which is often a bullish signal when seen in an uptrend or after a prolonged period of price consolidation.
Measured Move: The target price is calculated by measuring the height of the triangle and adding it to the breakout point. This gives a potential target around $157.21 as marked on the chart.
Volume Confirmation: The breakout is supported by a surge in trading volume, which helps validate the breakout's strength.
In summary, the symmetrical triangle breakout suggests a continuation of the bullish momentum, with key targets around $117 (first target) and $157 (second target).
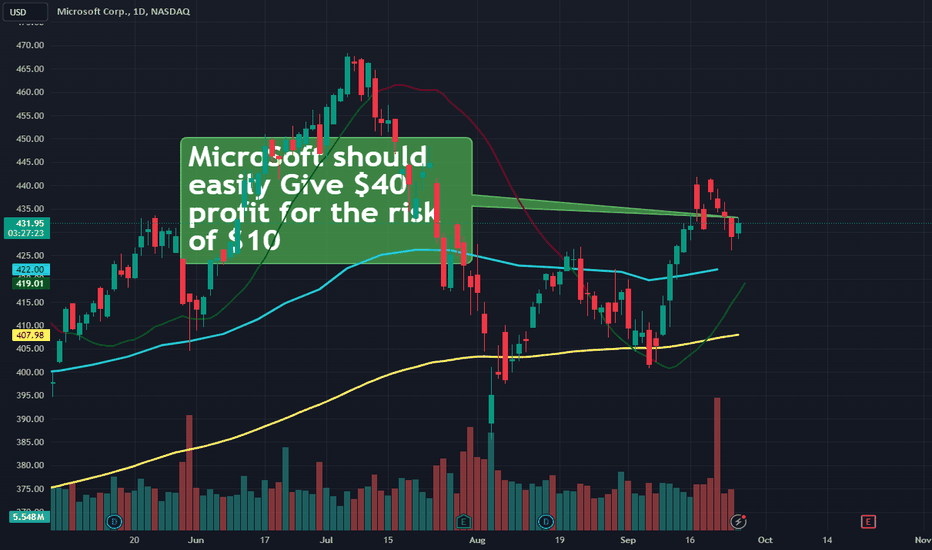
Microsoft (MSFT) Trade Setup: Swing TradeCurrent Price: $431.97
Risk-Reward Setup: Risk $10 to potentially gain $40.
Entry Point:
The price is currently hovering at $431.97. This level seems to be consolidating after a recent upward move, likely providing a decent entry point if the market remains bullish.
Stop Loss:
Stop Loss Set at: $422
This is a $10 risk from the current price. Strategically place it below the current support zone (around $422), where a key moving average or recent price low may provide support. If the price breaks below, it signifies a bearish signal and triggers the exit.
Target Profit:
Target: $471
With a $40 upside target, this aligns with the next key resistance level. Given the current bullish momentum and based on the volume, reaching this level is feasible if the uptrend
continues.
Risk-Reward Ratio:
Ratio: 4:1 (For every $1 risked, you're targeting $4 in profit).
This is a solid ratio, especially for swing trades or medium-term holds.
NOTE : The setup looks promising for a swing trade with a high probability of success if the market sentiment remains positive. As always, ensure to monitor for any sudden market shifts or macroeconomic events that could affect the overall trend.
QLYS First look, Sept 2024One of the post on Baystreet.
Good financials
Ebita increasing
Maring increasing
shates outstanding decreasing
Was 124.40 on sept 22, 2024
Things look good but this is clearly in downtrend. Need a news? recession coming? companies may not want to expand their cyber security budget?