• Products
  • Community
  • Markets
  • Brokers
  • More
Get started
  • Markets
  • /USA
  • /Stocks
  • /Ideas
LUV : Closed the position at different levelsAlthough I initially entered with a single position comprising about 2.5% of the net capital, I had to book it in two separate levels. I closed half of the position at around breakeven levels and the remaining half for a profit of about 22.47% of the remaining invested capital. The looming recession worries and the potential global slowdown of economies don't give me much confidence to hold onto a stock, especially in the airline sector, which is one of the sectors that will be most affected if a recession kicks in. I'll contemplate re-entry if the price crashes to the low of the anticipated parallel channel, which I expect to form, after evaluating the macro and microeconomics at that time. Feel free to follow me for updates on my positions and market insights. Additionally, I welcome your feedback and opinions in the comments section below this post. Other posts related to this particular position and scrip, if any, will be attached underneath. Do check those out too. Disclaimer: The analysis shared here is for informational purposes only and should not be considered as financial advice. Trading in all markets carries inherent risks, and past performance is not indicative of future results. It's essential to conduct your own research and assess your risk tolerance before making any investment decisions. The views expressed in this analysis are solely mine. It's important to note that I am not a SEBI registered analyst, so the analysis provided does not constitute formal investment advice under SEBI regulations.
NYSE:LUVShort
by Sniper-Traders
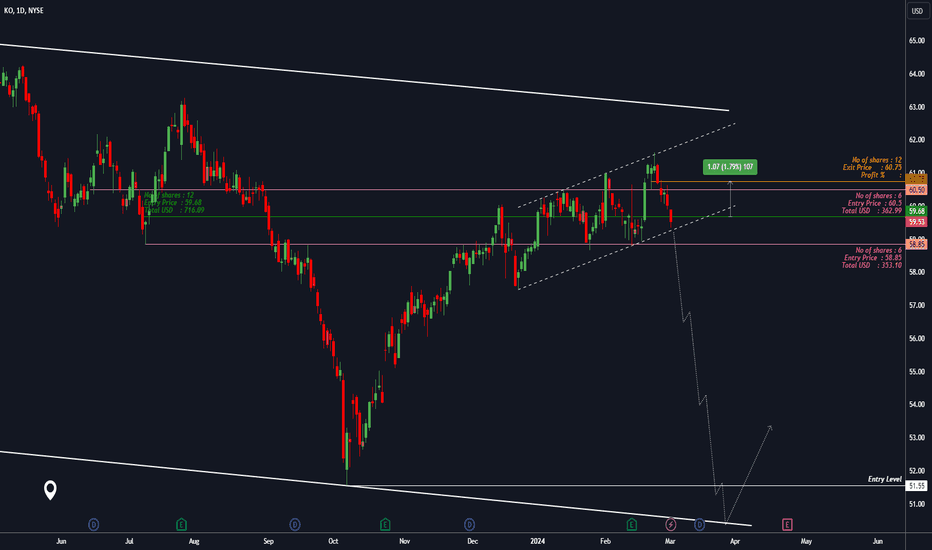
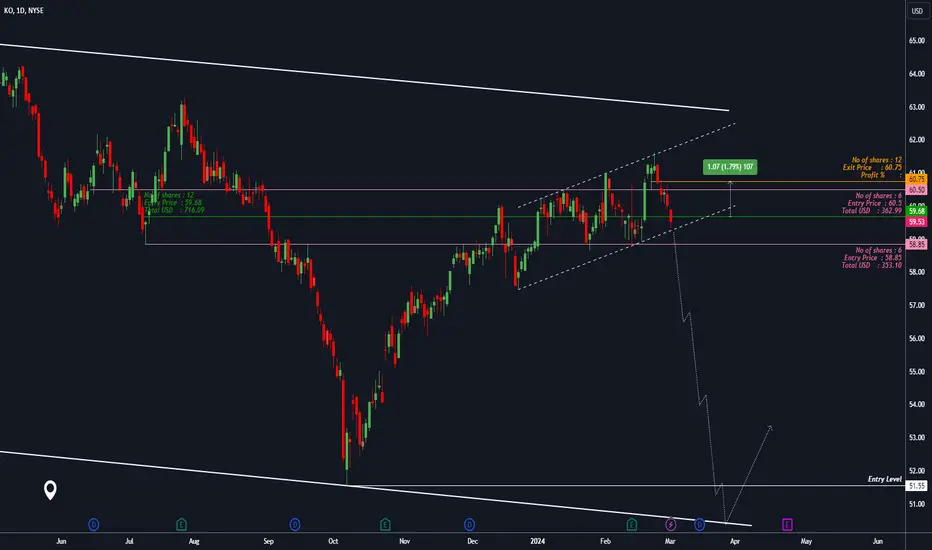
KO : Closed position at around breakevenClosed the position for a profit of about 1.79% on the invested capital. However, I consider this trade only as a breakeven trade. I took the initial entry when it was technically undervalued. However, later, the market shifted into bear mode and the pattern evolved. I added to the position, increasing the total holding to about 2.5% of the net capital, my maximum allocation for a particular stock. Currently, the average price level does not inspire confidence to hold onto the stock. Thus, I decided to book profits and take the chips off the table. The upcoming recession worries and the overvaluation of the overall US market further confirm that this is the right move to protect capital. The price did crash after I booked profits. I will consider re-entry only if the price returns to the low of the HTF parallel channel. Feel free to follow me for updates on my positions and market insights. Additionally, I welcome your feedback and opinions in the comments section below this post. Other posts related to this particular position and scrip, if any, will be attached underneath. Do check those out too. Disclaimer: The analysis shared here is for informational purposes only and should not be considered as financial advice. Trading in all markets carries inherent risks, and past performance is not indicative of future results. It's essential to conduct your own research and assess your risk tolerance before making any investment decisions. The views expressed in this analysis are solely mine. It's important to note that I am not a SEBI registered analyst, so the analysis provided does not constitute formal investment advice under SEBI regulations.
NYSE:KOShort
by Sniper-Traders
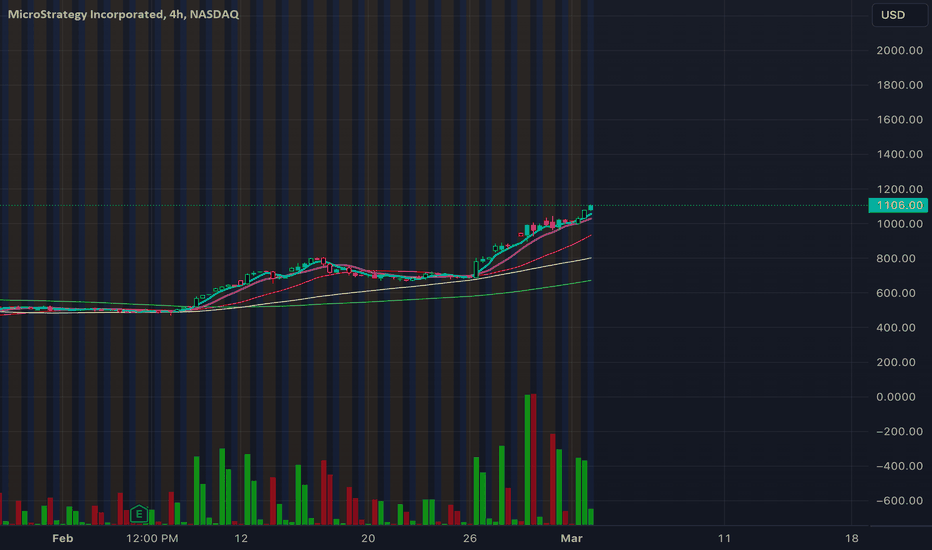
MSTR to $1,200 i thinkI believe next stop for MSTR based on momentum data is $1,200. NFA just an opinion to watch
NASDAQ:MSTRLong
by sully357
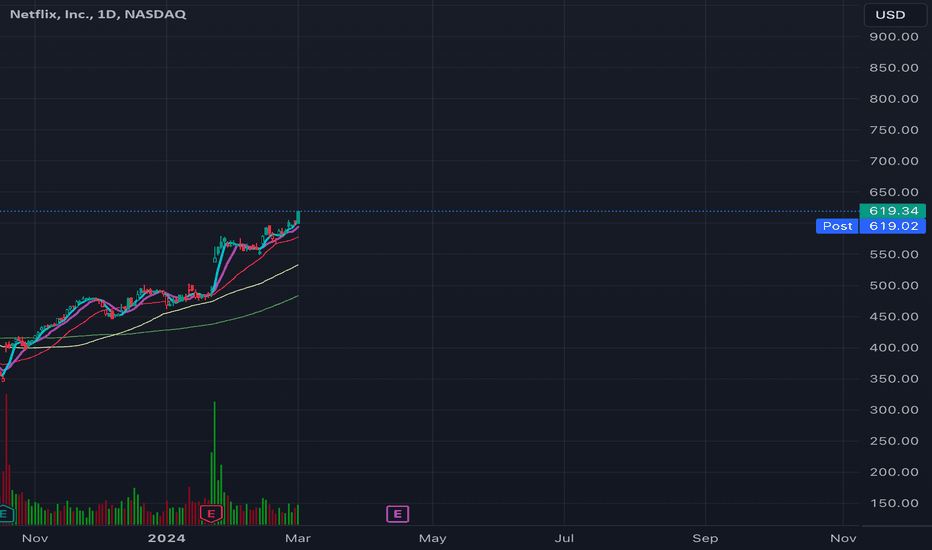
NFLX to 700/800NFLX is looking good and steady. All the other big names have been making all-time highs, why wouldn't NFLX? NOT ADVICE OR RECOMMENDATION
NASDAQ:NFLXLong
by sully357
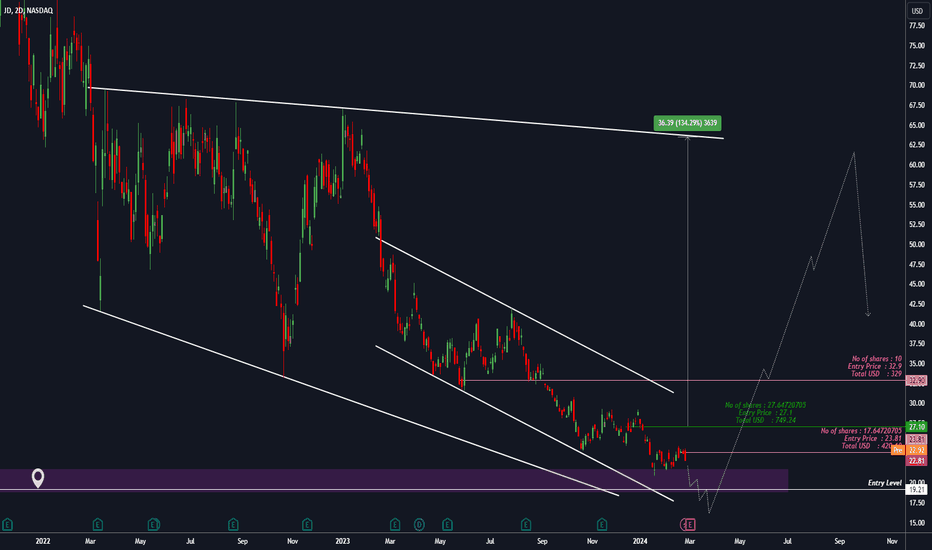
JD : Going LongFundamentals Pros: Strong Growth Metrics: JD.com has demonstrated impressive growth in sales, earnings, and free cash flows over the past five years, indicating a robust and expanding business. Positive Trend in Returns on Capital: Despite only meeting the average returns on capital metric 44% of the time, JD.com has shown a positive trend in this aspect over the last five years, suggesting improving capital efficiency. Stable Dividend Yield: With a dividend yield of 26.3%, JD.com offers an attractive income opportunity for investors seeking dividends. Moreover, the dividend appears sustainable, supported by the company's strong free cash flow. Diversification and Innovation: JD.com has expanded its business beyond e-commerce into areas such as finance, healthcare, and technology, leveraging its extensive data and customer base to offer a range of services. This diversification enhances its revenue streams and strengthens its competitive position. Robust Balance Sheet: JD.com boasts a strong balance sheet with a significant cash pile of $236 billion and substantial free cash flow generation of $225 billion over the last five years. This provides financial flexibility for investments and expansion. Cons: Geopolitical Risks: Investing in Chinese companies like JD.com carries inherent geopolitical risks, including regulatory uncertainties and negative sentiment around the country's economy. This could impact the stock's performance and investor confidence. Debt Levels: Despite the strong balance sheet, JD.com's net debt exceeds the sum of its free cash flows. High debt levels could pose risks, especially in uncertain economic conditions or during periods of market volatility. Market Performance: JD.com's stock has declined by 55% since February 2023 and has trailed the market, indicating challenges and potential concerns among investors about its future growth prospects. Competition and Market Dynamics: JD.com faces intense competition in China's e-commerce market, particularly from rivals like Alibaba's Taobao and Tmall. Shifts in consumer preferences, market saturation, and regulatory changes could affect JD.com's market position and profitability. Macroeconomic Factors: Chinese e-commerce companies, including JD.com, have been affected by macroeconomic factors such as a sluggish economy and a consumer spending crisis. These external factors could impact JD.com's revenue growth and profitability in the short to medium term. Technicals The stock is heavily beaten down and is very close to its all-time low. So took two positions at different levels, summing up the total holding in the stock to about 2.5% of the net capital. From the net average price levels, there is a potential move of about 134% to the high of the channel where I'll consider booking profits. Feel free to follow me for updates on my positions and market insights. Additionally, I welcome your feedback and opinions in the comments section below this post. Other posts related to this particular position and scrip, if any, will be attached underneath. Do check those out too. Disclaimer: The analysis shared here is for informational purposes only and should not be considered as financial advice. Trading in all markets carries inherent risks, and past performance is not indicative of future results. It's essential to conduct your own research and assess your risk tolerance before making any investment decisions. The views expressed in this analysis are solely mine. It's important to note that I am not a SEBI registered analyst, so the analysis provided does not constitute formal investment advice under SEBI regulations.
NASDAQ:JDLong
by Sniper-Traders
22
Looking for LongTSLA formed descending channel which you can see on the left side of the chart which has been broken impulsively & forming a correction to make a move to the upside. Expecting target to reach at 425
NASDAQ:TSLALong
by sohaibfx
11
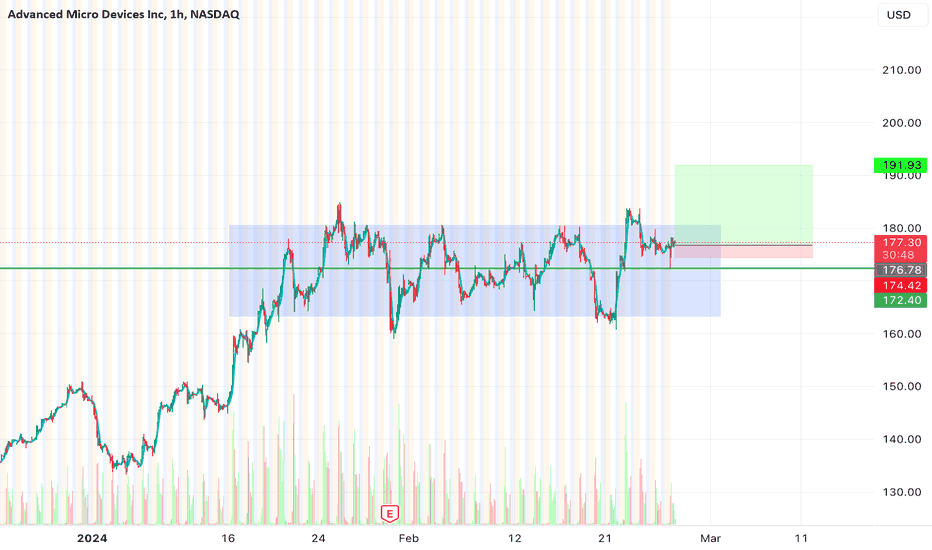
AMD to 185, then 200. NFAAMD is looking bullish. Good volume bottoms, a nice support retest in extended hours in preparation for markup. Looks like a good entry for calls. This isn't financial advice or recommendation. just an idea to share in words I like $200 and $210 strikes for April19th expiry the most. Will watch those NFA NASDAQ:AMD
NASDAQ:AMDLong
by sully357
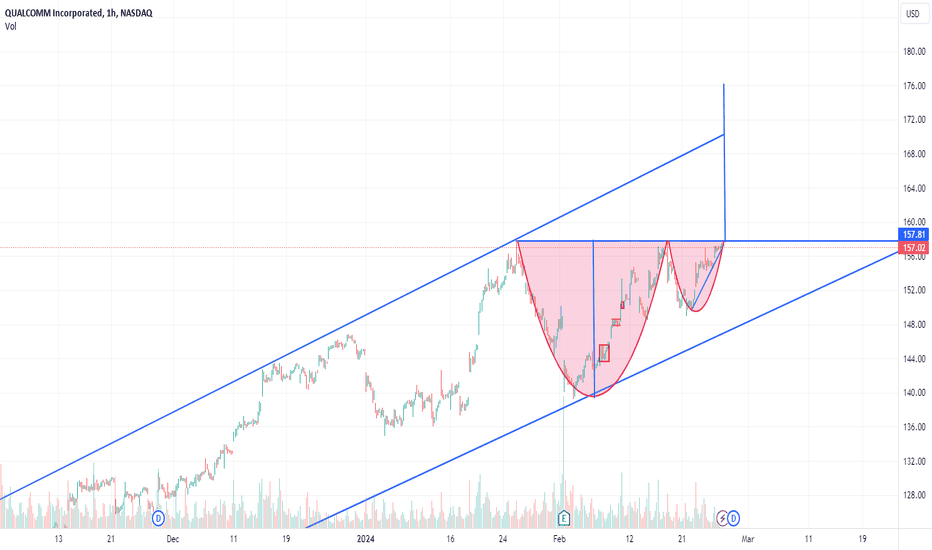
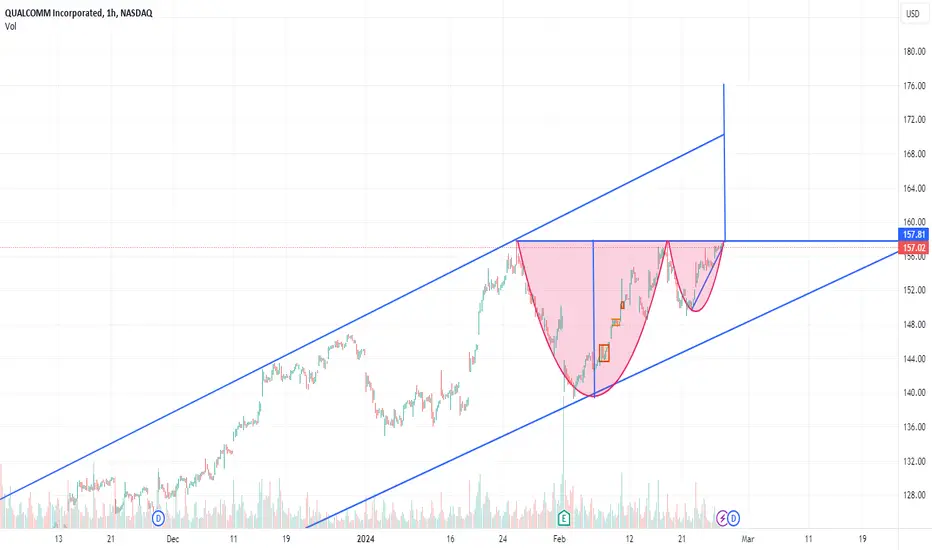
Qcom Cup with Handle,most profitable pattern,expecting 10% upQcom Cup with Handle,most profitable pattern,expecting 10% up
NASDAQ:QCOMLong
by Vinayteja_Boini
11
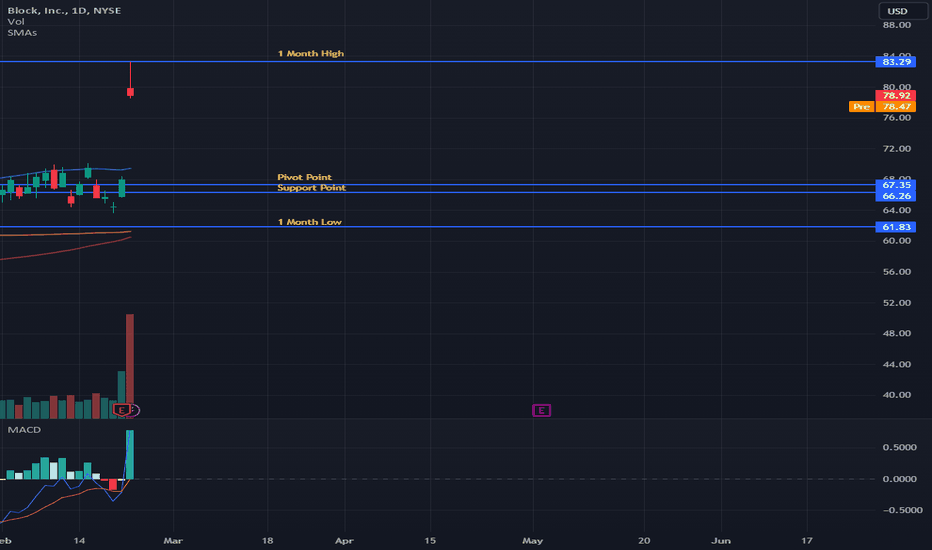
Technical Analysis of SQIt's a stock analysis using the technical data available for SQ, based on its last closing price of $78.92 on 23/02/2024.
NYSE:XYZLong
by abhijithgk
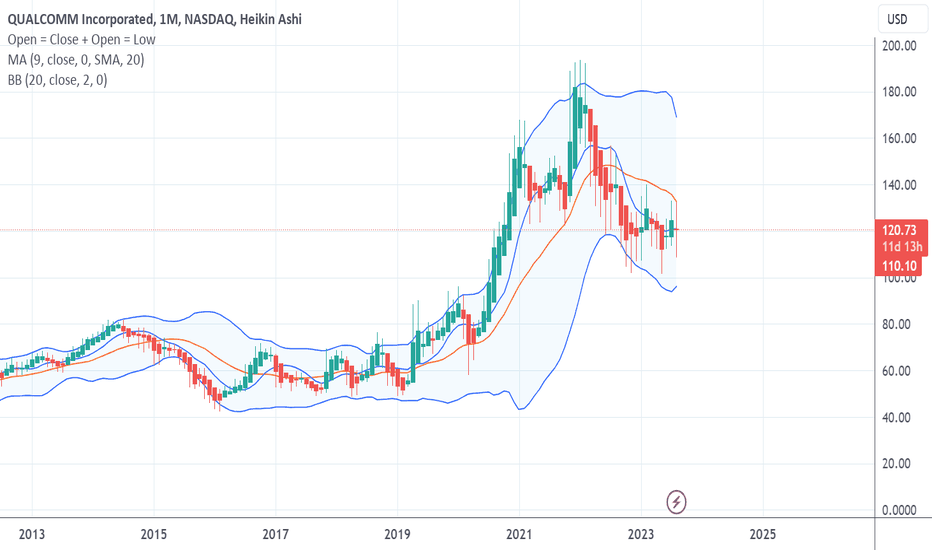
Long Term chart suggest a Potential buy for qualcommBased on the Technical Indicators , the stock is holding good levels and be invested in these level between 95 to 115 with a stoploss of 50.QC is leading manufacturer of 5G smart phone patents and chip makers and hold a commanding position in the chipset markets .Today PE of qualcomm stands as 11.74 X wheras industry PE is 28.X . Company seems to be undervalued at this point of time but suggests a good upside of 200 dollars in the coming years .Look at the chart indicators on all the time frames , the stock has made big dogi candle in last few months and after that bulls have taken the control . Betting big on these big giant companies on the upside.The views are completely personal and Please consult the finacial advisor before buying to this stock.
NASDAQ:QCOMLong
by rudraprasad389
Updated
11
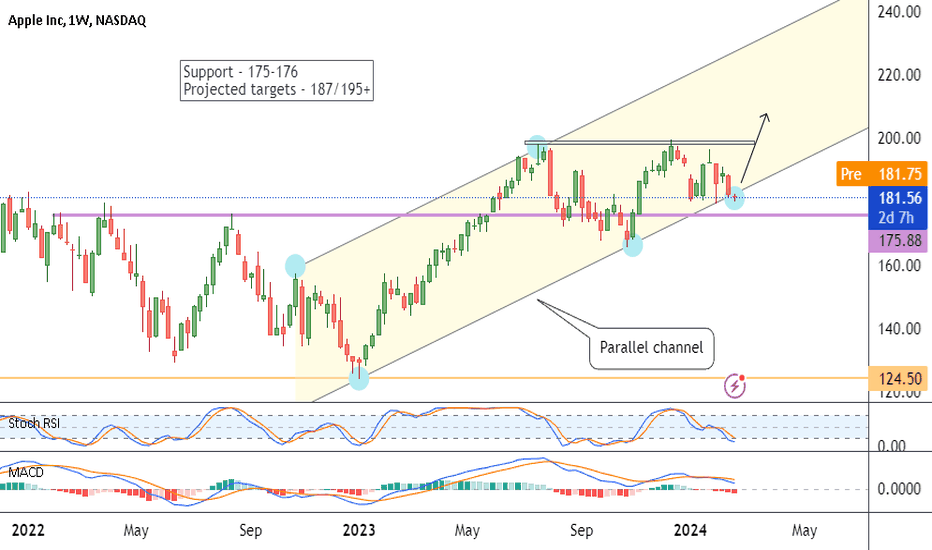
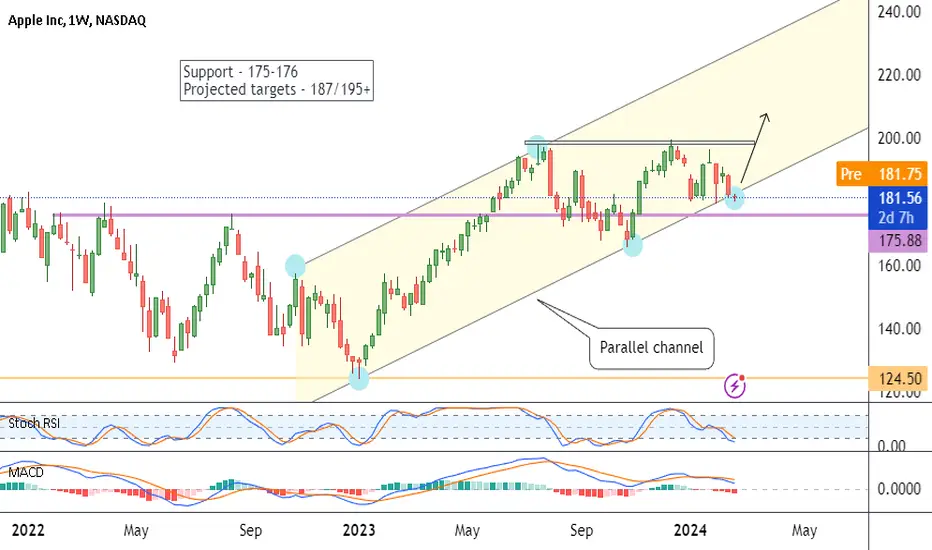
Apple - At Crucial LevelsIt is clear from the setup that the price is at the lower edge of the rising parallel channel. If bounces back from these levels, there may be a bullish phase. Immediate support may be around 175. if sustains below 175, will be out of our setup. This illustration is only my view, not a trading advice in any form. Please conduct your research before taking any trade. All the best.
NASDAQ:AAPLLong
by anandlive
Updated
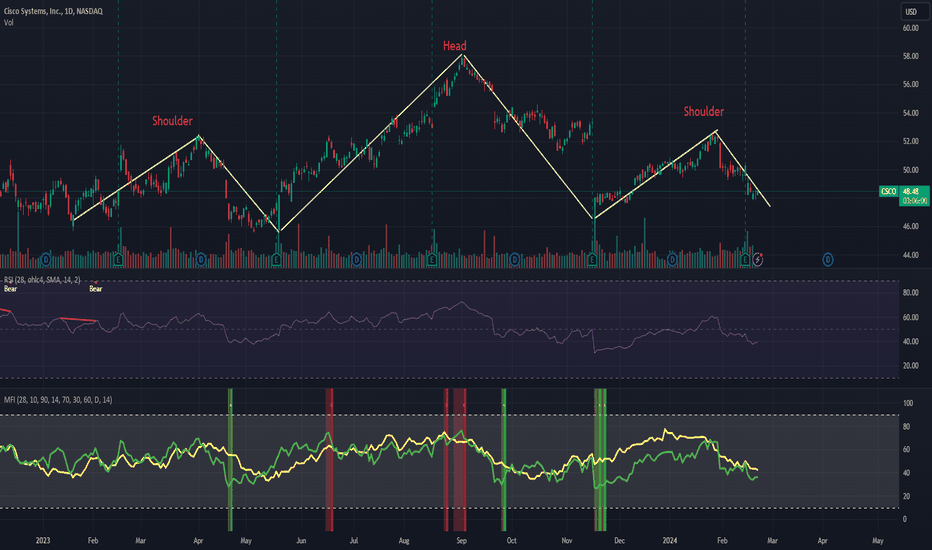
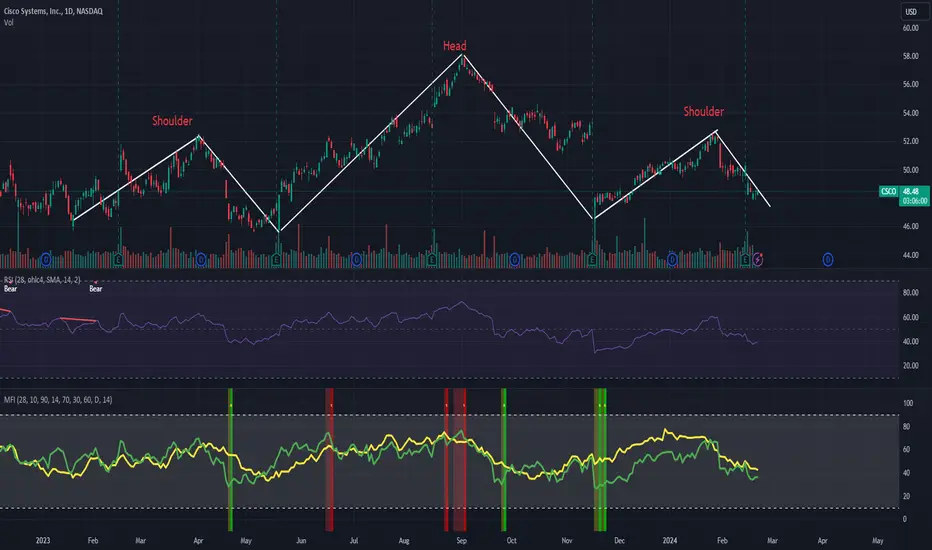
Head and Shoulder - Go down trendHead and shoulder were formed and it will go down further. It's my basic analysis and sharing to everyone.
NASDAQ:CSCOShort
by ashokkurapati
NVIDIA as said earlier profit booking will come, trend change On Our Harmonic pattern indicator based trade setup take trade as explained below :- Early trades Buy or sell below/ above 23.6 %, safe trades buy or sell above / below 41% , after taking trade next upside or downside levels will be target , When reverse buy or sell signal appear then book profit on Target or trail SL to 23.6 % If trailing SL hit then early trade can be taken above or below 23.6 and safe trade can b taken above/ below 41% .. Please note:- It's working on news based and volitile market very well so exit if SL hit
NASDAQ:NVDA
by JaiPrakashShuklaHarmonicTrader
buy only 94.5Buy only above 94.5 T1: 101.5 T2:------------ 121.5 T3-------------------- 135 STOPLOSS:------------------------- 86.25
B
by mfkumar2020
Mark Zuckerberg sold $3 Billion Worth of META stocksShould Investors Be Worried? NASDAQ:META Insiders Sell $1 Billion In Stocks More big NASDAQ:META insider sales: CEO Mark Zuckerberg and six other insiders have sold a combined 82M stocks over a month. That's nearly SEED_TVCODER77_ETHBTCDATA:3B worth of #META stocks insider sales in the last two months. Over the past 15 months, META stock is up over 450% and near all-time highs.
NASDAQ:METAShort
by CryptoPatel
CPRX Long TradeFirst time trading this strategy on Stocks. Price recently reached the bottom of a Channel. I spotted a possible Hidden Divergence on the MACD. Price also recently rejected off the LuxAlgo False Breakout Zone (Highlighted Blue). 3 signs of a possible reversal, Momentum is also headed upward on the MACD. Stop Loss is set at 13.10. I plan on holding this until it reaches the top of the channel.
CLong
by CreativeMillennialInv
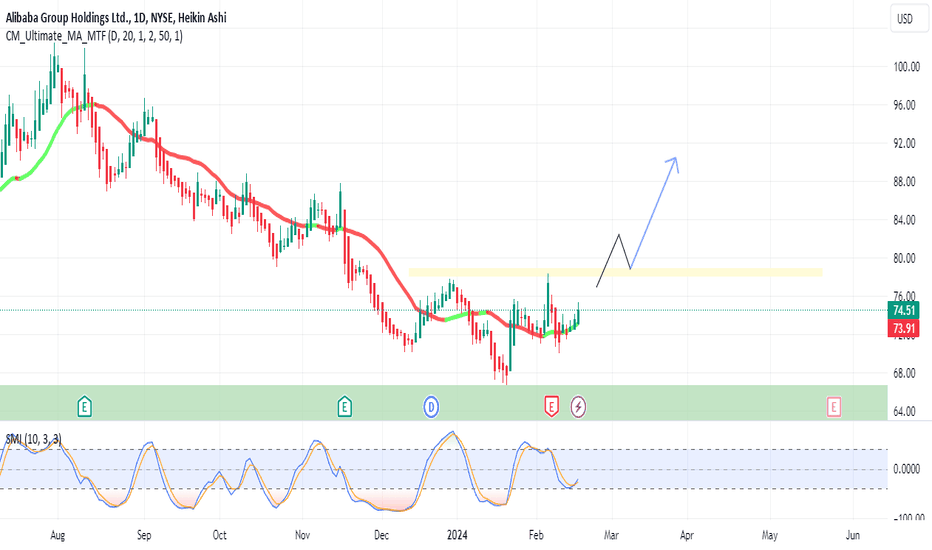
AlibabaDisclaimer: Information provided is not financial advice. Consult a qualified professional before making investment decisions. Past performance is not indicative of future results. Invest at your own risk.
NYSE:BABALong
by Aayush_Raghuwanshi
22
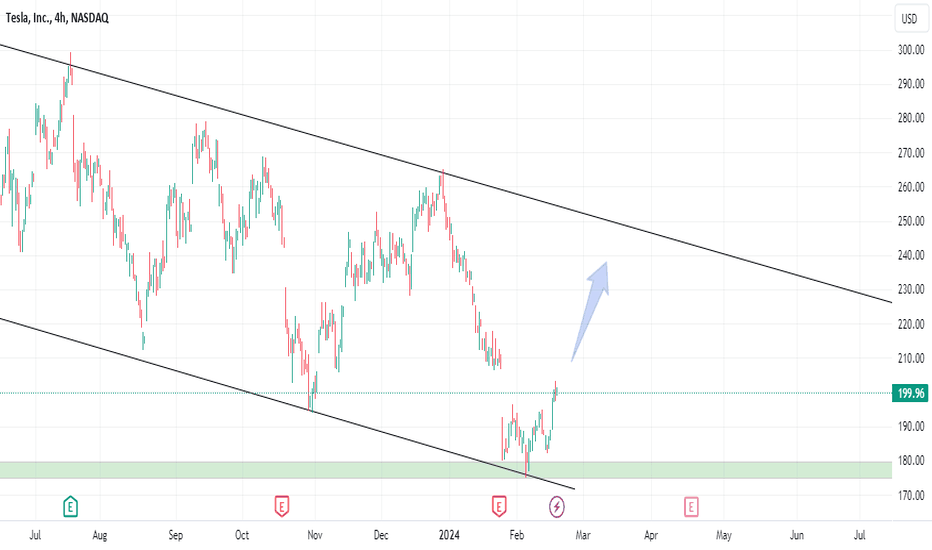
Going Long on TSLADisclaimer: Trading in financial markets involves substantial risks. Consult your financial advisor before making decisions. This commentary is not a solicitation to buy or sell.
NASDAQ:TSLALong
by Aayush_Raghuwanshi
Tesla now at 202 , buy given at 180 hold it Tgt 250 and 290 + On Our Harmonic pattern indicator based trade setup take trade as explained below :- Early trades Buy or sell below/ above 23.6 %, safe trades buy or sell above / below 41% , after taking trade next upside or downside levels will be target , When reverse buy or sell signal appear then book profit on Target or trail SL to 23.6 % If trailing SL hit then early trade can be taken above or below 23.6 and safe trade can b taken above/ below 41% .. Please note:- It's working on news based and volitile market very well so exit if SL hit
NASDAQ:TSLA
by JaiPrakashShuklaHarmonicTrader
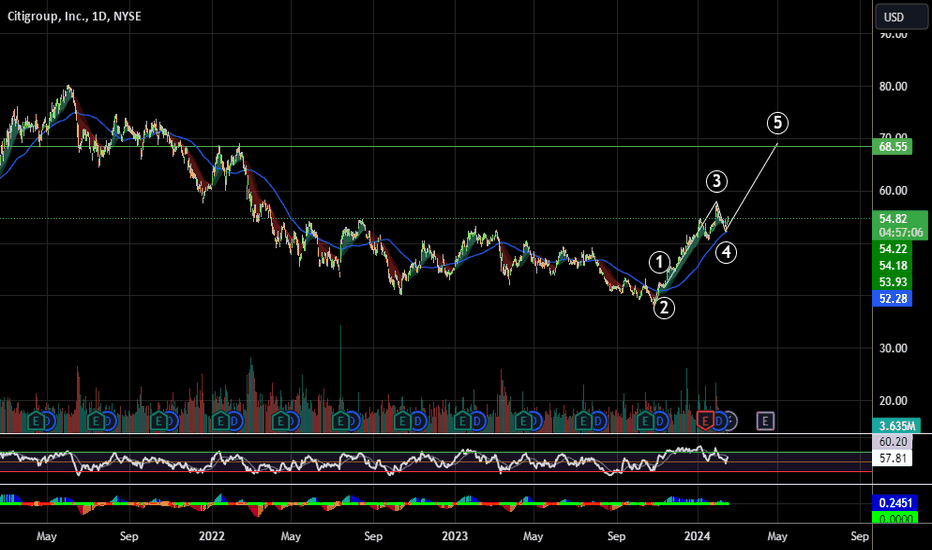
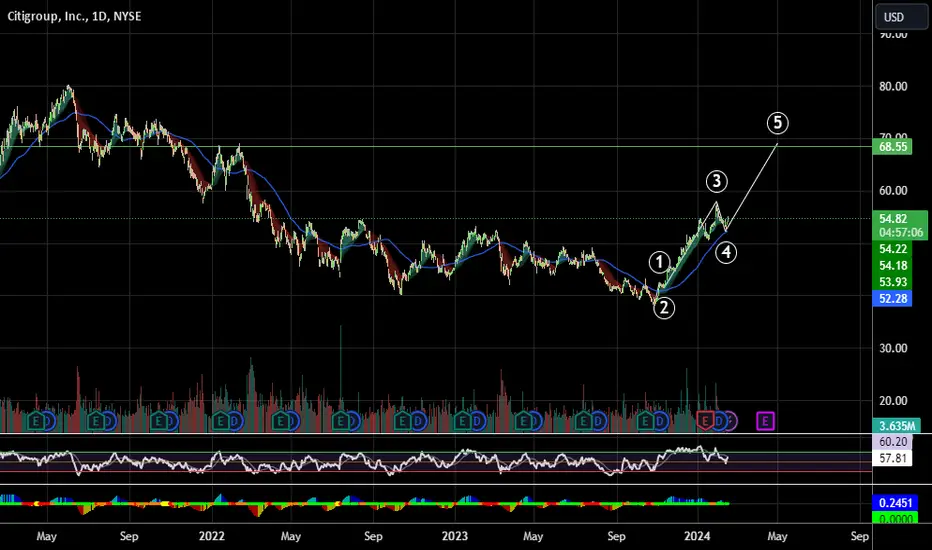
Bullish #CitiGroup $C Looks like beginning of wave (i) of (1) of 5 RR is hugely in favour of Longs
NYSE:CLong
by Kool_kash
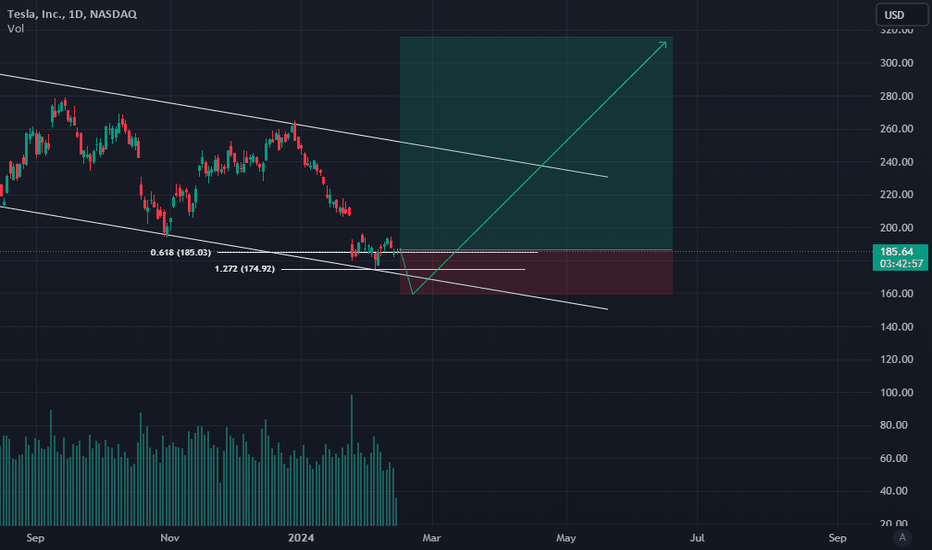
teslai've been looking at tesla for past 3 years and the price action works very well in this amazing stock. this looks very bullish , it can be a very good long term investment.
NASDAQ:TSLALong
by hritikmaurya9768
66
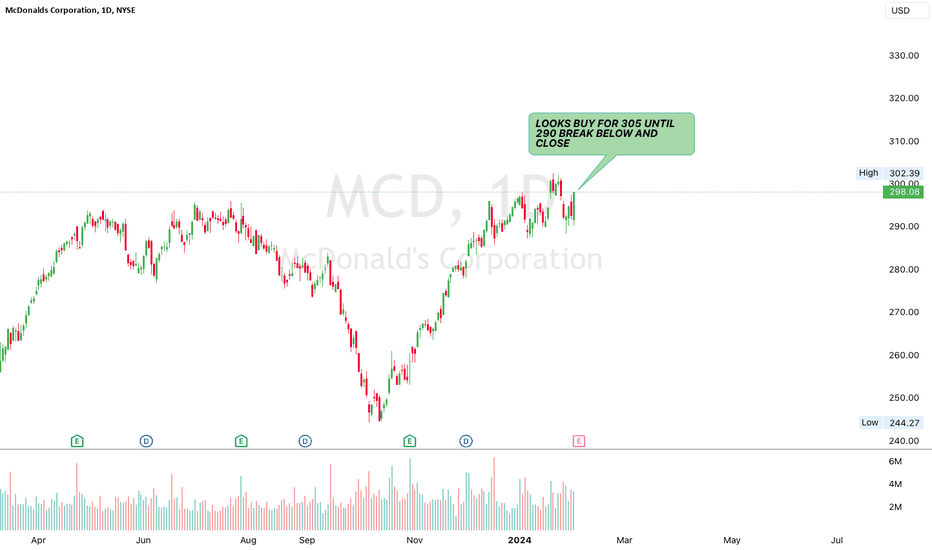
MCD IS TO BREAK ALL TIME HIGHMCD is ready to reach 305, seems bullish. good consolidation happened and seeing an pattern Will break ATH until 290 is strong support
NYSE:MCDLong
by dharaneesh
Updated
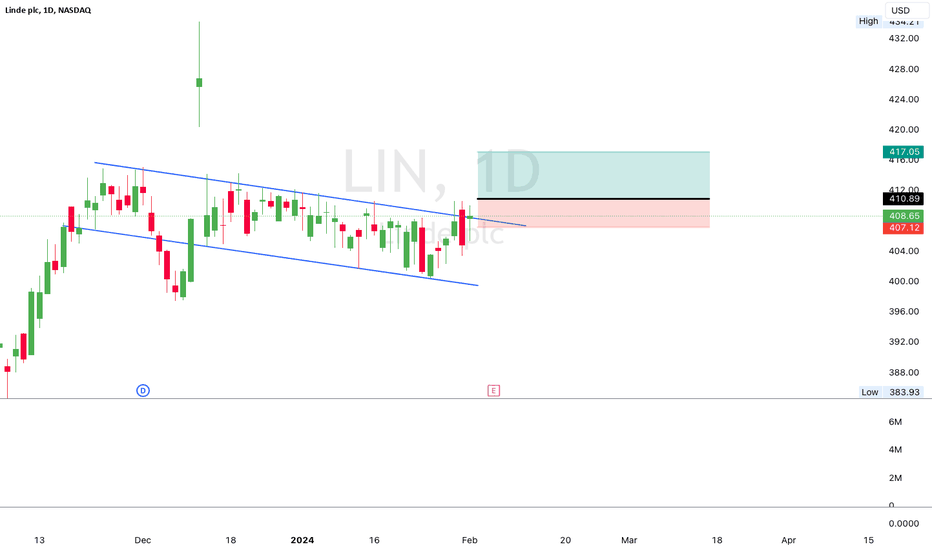
Linde PLC is an BuyLIN is ready to reach 415-417, seems bullish. good consolidation happened and seeing an pattern. Follow for breakout after 410. Setup failure if daily close below 405
NASDAQ:LINLong
by dharaneesh
Updated
112233445566778899101011111212131314141515161617171818191920202121222223232424252526262727282829293030313132323333343435353636373738383939404041414242
…999999

Made by humans

Select market data provided by ICE Data Services. Select reference data provided by FactSet. Copyright © 2026 FactSet Research Systems Inc.Copyright © 2026, American Bankers Association. CUSIP Database provided by FactSet Research Systems Inc. All rights reserved. SEC filings and other documents provided by Quartr.© 2026 TradingView, Inc.

More than a product
  • Supercharts
Screeners
  • Stocks
  • ETFs
  • Bonds
  • Crypto coins
  • CEX pairs
  • DEX pairs
  • Pine
Heatmaps
  • Stocks
  • ETFs
  • Crypto coins
Calendars
  • Economic
  • Earnings
  • Dividends
  • IPOs
More products
  • News Flow
  • Portfolios
  • Fundamental Graphs
  • Yield Curves
  • Options
  • Macro Maps
  • Pine Script®
Apps
  • Mobile
  • Desktop
Community
  • Social network
  • Wall of Love
  • Refer a friend
  • House Rules
  • Moderators
Ideas
  • Trading
  • Education
  • Editors' picks
Pine Script
  • Indicators & strategies
  • Wizards
  • Freelancers
  • Paid Spaces
Tools & subscriptions
  • Features
  • Pricing
  • Market data
  • Gift plans
Trading
  • Overview
  • Brokers
  • Brokers comparison
  • The Leap
Special offers
  • CME Group futures
  • Eurex futures
  • US stocks bundle
About company
  • Who we are
  • Space mission
  • Blog
  • Help Center
  • Careers
  • Media kit
Merch
  • TradingView store
  • Tarot cards for traders
  • The C63 TradeTime
Policies & security
  • Terms of Use
  • Disclaimer
  • Privacy Policy
  • Cookies Policy
  • Accessibility Statement
  • Security tips
  • Bug Bounty program
  • Status page
Business solutions
  • Widgets
  • Charting libraries
  • Lightweight Charts™
  • Advanced Charts
  • Trading Platform
Growth opportunities
  • Advertising
  • Brokerage integration
  • Partner program
  • Education program
Community
  • Social network
  • Wall of Love
  • Refer a friend
  • House Rules
  • Moderators
Ideas
  • Trading
  • Education
  • Editors' picks
Pine Script
  • Indicators & strategies
  • Wizards
  • Freelancers
  • Paid Spaces
Business solutions
  • Widgets
  • Charting libraries
  • Lightweight Charts™
  • Advanced Charts
  • Trading Platform
Growth opportunities
  • Advertising
  • Brokerage integration
  • Partner program
  • Education program
Look FirstLook First