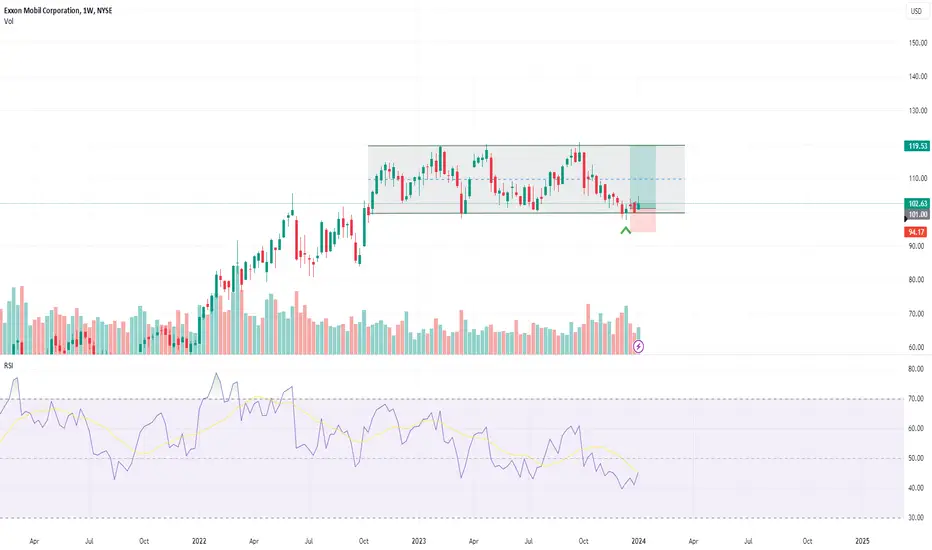
Potential movement possible within range bound bandStock has been trading in sideways and it reaches the bottom support line and printed positve pin bar which is sign of buyers .
It has potential to move till the resistance ( might take a year to achieve the target of 18% )
XLong
COGNIZANT TECHNOLOGY SOLUTIONS CORPORATION (CTSH) WEEKLY CHART Cognizant Technology has been some profit booking on weekly charts after hitting high of 76.85. After the weekly high candle we saw an inside candle and followed by big bodied red candle with range expansion on downside. Low is formed at 72.69 on the stock.
Watch earlier swing highs at 72.71 and 72.36 formed in first and last week of August 2023.
We have a important level to watch at 50% of the earlier range which is 72.40 as seen on chart.
This level can act as a trend decider for this stock in coming weeks.
Happy Trading !!!
N.B. : With usual disclaimers as applicable within reach of this post platform.
BGNE, Target 69Flagpole breakout to a lower side. possibly to going to much earlier lower zone of 69
B
BAC : Booking profitsBooked profit of about 19.28% on the invested capital.
I do realize that there is a potential for a move of about 9% to the next key inflection levels. But considering the overall valuation of the US market and the high interest rate environment and the possibility for a recession to hit the US economy in the near future, I do expect a sell-off. So decided to cut some position and maintain some cash positions.
For that reason I closed the position in this stock.
Will consider a re-entry if price falls back to the low of the channel line.
XOMNYSE:XOM
My Recent Trade
*expecting XOM to GO UP
*head and shoulders pattern
*expecting/target 4% -5% upside
* Swing Trade
Disclaimer:
* its only my analysis ,am just back testing my strategy *
* am not any registered advisor/expert *
* its not a buy/sell call*
XLong
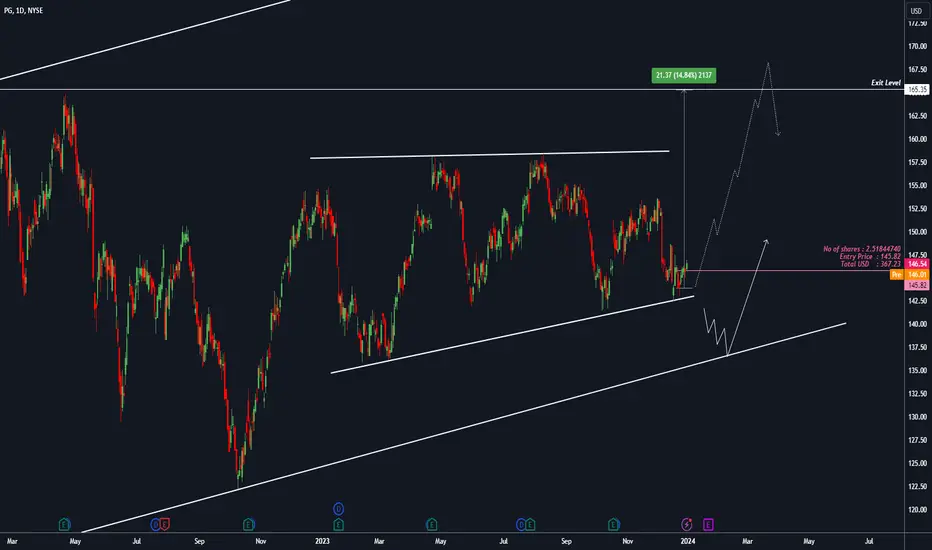
PG : Going longFundamentals
Pros
Very consistent free cash flow.
Revenue is increasing YOY.
There is good enough institutional interest in the stock.
This is a mega cap company.
They are a dividend king.
Hardly any short interest in the company.
They have 3 times of their net debt as free cash flow. This is a good sign in times of recession.
Cons
There is a lot of competition from even the big players in this sector.
PG was sold by Berkshire Hathaway to increase his cash pile. Not completely. But a considerable portion.
Technicals
In a favorable position as per technicals to take an entry for about 1.25% of the capital. Will be targeting the highs for a profit of about 14.8% of the total capital.
Will consider adding onto the position if price crashes to 138 levels, which is around the lower trendline of a long term parallel channel.
Previous posts related to the same stock is attached underneath. Do check that out.
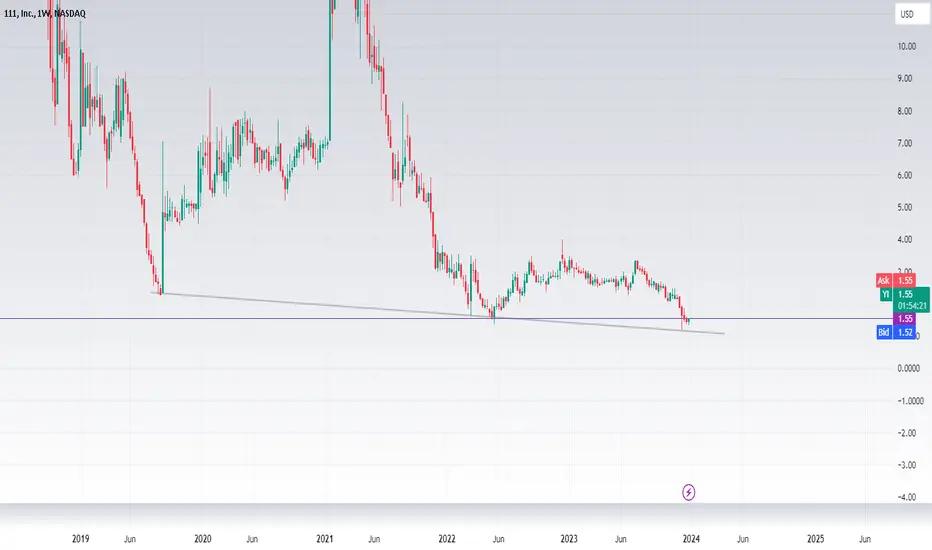
YINASDAQ:YI
Very Very RISKY Trade
am expecting this stock to take 3rd support in that trend line
expecting a small up/ small retracement enough for me to close this trade
Disclaimer:
* its only my analysis ,am just back testing my strategy *
* am not any registered advisor/expert *
* its not a buy/sell call*
Accenture - Long Monthly ChartsHey Guys Some NRI Friends have asked for Analysis for stocks in the US Market.
Investment Idea 1 - Long Accenture on Monthly Basis
Stock Taking Support Multiple Times around $244.
Good Range to Buy
25% of Investible Capital around 260 Levels
25% of Investible Capital Around 240-244
50% of Investible Capital at 225-226.
Hold Period 6-8 Months for Target 1 - 300 & Target 2 - 345
Fifth Third Bancorp Monthly LongTake entry above $27 has made a fresh monthly demand zone. Near Breaking it out for Targets 36 & 44
SL 22
FLong
CSCONASDAQ:CSCO
expecting CSCO to go UP
CSCO in its 3rd resistance level ,i hope this time it will break the Resistance
if it fails to breakout (upside), it will come down to take some support, also it have some more support level at 48-49 USD
purple line
Disclaimer:
* its only my analysis ,am just back testing my strategy *
* am not any registered advisor/expert *
* its not a buy/sell call*
Bristol-Myers Squibb CompanyBristol-Myers Squibb Company buying opportunity.
* according to 1 day candlestick chart or Technical indicator standard pivot point Price prediction or possibility.
1. Price consolidated pivot on few days.
2. Today Price reversal uptrend with good
Relative Volume.
3. pivot point is a good support.
4. price sustain upper leval chance to
breakout .
5 . Risk reward ratio is good.
STOP LOSS ( PIVOT POINT)
TARGET :- RESISTANCE 2 ,3,4
According to trellinng your stop loss
* my personal view right time to entry. Thanks