CON: Massive W-Bottom Macro Base and Explosive Breakout1. The Macro Perspective: The Multi-Month Washout
I am taking a LONG bias on Concentra Group Holdings Parent, Inc. (CON) on the weekly (1W) timeframe.
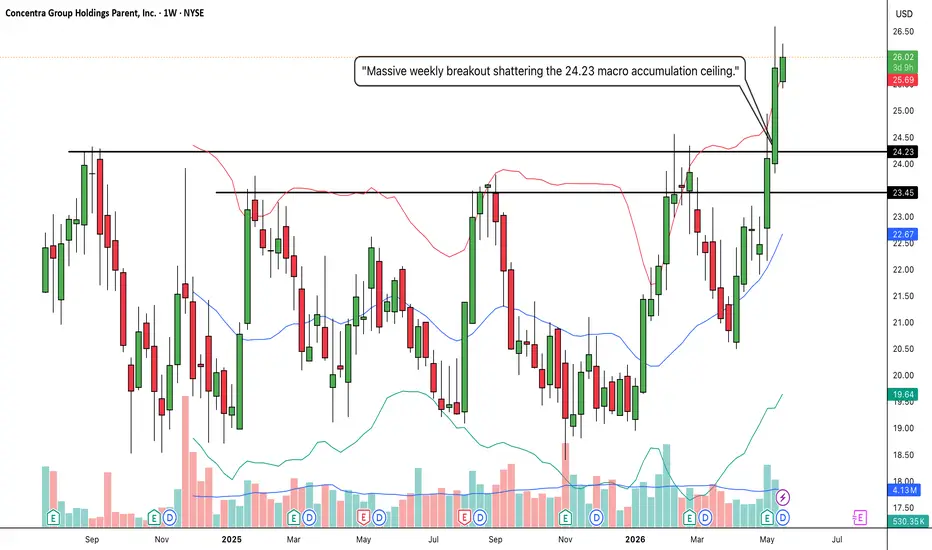
When analyzing pure market structure, the most lucrative macro trends are born from deep, exhausting accumulation phases. Look at the massive structural development spanning this chart. After establishing a historical resistance zone between the solid black 23.45 and 24.23 lines, the stock suffered a prolonged markdown phase. It washed out all the way down into the 19.50 zone, completely decimating weak hands and forcing retail capitulation. However, heavy institutional capital stepped in at those lows to establish an absolute concrete floor, initiating the left side of a massive "W" or Double Bottom accumulation structure.
2. The Educational Setup: The Higher-Low Springboard
To understand the sheer strength of this current breakout, look at how the right side of the "W" pattern was formed:
The Rejection and the Trap: The stock rallied back to the 24.23 ceiling and faced a brutal rejection. To an amateur trader, this looked like a massive double-top failure, triggering short sellers and panic selling.
The 20 SMA Defense: Notice what happened next. The stock pulled back, but it refused to make a new low. Instead, institutional buyers aggressively defended the rising 20 SMA (the middle blue line of your Bollinger Bands) right around the 20.00 to 21.00 level. By carving out a massive "Higher Low" directly on the moving average, they trapped the short sellers and created a powerful structural springboard for the next leg up.
3. Current Price Action: Blue Sky and Volatility Expansion
Look at the most recent weekly candles on the far right. The springboard has absolutely exploded. Buyers have effortlessly shattered the entire resistance block (23.11 dashed, 23.45 solid, and 24.23 solid) with consecutive, massive green momentum expansion candles. Furthermore, notice how the price has violently pierced the upper Bollinger Band, forcing the bands to rapidly expand upward alongside a noticeable surge in buying volume. By decisively clearing this massive multi-month accumulation zone, CON has officially entered "Blue Sky Territory" (pure price discovery).
4. The Trade Plan: Entries, Targets, and Risk Management
Entry Strategy: Momentum is exceptionally strong right now near 26.00. Chasing a massive vertical expansion candle riding outside the weekly Bollinger Bands always carries a higher risk of an agonizing intraday or daily mean-reversion pullback. The highest-probability, lowest-risk entry involves stepping down to a daily timeframe and placing limit orders to catch a potential structural pullback to perfectly retest the 24.00 to 24.50 breakout zone. Letting that heavy historical resistance prove itself as a new, indestructible support floor offers a phenomenal risk-to-reward ratio.
Take Profit (Targets): We use measured structural targets based on the depth of the massive macro base. By taking the depth of the W-Bottom (roughly 4.75 points from the ~19.50 floor up to the 24.23 ceiling) and projecting it upward from the breakout line, our primary structural swing target sits comfortably in the 28.75 to 29.00 zone. The psychological 30.00 mark will act as a secondary macro magnet.
Invalidation (Stop Loss): A macro breakout thesis is only valid if the new market structure holds. A hard stop loss should be placed safely below the breakout zone and the recent daily consolidation, around the 22.00 to 22.50 level. A definitive weekly close completely back inside the old accumulation base and breaking below the 20 SMA would act as a massive warning sign of a failed macro breakout and a severe bull trap.
5. Time Horizon:
Because this technical setup is built on a 1-Week chart capturing a massive structural W-Bottom completion and volatility expansion, this is a medium-to-longer-term position trade designed to capture the explosive new markup phase. Let the macro trend run!  Long
Long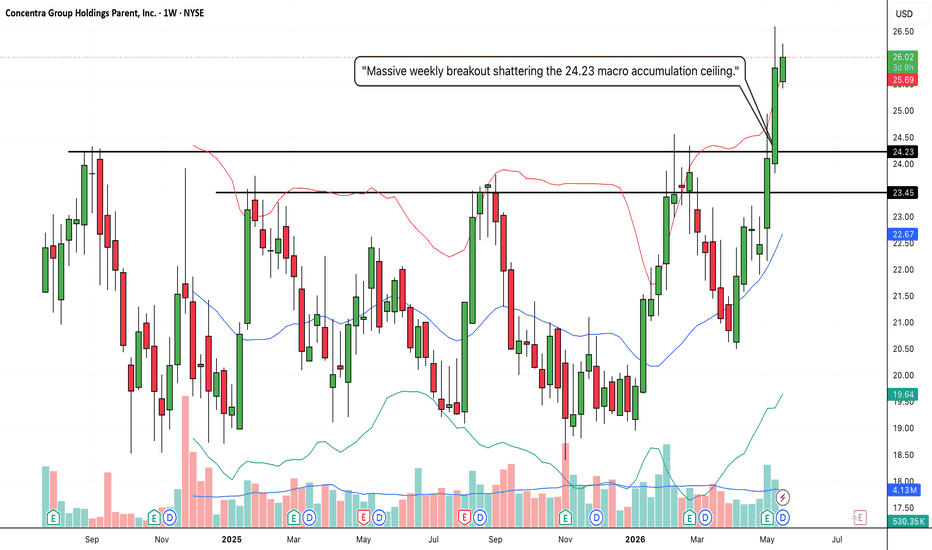
COST:The Macro Cup & Handle and Explosive All-Time High Breakout1. The Macro Perspective: The Digestion Bowl
I am taking a LONG bias on Costco Wholesale Corporation (COST) on the weekly (1W) timeframe.
When analyzing pure market structure, the healthiest and most sustainable secular trends require proportional digestion phases. Look at the massive structural development spanning the center of this chart. After establishing a historical peak at the solid black 1,066.96 line, the stock was technically exhausted. However, instead of collapsing into a bear market, institutional capital facilitated a highly controlled, multi-month markdown phase. The stock washed out down toward the 800 level, shaking out weak hands, before finding a concrete floor. Over the ensuing months, it carved out a massive "Cup" or rounding bottom, systematically marching right back up to challenge the scene of the crime.
2. The Educational Setup: The 20 SMA Pressure Cooker Handle
To understand the sheer strength of this current breakout, look at how the price systematically transitioned from accumulation back into a markup phase right at the ceiling:
The High-Level Squeeze: When the price reached the ultimate macro neckline at 1,066.96, amateur traders expected a brutal double-top rejection. Instead, institutional buyers aggressively defended the structure. They absorbed supply and forced the price to chop sideways in a tight range just below the resistance, establishing a structural "Handle."
The Dynamic Trampoline: Look closely at the handle formation. Every minor dip was perfectly bought right at the rising 20 SMA (the middle blue line of your Bollinger Bands). Consolidating tightly between a flat resistance ceiling and a rising moving average creates the ultimate pressure cooker. It gracefully transfers shares from impatient retail traders taking profits to strong-handed institutional buyers, allowing the bands to squeeze and storing immense kinetic energy.
3. Current Price Action: Blue Sky Territory
Look at the most recent weekly candle on the far right. The pressure cooker has absolutely exploded. Buyers have effortlessly shattered the 1,066.96 macro ceiling with a massive green momentum expansion candle, pushing the price well into the 1,070s. Furthermore, the price is now aggressively pushing against the upper Bollinger Band, forcing a volatility expansion. By decisively clearing this massive accumulation zone, COST has officially entered "Blue Sky Territory" (pure price discovery). All historical overhead supply has been completely eliminated.
4. The Trade Plan: Entries, Targets, and Risk Management
Entry Strategy: Momentum is exceptionally strong right now near 1,076.47. Chasing a massive vertical expansion candle breaking into new highs carries the risk of an agonizing intraday or daily drawdown as the stock naturally breathes. The highest-probability, lowest-risk entry involves stepping down to a daily timeframe and placing limit orders to catch a potential minor structural pullback to perfectly retest the 1,060.00 to 1,070.00 breakout zone. Letting that old, heavy historical resistance prove itself as a new, indestructible support floor offers a phenomenal risk-to-reward ratio.
Take Profit (Targets): We use measured structural targets based on the depth of the macro base. By taking the depth of the massive Cup (roughly 260+ points from the ~800 floor up to the 1,066.96 ceiling) and projecting it upward from the breakout line, our primary structural macro target sits comfortably in the 1,325.00 to 1,350.00 zone.
Invalidation (Stop Loss): A macro breakout thesis is only valid if the new market structure holds. A hard stop loss should be placed safely below the 20 SMA and inside the recent handle consolidation, around the 980.00 to 1,000.00 level. A definitive weekly close completely back inside the old accumulation base and breaking below the moving average would act as a massive warning sign of a failed macro breakout and a severe bull trap.
5. Time Horizon:
Because this technical setup is built on a 1-Week chart capturing a massive structural phase transition and Cup & Handle completion, this is a medium-to-longer-term position trade designed to capture a secular markup phase. Let the macro trend run!  Long
Long
DDOG:Multi-Year Rounding Bottom and ExplosiveAll-TimeHighBrekout1. The Macro Perspective: The Brutal Washout and Recovery
I am taking a LONG bias on Datadog, Inc. (DDOG) on the absolute macro monthly (1M) timeframe.
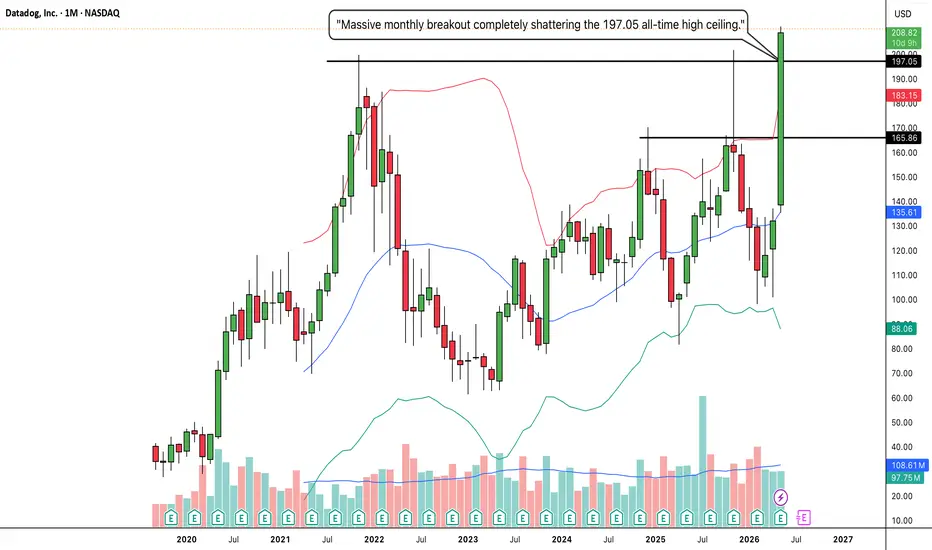
When analyzing pure market structure on a monthly chart, we are looking at cycles that take years to play out. Look at the massive structural development spanning this entire chart. After establishing a historical peak at the solid black 197.05 line, the stock suffered a brutal, agonizing markdown phase. This deep correction successfully washed out weak hands and forced mass retail capitulation, dragging the price all the way down into the 60s. However, instead of bleeding into a permanent bear market, heavy institutional capital stepped in to establish a concrete floor. Over the last two years, the stock has been quietly carving out an enormous "Rounding Bottom" accumulation phase, systematically riding the 20 SMA (the middle Bollinger Band) to march right back up the chart.
2. The Educational Setup: Conquering the Stepping Stones
To understand the sheer strength of this current breakout, look at how the price systematically transitioned from accumulation back into a markup phase:
The Mid-Level Digestion: The stock's recovery initially faced heavy resistance at the solid black 165.86 line. Instead of suffering a massive rejection, it paused, digested the supply, and formed a high-level consolidation right at the moving average.
The Institutional Urgency: When institutional capital decides it is time to move, they don't wait. Buyers used that mid-level digestion as a launchpad, creating an aggressive, near-vertical surge that refused to give sellers a chance to breathe.
3. Current Price Action: Blue Sky and Volatility Expansion
Look at the most recent monthly candle on the far right. The momentum is absolutely explosive. Buyers have effortlessly shattered both the 165.86 stepping stone and the 197.05 ultimate macro ceiling in a single, massive momentum expansion candle. Furthermore, notice how the price has violently pierced the upper Bollinger Band, forcing the bands to rapidly expand. By decisively clearing this multi-year accumulation zone, DDOG has officially entered "Blue Sky Territory" (pure price discovery). All historical overhead supply has been completely eliminated.
4. The Trade Plan: Entries, Targets, and Risk Management
Entry Strategy: Momentum is exceptionally strong right now near 208.82. Chasing a massive vertical expansion candle riding completely outside the monthly Bollinger Bands carries a severe risk of an agonizing drawdown as the stock naturally breathes. The highest-probability, lowest-risk entry involves stepping down to a weekly or daily timeframe and waiting for the dust to settle. Look to place limit orders to catch a potential minor structural pullback to perfectly retest the 195.00 to 200.00 breakout zone. Letting that old all-time high resistance prove itself as a new, indestructible support floor offers a phenomenal risk-to-reward ratio.
Take Profit (Targets): We use measured structural targets based on the depth of the macro base. By taking the depth of the massive Rounding Bottom (roughly 130 points from the ~65 floor up to the 197.05 ceiling) and projecting it upward from the breakout line, our primary structural macro target sits comfortably in the 325.00 to 330.00 zone. Immediate psychological milestones are 250.00 and 300.00.
Invalidation (Stop Loss): A macro breakout thesis is only valid if the new market structure holds. A hard stop loss should be placed safely below the 197.05 breakout line and the 165.86 mid-level pivot, around the 150.00 to 155.00 level. A definitive monthly close completely back inside the old accumulation base would act as a massive warning sign of a failed macro breakout and a severe bull trap.
5. Time Horizon:
Because this technical setup is built on a 1-Month chart capturing a massive structural phase transition and All-Time High breakout, this is a long-term position trade designed to capture a secular markup phase over the coming months. Let the macro trend run!  Long
Long
VRSN:Textbook Macro Break & Retest and ExplosiveV-ShapedBreakout1. The Macro Perspective: The Perfect Break and Retest
I am taking a LONG bias on VeriSign, Inc. (VRSN) on the weekly (1W) timeframe.
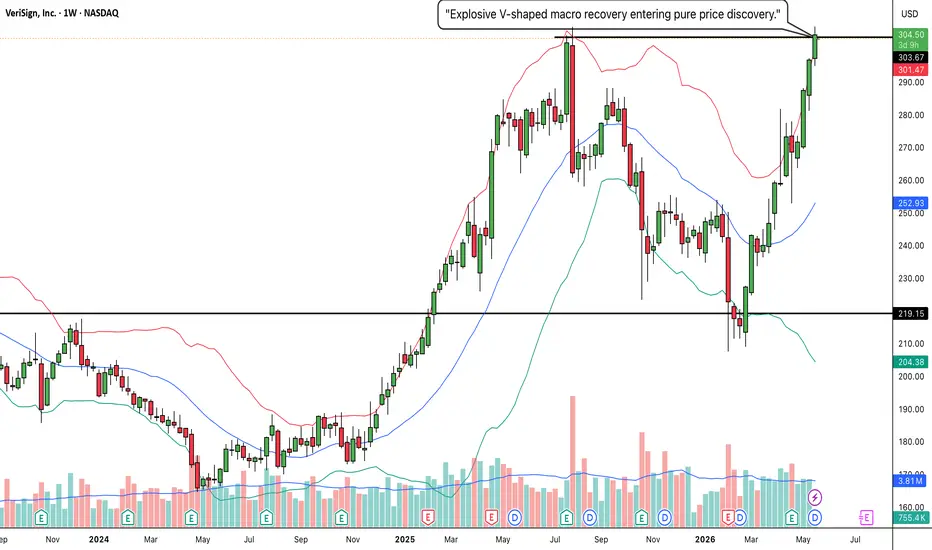
When analyzing pure market structure, the most lucrative macro trends are built on indestructible foundations. Look at the massive structural development spanning this entire chart. Previously, the stock was capped by the solid black resistance line at 219.15. When it finally broke out, it initiated a massive, parabolic run all the way up to the 305 zone. Naturally, that kind of momentum causes severe exhaustion. The stock suffered a brutal, highly volatile washout phase. But look exactly where the bleeding stopped. The price crashed straight down to the 219.15 line, found a concrete floor, and bounced. It perfectly retested its previous macro resistance, officially flipping it into indestructible support.
2. The Educational Setup: The Aggressive V-Shaped Right Side
To understand the sheer strength of this current breakout, look at how the price behaved after that massive 219.15 retest:
Institutional Urgency: After a deep washout, stocks usually chop sideways for months to build a rounded base. VRSN completely ignored that playbook.
The V-Shape: Institutional capital stepped in with extreme aggression, creating a V-shaped recovery. Buyers forced the price straight back up the right side of the chart, completely bypassing mid-level resistance and marching directly back to the ultimate macro ceiling at the solid black 304.50 line.
3. Current Price Action: Riding the Upper Band into Blue Sky
Look at the most recent weekly candles on the far right. The recovery has successfully converted into an explosive breakout. Buyers have effortlessly shattered the 304.50 macro ceiling with a strong green momentum expansion candle. Furthermore, notice how the price has violently pierced the upper Bollinger Band, forcing the bands to rapidly expand upward. By decisively clearing this massive multi-month ceiling, VRSN has initiated a powerful volatility expansion and officially entered "Blue Sky Territory" (pure price discovery).
4. The Trade Plan: Entries, Targets, and Risk Management
Entry Strategy: Momentum is exceptionally strong right now near 305.31. Chasing a massive vertical expansion candle riding outside the weekly Bollinger Bands always carries a higher risk of an agonizing intraday or daily mean-reversion pullback. The highest-probability, lowest-risk entry involves stepping down to a daily timeframe and placing limit orders to catch a potential structural pullback to perfectly retest the 300.00 to 305.00 breakout zone. Letting that heavy historical resistance prove itself as a new support floor offers a phenomenal risk-to-reward ratio.
Take Profit (Targets): We use measured structural targets based on the depth of the massive macro base. By taking the depth of the washout (roughly 85 points from the 219.15 floor up to the 304.50 ceiling) and projecting it upward from the breakout line, our primary structural swing target sits comfortably in the 385.00 to 390.00 zone. The massive 350.00 mark will act as the immediate psychological magnet.
Invalidation (Stop Loss): A V-shaped macro breakout thesis is only valid if the new market structure holds. A hard stop loss should be placed safely below the breakout line and the rising 20 SMA (middle Bollinger Band), around the 260.00 to 270.00 level. A definitive weekly close completely back inside the old base and breaking below 250.00 would act as a massive warning sign of a failed macro breakout and a severe bull trap.
5. Time Horizon:
Because this technical setup is built on a 1-Week chart capturing a massive structural break-and-retest followed by a V-shaped recovery, this is a medium-to-longer-term position trade designed to capture the explosive new markup phase. Let the macro trend run!  Long
Long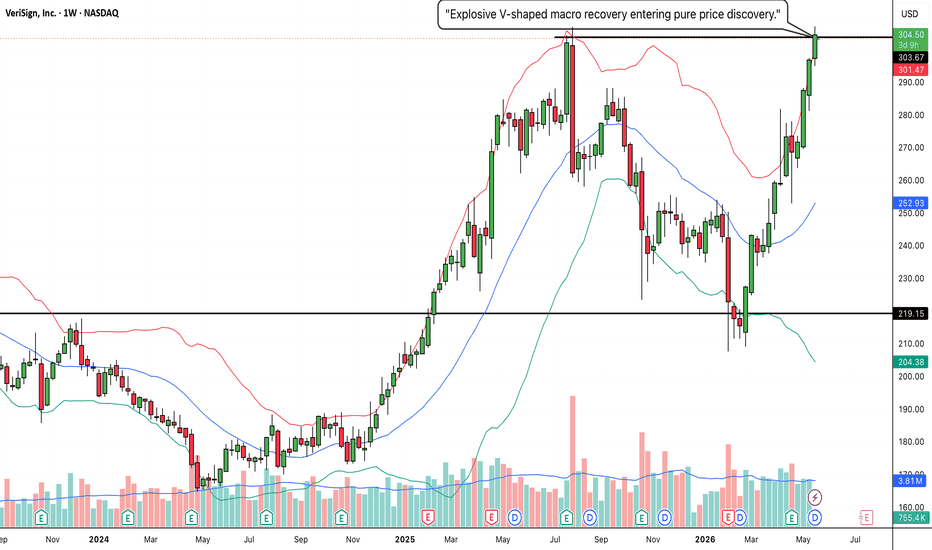
 Long
Long
 Long
Long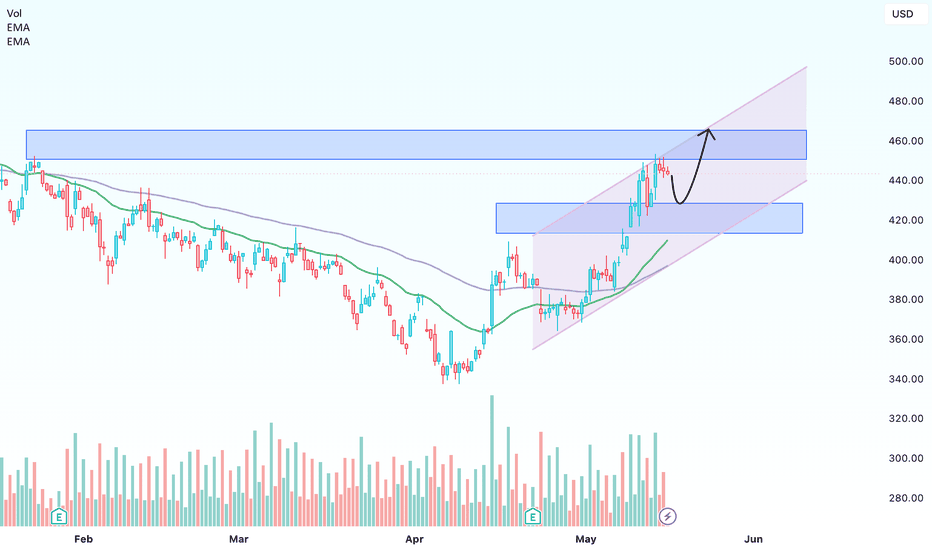
 Long
Long
MU: Explosive Structural Breakout From Multi-Month ConsolidationThe Setup (Bias): I am taking a LONG bias on Micron Technology, Inc. (MU) on the weekly timeframe.
The "Why" (Technical Reasons): 1. Major Resistance Breakout: After a healthy period of chopping sideways and building energy, the price has forcefully broken out of its consolidation range, slicing cleanly through the strong structural resistance at $450.46.
2. Extreme Bullish Momentum: The breakout is driven by a massive, full-bodied green weekly candle closing near its absolute highs. This indicates aggressive institutional buying pressure and a complete lack of seller pushback at these elevated levels.
Trade Plan (Entry & Exits): * Entry: Momentum traders can look for entries near the current market price of $496.72 to capture the immediate surge. A safer, lower-risk approach would be placing limit orders to catch a potential pullback or retest of the $450.46 zone, letting the old ceiling prove itself as a new floor.
Take Profit (Target): With the stock breaking into fresh all-time highs with immense relative strength, the next major psychological milestones are $550.00, followed by $600.00.
Stop Loss: Placed safely below the breakout zone and recent minor support, around $400.00. A weekly close below this level would indicate a failure of the breakout structure.
Duration: Because this analysis is built on a 1-Week chart, this is a medium-to-longer-term swing trade designed to play out over the coming weeks to months.  Long
Long
 Long
Long
ETN: Decisive Structural Breakout from Multi-Month RangeThe Setup (Bias): I am taking a LONG bias on Eaton Corporation, PLC (ETN) on the weekly timeframe.
The "Why" (Technical Reasons): 1. Major Resistance Breakout: The price has powerfully broken out of a wide, multi-month consolidation range, decisively clearing the heavy historical resistance at $394.28.
2. Extreme Bullish Momentum: The breakout is driven by a massive, full-bodied green weekly candle closing near its absolute high. This indicates immense institutional buyer demand and a complete lack of selling pressure at these new levels.
Trade Plan (Entry & Exits): * Entry: Momentum traders can look for entries near the current market price of $423.92 to ride the aggressive wave. A safer, more conservative approach would be placing limit orders to catch a potential pullback or retest of the $394.28 to $400.00 zone, looking for old resistance to flip into new support.
Take Profit (Target): With the stock entering price discovery and showing extreme momentum, the next major psychological targets are $450.00, followed by $475.00.
Stop Loss: Placed safely below the lower support boundary of the recent swing, around $370.00. A weekly close below this level would indicate a false breakout and invalidate the bullish thesis.
Duration: Because this analysis is built on a 1-Week chart, this is a longer-term swing trade designed to play out over the coming weeks to months.  Long
Long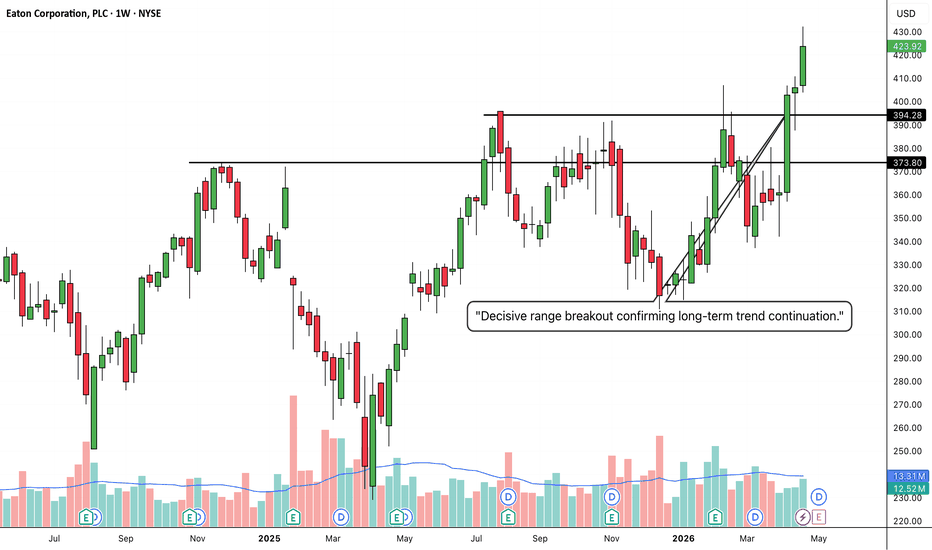
BHE: Powerful Breakout Above $60 Signals Further UpsideThe Setup (Bias): I am taking a LONG bias on Benchmark Electronics, Inc. (BHE) on the weekly timeframe.
The "Why" (Technical Reasons): 1. Decisive Resistance Breakout: The stock has powerfully broken out of its recent consolidation zone, slicing through the $60.13 resistance level with a massive, high-momentum bullish candle.
2. Support Confirmation: Prior to this breakout, we can see the price successfully tested and held the $51.37 level. This proves that the older historical resistance has beautifully flipped into a strong support floor, giving buyers the confidence to push the price higher.
Trade Plan (Entry & Exits): * Entry: Momentum traders can look for entries near the current market price of $69.52. A more conservative approach would be placing limit orders to catch a potential slight pullback or retest of the $60.00 - $65.00 zone.
Take Profit (Target): With strong upward momentum and clear skies, the next major psychological targets are $80.00, followed by $85.00.
Stop Loss: Placed safely below the breakout zone, around $55.00. If the price falls back below this level, the breakout is invalidated.
Duration: Because this analysis is built on a 1-Week chart, this is a longer-term swing trade designed to ride the trend over the coming weeks to months.  Long
Long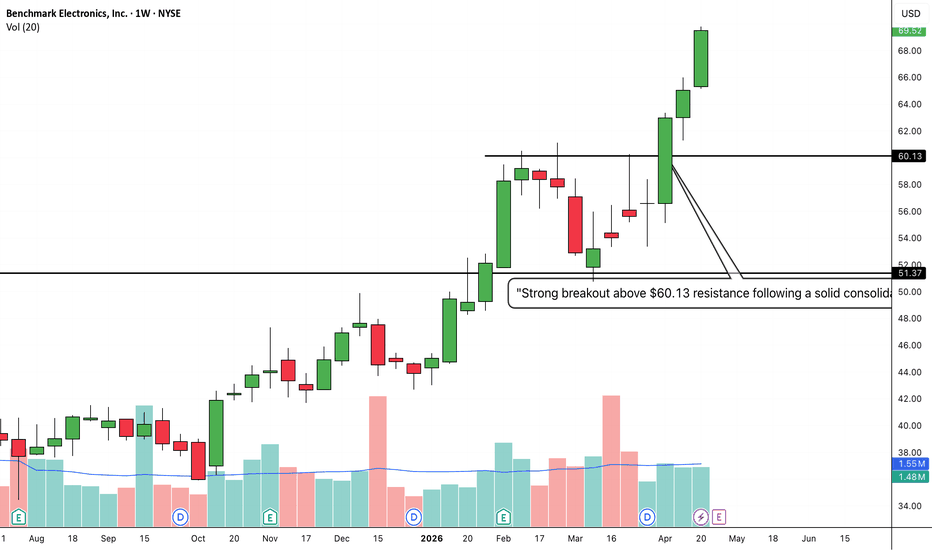
 Long
Long
 Long
Long
 Long
Long
 Long
Long
 Long
Long
 Long
Long
 Long
Long
 Long
Long