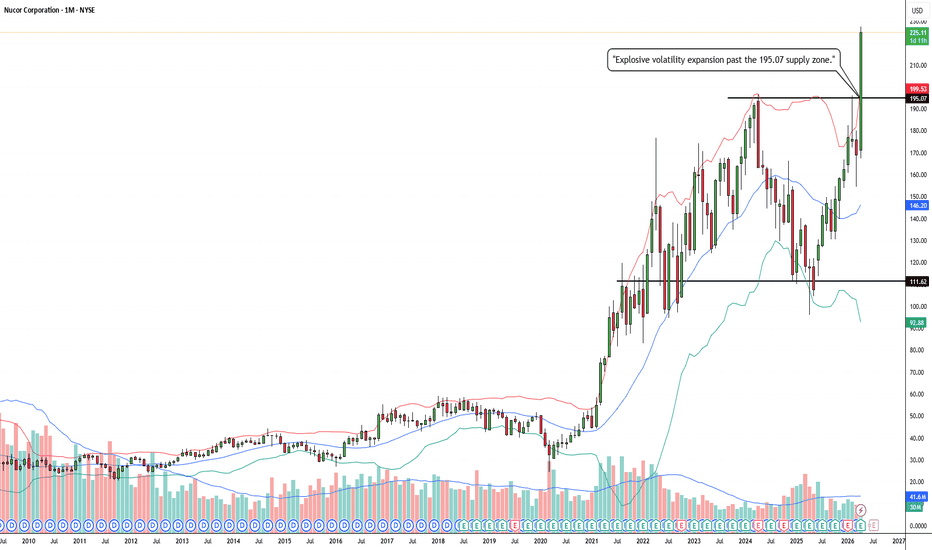
NUE: Explosive Macro Breakout and Volatility ExpansionThe Setup (Bias): I am taking a LONG bias on Nucor Corporation (NUE) on the macro monthly (1M) timeframe.
The "Why" (Technical Reasons): 1. Historic Structural Breakout: Zooming out to the monthly timeframe reveals the true magnitude of this move. The price has forcefully broken out of a massive, multi-year consolidation base, cleanly slicing through the heavy macro resistance ceiling at 195.07 that has capped the stock for years.
2. Volatility Expansion: By applying Bollinger Bands, we can see a textbook volatility squeeze and subsequent expansion. The bands are opening up rapidly as the price rides the upper band, confirming that this breakout is backed by extreme momentum and aggressive institutional buying pressure.
Trade Plan (Entry & Exits): * Entry: Momentum and position traders can look for entries near the current extended market price of 225.11 to capture the aggressive phase transition. A safer, lower-risk approach would be waiting for the momentum to cool and placing limit orders to catch a potential monthly pullback to retest the 195.00 to 200.00 breakout zone, letting that old macro ceiling prove itself as a new floor.
Take Profit (Target): With the stock breaking out into fresh territory with this much monthly momentum, the trend can carry it significantly higher. The next major psychological targets are the 250.00 milestone, followed by 300.00.
Stop Loss: Placed safely below the middle of the recent monthly consolidation block, around the 160.00 level. A monthly close back below the 195.07 structural level would be an early warning sign of a failed macro breakout.
Duration: Because this analysis is built on a massive 1-Month chart capturing a macro trend continuation, this is a long-term position trade designed to play out over the coming months to years.
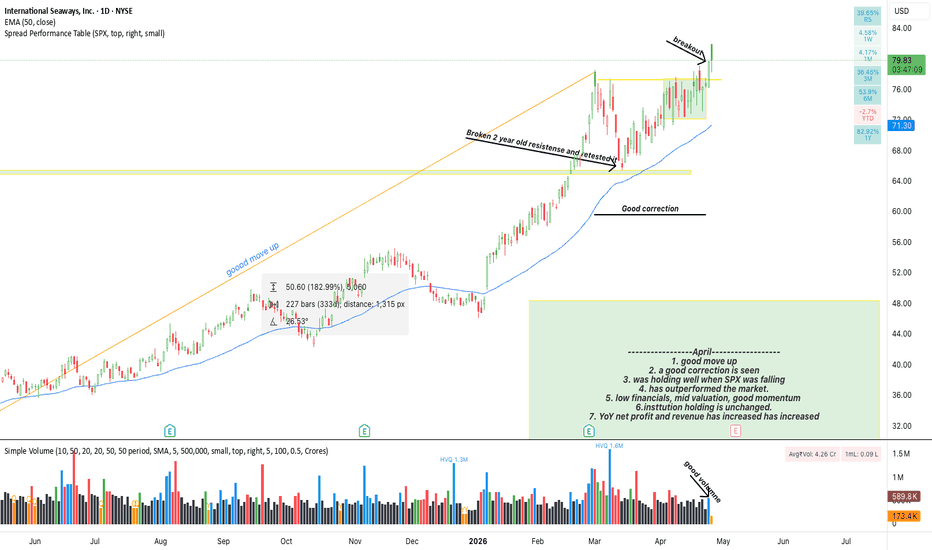
International seaways(INSW) analysisI am going to buy this stock due to following reasons.
1. good move up
2. a good correction is seen
3. was holding well when SPX was falling
4. has outperformed the market.
5. low financials, mid valuation, good momentum
6.institution holding is unchanged.
7. YoY net profit and revenue has increased has increased.
I am managing my risk with SL of 7.7%, I will aim target between 25-20%.
PS:- This is for learning purpose only not a tip or recommendation.
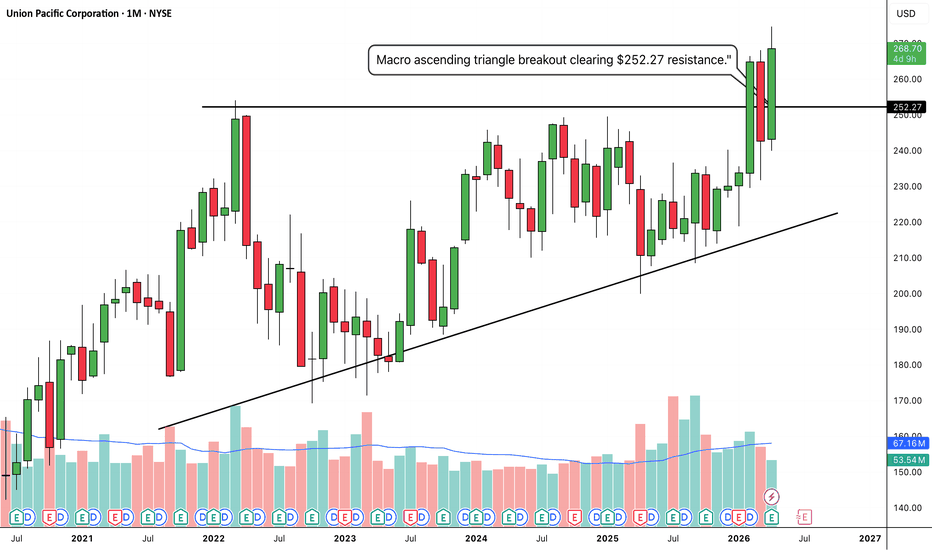
UNP: Massive Macro Breakout From Multi-Year Ascending TriangleThe Setup (Bias): I am taking a LONG bias on Union Pacific Corporation (UNP) on the macro monthly (1M) timeframe.
The "Why" (Technical Reasons): 1. Ascending Triangle Breakout: The price has powerfully broken out of a massive, multi-year ascending triangle pattern. After years of buyers continually stepping in at higher prices (indicated by the rising lower trendline), they have finally overwhelmed the sellers and cleared the flat-top historical resistance at $252.27.
2. Macro Bullish Momentum: The breakout is confirmed by a strong, full-bodied monthly green candle. Breaking out of a structural pattern of this size on a monthly chart indicates a high probability of a sustained, long-term trend continuation.
Trade Plan (Entry & Exits): * Entry: Momentum and position traders can look for entries near the current market price of $268.70. A more conservative, lower-risk approach would be scaling in on a potential monthly pullback to retest the $252.27 breakout line, letting that old historic ceiling prove itself as a new floor.
Take Profit (Target): Based on the measured move of a triangle this large, the momentum can carry it significantly higher. The next major psychological target is the $300.00 milestone, followed by $320.00.
Stop Loss: Placed safely below the breakout line and the rising trendline support, around $230.00. A monthly close below this level would invalidate the ascending triangle structure.
Duration: Because this analysis is built on a massive 1-Month chart, this is a long-term position trade designed to play out over the coming months to years.
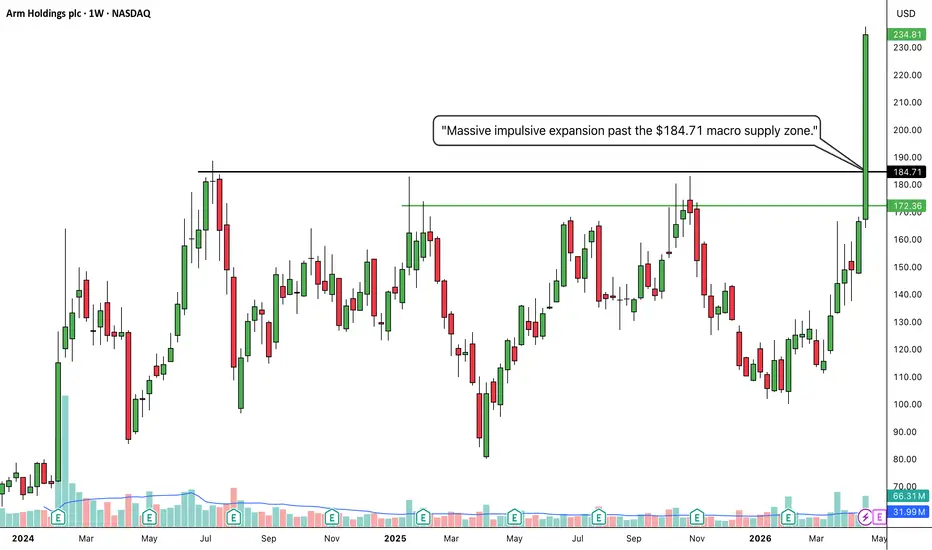
ARM: Explosive Structural Breakout From Multi-Month RangeThe Setup (Bias): I am taking a LONG bias on Arm Holdings plc (ARM) on the weekly timeframe.
The "Why" (Technical Reasons): 1. Major Range Breakout: After a massive, choppy consolidation period spanning back to mid-2024, the price has forcefully broken out of its range. It sliced cleanly through the heavy historical resistance ceiling at $184.71.
2. Extreme Bullish Momentum: The breakout is driven by a gigantic, full-bodied green weekly candle closing near its absolute highs. This type of impulsive, vertical price action indicates aggressive institutional buying and a complete absorption of any overhead supply.
Trade Plan (Entry & Exits): * Entry: Momentum traders can look for entries near the current extended market price of $234.81 to capture the aggressive surge. A safer, lower-risk approach would be waiting for the momentum to eventually cool off and placing limit orders to catch a potential pullback or retest of the $195.00 to $184.71 zone, letting the old ceiling prove itself as a new floor.
Take Profit (Target): With the stock breaking out into fresh blue skies with this much momentum, the next major psychological targets are $250.00, followed by $275.00.
Stop Loss: Placed safely below the green intermediate support line and the breakout origin, around $165.00. A weekly close back below the $184.71 structural level would be an early warning sign of a failed breakout.
Duration: Because this analysis is built on a 1-Week chart, this is a longer-term swing trade designed to play out over the coming weeks to months.
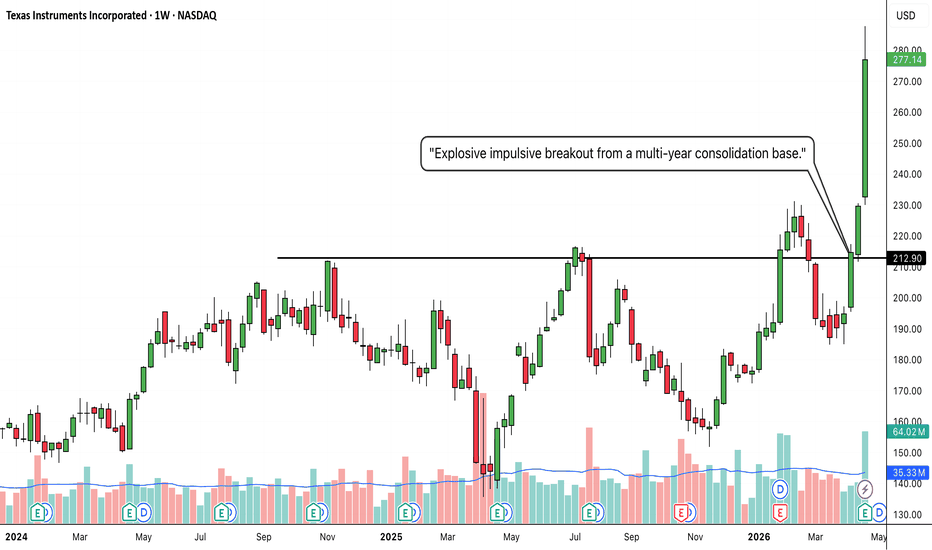
TXN: Explosive Structural Breakout From Multi-Year BaseThe Setup (Bias): I am taking a LONG bias on Texas Instruments Incorporated (TXN) on the weekly timeframe.
The "Why" (Technical Reasons): 1. Major Base Breakout: The price has forcefully broken out of a massive, multi-year consolidation pattern. After finally clearing the heavy historical resistance at the $212.90 level, it built a higher low and then launched upward, completely destroying all overhead supply.
2. Extreme Bullish Momentum: The breakout is driven by a gigantic, full-bodied green weekly candle that closed near its absolute highs. This type of impulsive price action indicates aggressive institutional buying and a complete shift in the macro structure.
Trade Plan (Entry & Exits): * Entry: Momentum traders can look for entries near the current market price of $277.14 to ride the aggressive upside wave. A safer, lower-risk approach would be waiting for the momentum to cool off and placing limit orders to catch a potential pullback or retest of the $266.00 to $250.00 zone.
Take Profit (Target): With the stock breaking out of such a massive base into blue skies, momentum can carry it significantly higher. The next major psychological targets are the $300.00 milestone, followed by $320.00.
Stop Loss: Placed safely below the most recent consolidation block before the massive pump, around $225.00. A weekly close back below the major $212.90 structural level would indicate a complete failure of the breakout thesis.
Duration: Because this analysis is built on a 1-Week chart, this is a longer-term swing trade designed to play out over the coming weeks to months.
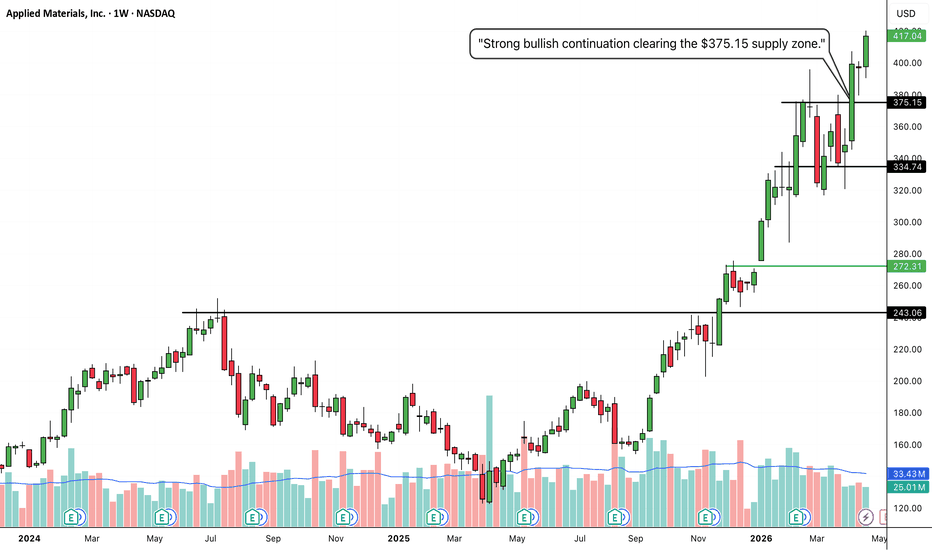
AMAT: Bullish Continuation and Decisive Breakout Above Key ResisThe Setup (Bias): I am taking a LONG bias on Applied Materials, Inc. (AMAT) on the weekly timeframe.
The "Why" (Technical Reasons): 1. Major Resistance Breakout: The price has forcefully broken out above the recent swing high, cleanly slicing through the established resistance level at $375.15 with a strong, full-bodied green weekly candle.
2. Textbook Stair-Step Trend: This breakout confirms a highly robust macro uptrend. Looking historically, the chart demonstrates a perfect pattern of breaking resistance levels and flipping them into solid support floors (as seen clearly at the $270.29 and $334.74 levels). This structural behavior indicates buyers are consistently in control.
Trade Plan (Entry & Exits): * Entry: Momentum traders can look for entries near the current market price of $417.04 to ride the immediate upside. A more conservative, lower-risk entry would involve placing limit orders to catch a potential pullback/retest of the $375.15 to $385.00 zone, waiting for that old ceiling to prove itself as a new floor.
Take Profit (Target): With the stock entering fresh price discovery and showing excellent relative strength, the next major psychological targets are $450.00, followed by the $500.00 milestone.
Stop Loss: Placed safely below the previous structural support step, around $325.00. A weekly close below the $334.74 base would indicate a breakdown in the current stair-step structure and invalidate the immediate bullish thesis.
Duration: Because this analysis is built on a 1-Week chart, this is a medium-to-longer-term swing trade designed to play out over the coming weeks to months.
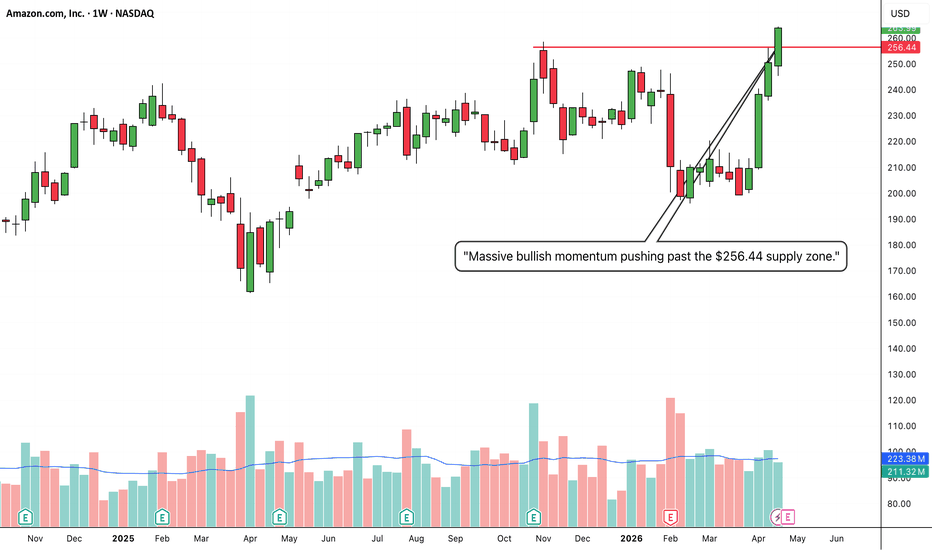
AMZN: Impulsive Breakout Above Major Swing ResistanceThe Setup (Bias): I am taking a LONG bias on Amazon.com, Inc. (AMZN) on the weekly timeframe.
The "Why" (Technical Reasons): 1. Major Resistance Breakout: The price has powerfully broken above the recent structural swing high at $256.44.
2. Aggressive Bullish Momentum: After a sharp pullback, buyers stepped in with immense force. We are now seeing consecutive, massive green weekly candles that have completely erased the previous sell-off. This V-shaped recovery and subsequent breakout show that bulls are in complete control of the macro trend.
Trade Plan (Entry & Exits): * Entry: Momentum traders can look for entries near the current market price of $263.99 to capture the immediate surge. A more conservative, lower-risk approach would be waiting to catch a potential pullback or retest of the $256.44 zone, letting old resistance become new support.
Take Profit (Target): With the stock breaking into fresh territory with immense relative strength, the next major psychological targets are $280.00, followed by the $300.00 milestone.
Stop Loss: Placed safely below the most recent minor structural support on the way up, around $235.00. A weekly close below this level would indicate a failure of the breakout momentum.
Duration: Because this analysis is built on a 1-Week chart, this is a medium-to-longer-term swing trade designed to play out over the coming weeks to months.
NUE: Massive Structural Breakout From Multi-Year RangeThe Setup (Bias): I am taking a LONG bias on Nucor Corporation (NUE) on the weekly timeframe.
The "Why" (Technical Reasons): 1. Macro Resistance Breakout: The price has powerfully broken out of a massive, multi-year consolidation range, decisively clearing the heavy historical ceiling at $195.07 that has capped the stock since 2022.
2. Extreme Bullish Momentum: The breakout is driven by a massive, full-bodied green weekly candle. This explosive price action indicates immense institutional buyer demand stepping in to aggressively push the stock into fresh price discovery.
Trade Plan (Entry & Exits): * Entry: Momentum traders can look for entries near the current market price of $214.29 to ride the aggressive wave. A safer, lower-risk approach would be placing limit orders to catch a potential pullback or retest of the $195.00 to $200.00 zone, waiting for that massive old resistance to prove itself as new support.
Take Profit (Target): With the stock breaking out of a multi-year base into all-time highs, the momentum can carry it significantly higher. The next major psychological targets are $240.00, followed by $250.00.
Stop Loss: Placed safely below the most recent consolidation before the breakout, around $180.00. A weekly close below this level would indicate a false breakout and invalidate the bullish structural shift.
Duration: Because this analysis is built on a 1-Week chart and breaking out of a multi-year base, this is a longer-term swing/position trade designed to play out over the coming weeks to months.
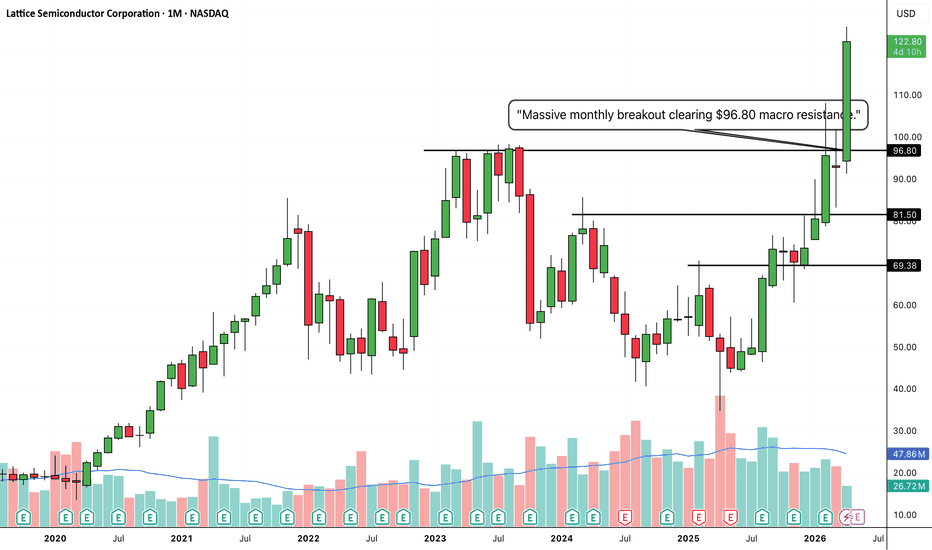
LSCC: Massive Monthly Breakout and Macro Trend ContinuationThe Setup (Bias): I am taking a LONG bias on Lattice Semiconductor Corporation (LSCC) on the macro monthly timeframe.
The "Why" (Technical Reasons): 1. Macro Resistance Breakout: The price has powerfully broken out of a multi-year consolidation phase, decisively clearing the major structural ceiling at $96.80. We also see a beautiful "stepped" pattern of previous resistance levels turning into support on the way up ($69.38 and $81.50).
2. Extreme Bullish Momentum: The current monthly candle is massive and full-bodied, indicating immense, sustained institutional buying pressure over a long period. Sellers have been completely absorbed.
Trade Plan (Entry & Exits): * Entry: Because this monthly candle is so extended at the current price of $122.80, aggressive momentum traders can enter here, but a safer entry would be scaling in on a potential pullback to retest the psychological $100.00 to $96.80 breakout zone.
Take Profit (Target): With the stock breaking into blue skies on a monthly chart, the momentum can carry it significantly higher. The next major psychological targets are $140.00, followed by $150.00.
Stop Loss: Placed safely below the breakout zone and the previous month's consolidation, around $90.00. A monthly close below this level would indicate a structural failure.
Duration: Because this analysis is built on a massive 1-Month (1M) chart, this is a long-term position trade designed to play out over the coming months to over a year.
FIHL: Powerful Structural Breakout From Multi-Year ConsolidationThe Setup (Bias): I am taking a LONG bias on Fidelis Insurance Holdings Limited (FIHL) on the weekly timeframe.
The "Why" (Technical Reasons): 1. Major Resistance Breakout: The price has powerfully broken out of a massive, multi-year consolidation pattern (resembling a large rounding bottom or cup structure), decisively clearing the heavy historical resistance at $19.48.
2. Extreme Bullish Momentum: The breakout is driven by strong, consecutive green weekly candles closing near their absolute highs. This indicates immense buyer demand stepping in to absorb any remaining supply at these levels, shifting the macro structure entirely to the upside.
Trade Plan (Entry & Exits): * Entry: Momentum traders can look for entries near the current market price of $20.96. A safer, more conservative approach would be placing limit orders to catch a potential pullback or retest of the $19.48 to $19.50 zone, looking for that massive old ceiling to flip into a new floor.
Take Profit (Target): With the stock breaking out of such a long-term base, the momentum can carry it significantly higher. The next major psychological and structural targets are $24.00, followed by $25.00.
Stop Loss: Placed safely below the most recent swing low prior to the breakout, around $17.50. A weekly close below this level would indicate a false breakout and invalidate the bullish thesis.
Duration: Because this analysis is built on a 1-Week chart, this is a longer-term swing trade designed to play out over the coming weeks to months.
FLong
ENLT: Clean Structural Breakout and Macro Trend ContinuationThe Setup (Bias): I am taking a LONG bias on Enlight Renewable Energy Ltd. (ENLT) on the weekly timeframe.
The "Why" (Technical Reasons): 1. Major Resistance Breakout: After a brief period of healthy consolidation, the price has cleanly sliced through the established resistance line at $79.30.
2. Macro Bullish Momentum: This breakout is part of a massive, sustained macro uptrend. The buyers are stepping in aggressively, printing full-bodied green weekly candles that show complete control and a high probability of trend continuation.
Trade Plan (Entry & Exits): * Entry: Momentum traders can enter near the current market price of $87.57 to ride the aggressive wave. A more conservative approach would be placing limit orders to catch a potential weekly pullback/retest of the $80.00 to $79.30 zone, looking for old resistance to act as new support.
Take Profit (Target): With the stock breaking higher with this much momentum, the next major psychological target is $100.00, followed by $110.00.
Stop Loss: Placed safely below the recent consolidation and the breakout origin, around $68.00. A weekly close below this level would indicate a structural failure and invalidate the immediate bullish thesis.
Duration: Because this analysis is built on a 1-Week chart, this is a longer-term swing trade designed to ride the trend over the coming weeks to months
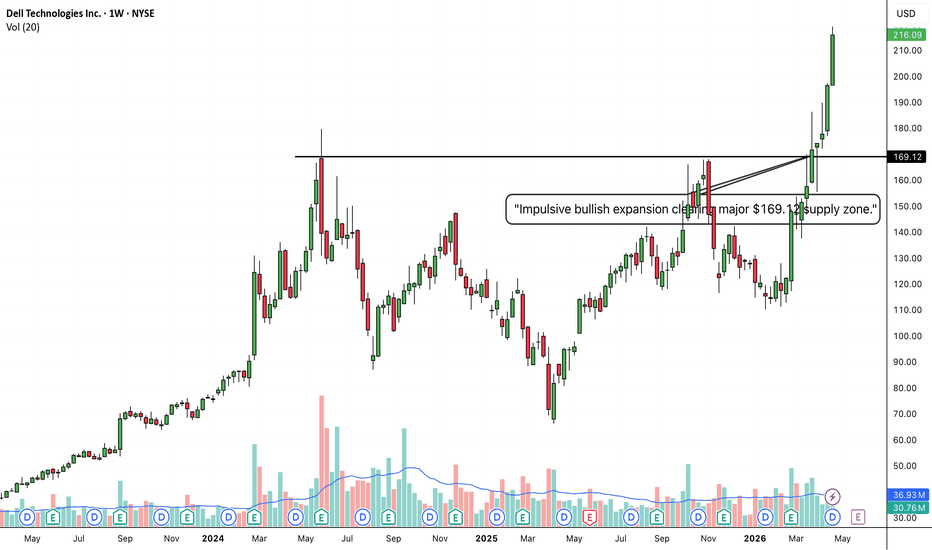
DELL: Massive Structural Breakout from Multi-Month ConsolidationThe Setup (Bias): I am taking a LONG bias on Dell Technologies Inc. (DELL) on the weekly timeframe.
The "Why" (Technical Reasons): 1. Major Structural Breakout: The price has powerfully broken out of a massive, multi-month consolidation pattern, slicing through the heavy historical resistance zone at $169.12.
2. Extreme Bullish Momentum: The breakout is supported by massive, consecutive green weekly candles closing near their highs. This impulsive price action indicates that institutional buyers are aggressively stepping in and overwhelming any remaining supply.
Trade Plan (Entry & Exits): * Entry: Momentum traders can look for entries near the current market price of $216.09 to ride the aggressive wave. A safer, more conservative approach would be placing limit orders to catch a potential pullback/retest of the $180.00 to $170.00 zone.
Take Profit (Target): With the stock entering price discovery and showing extreme momentum, the next major psychological targets are $250.00, followed by $280.00.
Stop Loss: Placed safely below the breakout origin and recent swing structure, around $155.00. A weekly close below this level would indicate a false breakout and invalidate the bullish thesis.
Duration: Because this analysis is built on a 1-Week chart, this is a longer-term swing trade designed to play out over the coming weeks to months.
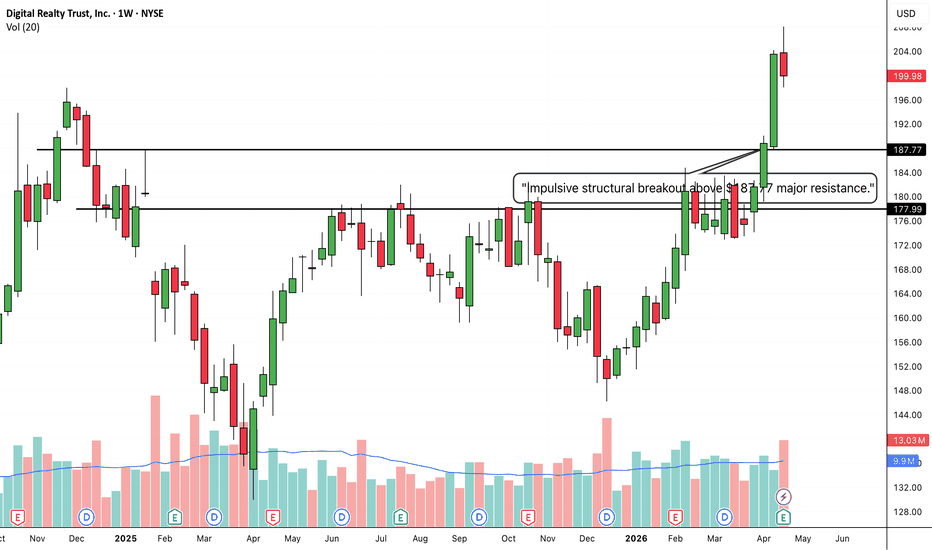
DLR: Impulsive Structural Breakout from Long-Term ConsolidationThe Setup (Bias): I am taking a LONG bias on Digital Realty Trust, Inc. (DLR) on the weekly timeframe.
The "Why" (Technical Reasons): 1. Major Range Breakout: After months of choppy consolidation, the price has forcefully broken out of its trading range, slicing through the heavy structural resistance at $187.77.
2. Extreme Bullish Momentum: The breakout candle is a massive, full-bodied weekly green candle closing near its absolute high. This indicates immense buyer demand and a complete lack of selling pressure at these new levels.
Trade Plan (Entry & Exits): 1. Entry: Momentum traders can enter near the current market price of $199.98. A more conservative, lower-risk entry would be placing limit orders to catch a potential retest of the $187.77 level, looking for that old resistance to act as new support.
2. Take Profit (Target): With the stock breaking into fresh territory, the next logical psychological targets are $220.00, followed by $230.00.
3. Stop Loss: Placed safely below the intermediate support level and breakout origin, around $175.00. A weekly close below this level would indicate a false breakout and invalidate the setup.
Duration: Because this analysis is built on a 1-Week chart, this is a longer-term swing trade designed to play out over the coming weeks to months.
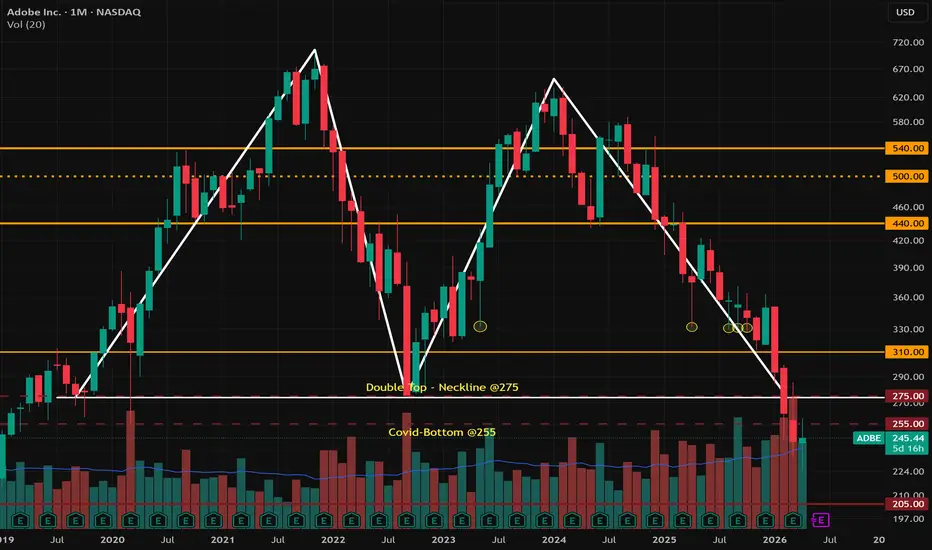
ADOBE - Technically very weakOn a monthly graph, Adobe shows a very large Double-Top pattern. The breakdown happened at $275, and the potential target comes down to $111.
However, the company has announced a $25 Billion buyback, which should support the stock price. The next couple of months are critical for Adobe to recover above the neckline of $275 to hopefully nullify this double top pattern.
CSX: Stepping Up – Major Resistance Cleared for Trend ContinuatiThe Setup (Bias): I am taking a LONG bias on CSX Corporation (CSX) on the weekly timeframe.
The "Why" (Technical Reasons): 1. Secondary Breakout: The price has cleanly broken through the recent swing-high resistance at $43.11 with a strong, full-bodied weekly candle, indicating aggressive buyer momentum.
2. Textbook S/R Flip: Before this latest push, we saw the price break above the long-term historical resistance at $38.15, pull back to retest it, and bounce perfectly. That prior ceiling is now a confirmed floor, validating the structural strength of this uptrend.
Trade Plan (Entry & Exits): * Entry: Entering near the current market price of $45.41. A more conservative entry would be waiting for a minor daily pullback to retest the $43.11 level as new support.
Take Profit (Target): Riding the momentum into new territory, the next logical psychological targets are $50.00, followed by $55.00.
Stop Loss: Placed below the recent swing low and the previous breakout zone, around $39.50. If the price breaks back below the $40 psychological level, the current upward structure is broken.
Duration: Because this analysis is built on a 1-Week chart, this is a longer-term swing trade designed to play out over the coming weeks to a few months.
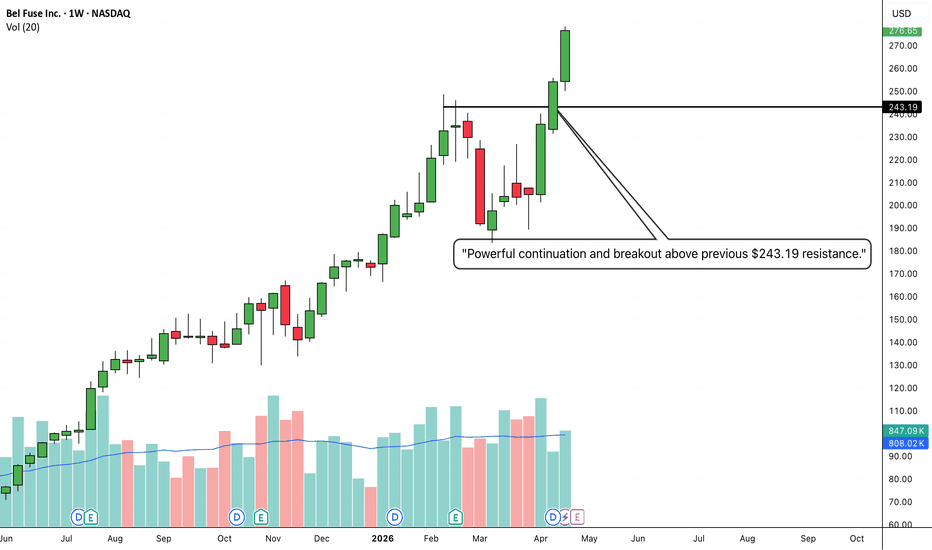
BELFB: Strong Uptrend Continuation and Breakout to New HighsThe Setup (Bias): I am taking a LONG bias on Bel Fuse Inc. (BELFB) on the weekly timeframe.
The "Why" (Technical Reasons): 1. Major Breakout: The price has cleanly broken above the previous swing high resistance at $243.19, confirming the continuation of the trend.
2. Powerful Momentum: After a brief two-week pullback, buyers aggressively stepped back in. The massive green weekly candle completely engulfs the previous selling pressure, showing that bulls are entirely in control of this long-term uptrend.
Trade Plan (Entry & Exits): * Entry: Momentum traders can enter near the current market price of $276.65. Alternatively, you can place limit orders to catch a potential slight pullback toward the $250.00 - $260.00 zone.
Take Profit (Target): With the stock entering price discovery (new all-time highs), the next major psychological targets are $300.00 and then $320.00.
Stop Loss: Placed safely below the breakout level and the recent consolidation wick, around $220.00, to manage risk.
Duration: Because this analysis is built on a 1-Week chart, this is a longer-term swing trade designed to ride the trend over the coming weeks to months.
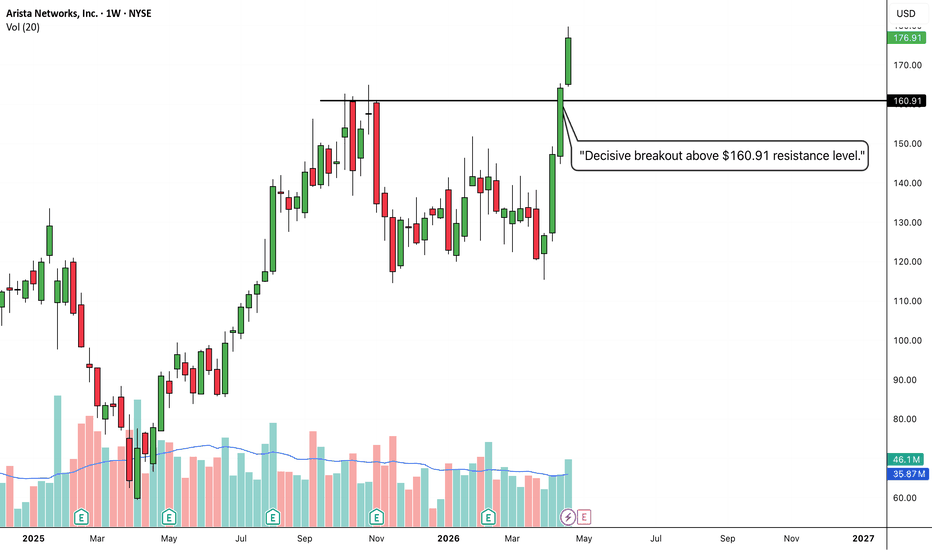
ANET: Decisive Breakout Above Major Resistance ZoneThe Setup (Bias): I am taking a LONG bias on Arista Networks, Inc. (ANET) on the weekly timeframe.
The "Why" (Technical Reasons): 1. Major Breakout: The price has powerfully surged past the previous strong resistance level at $160.91.
2. Bullish Momentum: After a period of consolidation and a recent pullback, the buyers have stepped in with massive strength, printing a huge bullish weekly candle that shows they are in complete control of the trend.
Trade Plan (Entry & Exits): * Entry: An entry can be taken near the current market price of $176.91 to capture the momentum. A more conservative approach would be waiting for a potential retest of the $160.91 level (to see if old resistance turns into new support).
Take Profit (Target): With this kind of momentum and clear skies ahead, the next major psychological target is $200.00.
Stop Loss: Placed safely below the breakout level, around $150.00, to protect capital in case this turns out to be a false breakout and falls back into the old range.
Duration: Based on this 1-Week chart, this is a swing trade setup intended to play out over the next few weeks to months.
ELVR: Massive Momentum Breakout Above Key ResistanceThe Setup (Bias): I am taking a LONG bias on Elevra Lithium Limited (ELVR) on the weekly timeframe.
The "Why" (Technical Reasons): 1. Major Resistance Breakout: The price has powerfully broken through the established horizontal resistance level at $68.49.
2. Strong Bullish Momentum: We are seeing back-to-back massive green weekly candles with very little upper wicks, indicating intense buyer demand and complete control by the bulls, overpowering any selling pressure.
Trade Plan (Entry & Exits): * Entry: An aggressive entry can be taken near current market price ($86.24) to ride the momentum, but a safer, more conservative entry would be waiting for a minor pullback/retest of the $70.00 to $68.49 zone.
Take Profit (Target): With no immediate historical resistance overhead, the next logical target is the major psychological level of $100.00, followed by $115.00.
Stop Loss: Placed strictly at $65.00. If the price falls back below the previous resistance line, it signals a "fakeout," and the bullish thesis is invalidated.
Duration: Because this is based on a 1-Week chart, this is a longer-term swing trade that should play out over the coming weeks to a few months.
HUBB: Strong Weekly Breakout and Trend ContinuationThe Setup (Bias): I am looking at a LONG setup for Hubbell Inc. (HUBB) on the weekly timeframe.
The "Why" (Technical Reasons): 1. Clear Breakout: The price has shown strong bullish momentum and decisively broken above the recent resistance level at $529.82.
2. Support Confirmation & Trend: Prior to this breakout, we saw a textbook retest of the major $467.76 level. This area acted as heavy resistance in the past but flipped perfectly into new support, confirming the overall upward trend of higher highs and higher lows.
Trade Plan (Entry & Exits): * Entry: Entering near the current market price of $553.07, or waiting to see if it slightly pulls back to retest the $530 level.
Take Profit (Target): Since the stock is breaking into new all-time highs, aiming for the next major psychological resistance level at $600.00.
Stop Loss: Placed securely below the recent breakout zone, around $510.00. If it drops below this, the breakout is invalidated and it falls back into the old range.
Duration: Because this analysis is built on a 1-Week chart, this is a longer-term swing trade that is expected to play out over the next several weeks to a few months.
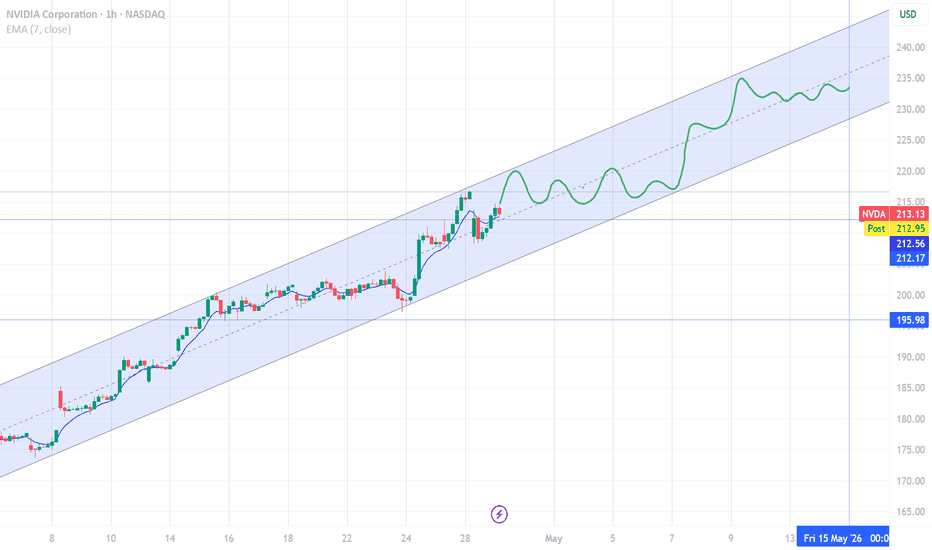
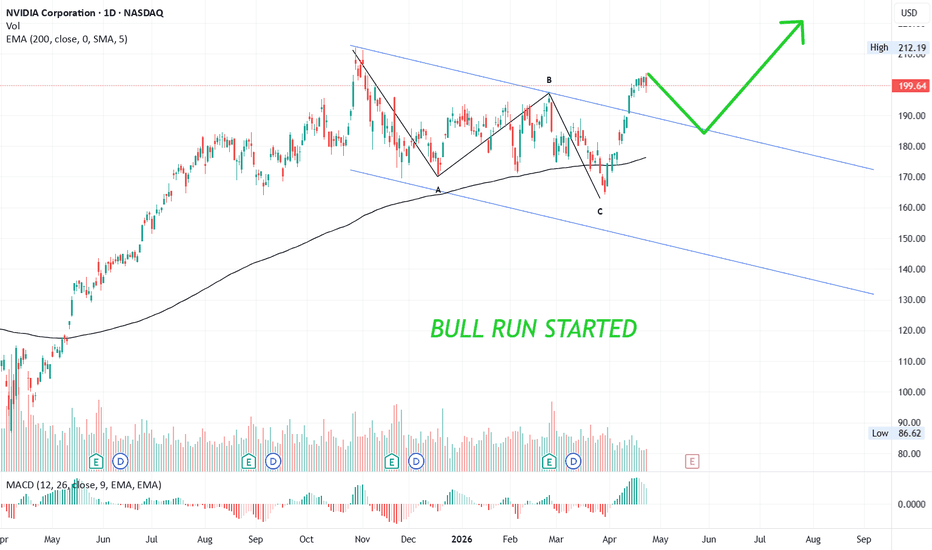
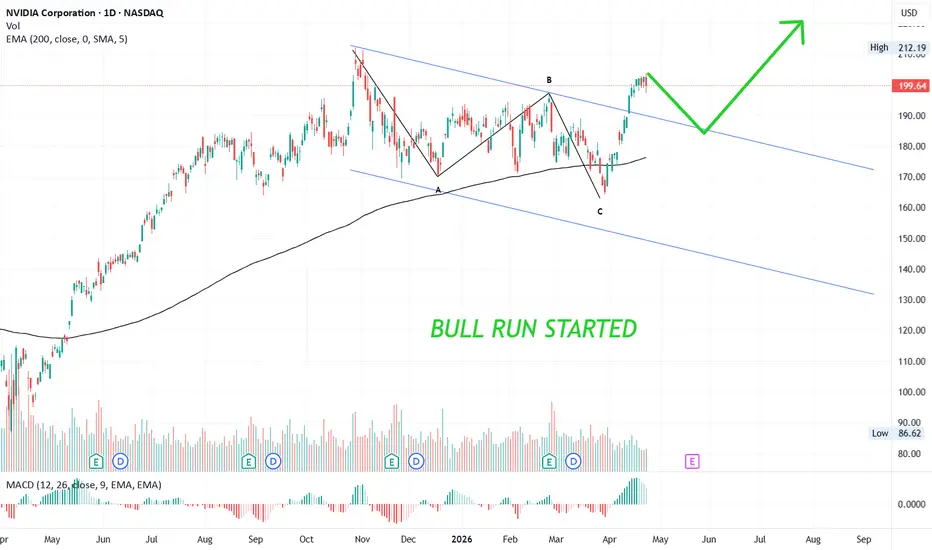
#NVIDIA BULL SUN STARTED🚀 Nvidia: Correction & Breakout Story 📊🔥
📉 Started its correction on 30 Oct
🔻 A wave completed on 17 Dec with a low of $171
➡️ Fell in 5 subwaves, signaling a zig‑zag correction 🌀
📈 Price retraced to $198 in B wave
⚡️ Then sharply dropped, forming C wave in 5 subwaves on 30 Mar
✨ Breakout confirmed after smashing the 0‑B trendline 💥
⏳ Retracement of B wave happened in less time than it took to form ⏱️
👉 Any pullback = golden opportunity to accumulate for long‑term gains 💎📈
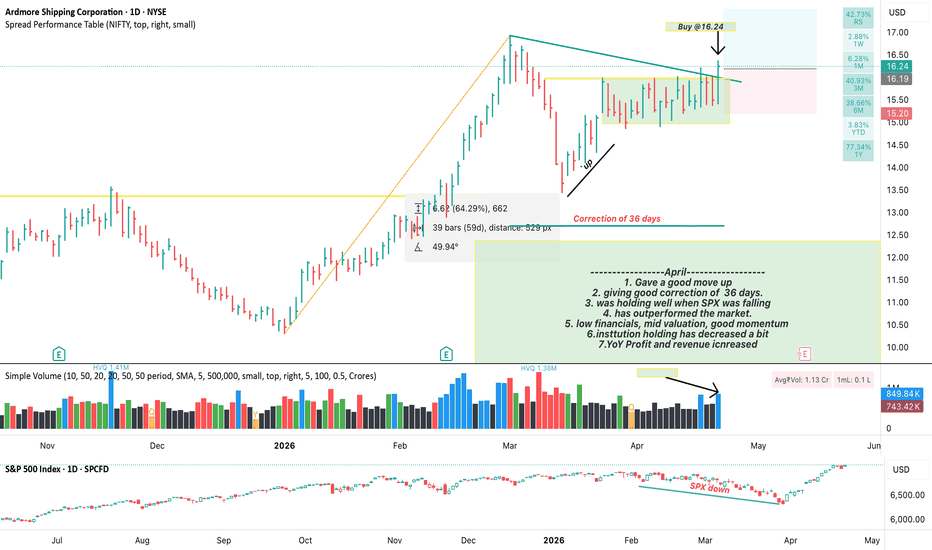
ARDMORE(ASC) shipping corporation analysis-----------------I am going to buy this stock because of following reason-----------------
1. Gave a good move up
2. giving good correction of 36 days.
3. was holding well when SPX was falling
4. has outperformed the market.
5.good momentum
6.institution has been buying this stock in last quarter
7.YoY Profit and revenue increased.
I am managing my risk by stop loss of 6.1%, i will target profit of 25-30% and then will trail.
PS:- This is only for learning purpose and not a tip or recommendation.