Long
Long
 Long
Long
 Long
Long
MU: Explosive Structural Breakout From Multi-Month ConsolidationThe Setup (Bias): I am taking a LONG bias on Micron Technology, Inc. (MU) on the weekly timeframe.
The "Why" (Technical Reasons): 1. Major Resistance Breakout: After a healthy period of chopping sideways and building energy, the price has forcefully broken out of its consolidation range, slicing cleanly through the strong structural resistance at $450.46.
2. Extreme Bullish Momentum: The breakout is driven by a massive, full-bodied green weekly candle closing near its absolute highs. This indicates aggressive institutional buying pressure and a complete lack of seller pushback at these elevated levels.
Trade Plan (Entry & Exits): * Entry: Momentum traders can look for entries near the current market price of $496.72 to capture the immediate surge. A safer, lower-risk approach would be placing limit orders to catch a potential pullback or retest of the $450.46 zone, letting the old ceiling prove itself as a new floor.
Take Profit (Target): With the stock breaking into fresh all-time highs with immense relative strength, the next major psychological milestones are $550.00, followed by $600.00.
Stop Loss: Placed safely below the breakout zone and recent minor support, around $400.00. A weekly close below this level would indicate a failure of the breakout structure.
Duration: Because this analysis is built on a 1-Week chart, this is a medium-to-longer-term swing trade designed to play out over the coming weeks to months.  Long
Long
BHE: Powerful Breakout Above $60 Signals Further UpsideThe Setup (Bias): I am taking a LONG bias on Benchmark Electronics, Inc. (BHE) on the weekly timeframe.
The "Why" (Technical Reasons): 1. Decisive Resistance Breakout: The stock has powerfully broken out of its recent consolidation zone, slicing through the $60.13 resistance level with a massive, high-momentum bullish candle.
2. Support Confirmation: Prior to this breakout, we can see the price successfully tested and held the $51.37 level. This proves that the older historical resistance has beautifully flipped into a strong support floor, giving buyers the confidence to push the price higher.
Trade Plan (Entry & Exits): * Entry: Momentum traders can look for entries near the current market price of $69.52. A more conservative approach would be placing limit orders to catch a potential slight pullback or retest of the $60.00 - $65.00 zone.
Take Profit (Target): With strong upward momentum and clear skies, the next major psychological targets are $80.00, followed by $85.00.
Stop Loss: Placed safely below the breakout zone, around $55.00. If the price falls back below this level, the breakout is invalidated.
Duration: Because this analysis is built on a 1-Week chart, this is a longer-term swing trade designed to ride the trend over the coming weeks to months.  Long
Long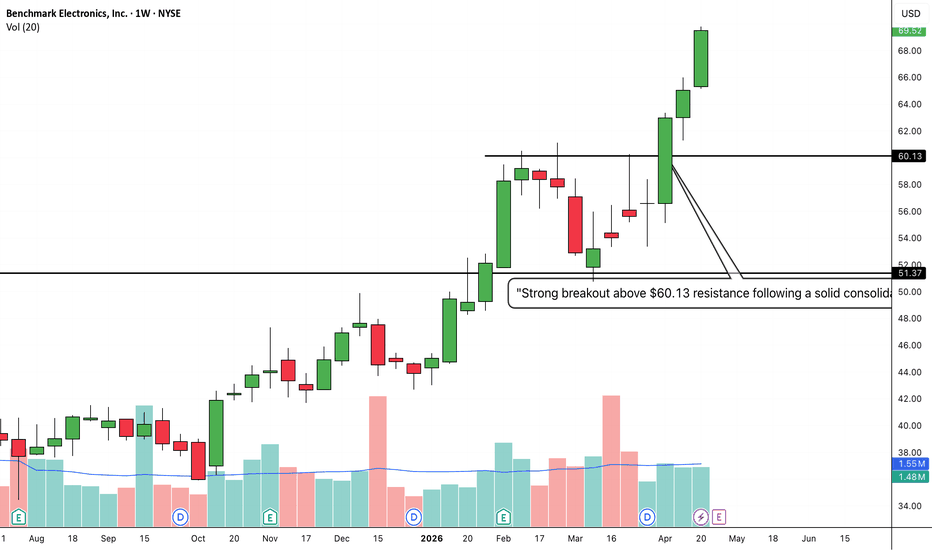
 Long
Long
 Long
Long
 Long
Long
 Long
Long
 Long
Long
 Long
Long
 Long
Long
Long 
VLO – Valero Energy Corporation | Bullish Continuation SetupVLO – Valero Energy Corporation
Exchange: NYSE | Timeframe: Daily | Bias: Bullish
📊 T echnical Analysis:
Current Price: $235.85 | 52-Week High: $258.43 | Key Support: $214.71
The chart shows VLO has been in a strong uptrend since August 2025, riding a rising channel supported by a steeply rising 200-day MA (currently ~$193). After making an all-time high at $258.43 in mid-March, the stock has entered a healthy pullback/consolidation phase, printing a descending wedge pattern off the highs a classic bull-flag precursor.
Key Levels:
🟢 Support Zone: $214.71 — A major horizontal level that held during the April dip. This is the "line in the sand."
]🛑 Resistance: $240–$242 — Overhead supply from prior consolidation; needs a clean breakout with volume.
🎯 Target 1: $258.43 (retest ATH)
🎯 Target 2: $270–$275 (measured move / analyst consensus)
🛑 Stop Loss: Below $212 (close below $214.71 support invalidates the setup)
Indicators:
RS Rating: 91 — Exceptional relative strength versus the broader market. VLO is outperforming the S&P 500 significantly.
RSI (~52): Neutral, providing room to move higher without being overbought.
MACD (lower panel): Showing early signs of a bullish crossover attempt (2.31 vs 0.65 signal), a setup to watch.
Volume: Distribution markers (D) visible near the March peak, but accumulation (E) signals are now re-emerging — institutional activity returning.
The upper indicator (likely a market breadth or sector relative strength oscillator) peaked with price and is curling back — suggests the correction may be maturing.
📰 Fundamental Catalyst:
Analysts expect a massive 233.7% year-over-year EPS increase for Q1 2026. Yahoo Finance Q1 2026 results are due on April 30, 2026, with consensus expecting EPS of $2.70 and revenue of $31.04B
Multiple analyst upgrades have flooded in — Raymond James raised to Strong Buy with a $290 target, Wells Fargo raised to $292, and UBS raised to $280.
The Port Arthur refinery (380,000 bpd) has begun partial restart after a March 23 explosion — removal of this overhang is a near-term positive catalyst.
Diesel prices spiking has made VLO a direct beneficiary, with analysts flagging potential 14% capital return yields from dividends and buybacks combined.
This is a technical + fundamental analysis idea for educational purposes only. Not financial advice. Earnings on April 30 create elevated volatility risk — size positions accordingly.
 Long
Long
 Long
Long
TT: Textbook Cup & Handle Completion and Macro Breakout1. The Macro Perspective: The Deep Washout and Recovery
I am taking a LONG bias on Trane Technologies plc (TT) on the weekly (1W) timeframe.
When analyzing a stock in a massive secular uptrend, we want to see healthy consolidation phases to ensure longevity. Months ago, TT established a major historical ceiling right at the 471.70 level. What followed was a deep, highly volatile correction that successfully washed out late, over-leveraged buyers. However, instead of bleeding into a new bear market, the stock initiated a methodical, multi-month process of accumulation. It carved out a massive rounding bottom—the "Cup"—slowly absorbing overhead supply and grinding its way back up to the original 471.70 crime scene.
2. The Educational Setup: The Handle and The Higher Low
To understand the mechanics of this current breakout, we must look at how the price reacted when it finally retested that 471.70 ceiling:
The Digestion (Handle): As expected, when the stock hit 471.70 again, it faced selling pressure from bag-holders who had been trapped for months. The price rejected and pulled back, forming the "Handle" of the pattern.
The Structural Floor: Notice that this pullback did not result in a market crash. Buyers stepped in aggressively around the 410.00-420.00 zone, forming a massive macro higher low. This shallow pullback directly underneath major resistance shows that institutional buyers were willingly absorbing shares at premium prices, storing immense kinetic energy for the final thrust.
3. Current Price Action: Blue Sky Territory
Look at the most recent weekly candle on the far right. The stored energy from the handle has been unleashed. Buyers have effortlessly shattered the 471.70 macro resistance, closing near absolute highs. By clearing this final historical ceiling, the stock has officially entered "Blue Sky Territory" (pure price discovery). There is zero historical overhead supply left. Every single person who has ever bought this stock and held is now in profit, which means selling pressure naturally evaporates.
4. The Trade Plan: Entries, Targets, and Risk Management
Entry Strategy: Momentum is exceptionally strong right now near 486.50. While aggressive momentum traders might buy the breakout directly, the highest-probability, lowest-risk entry involves stepping down to a daily timeframe and placing limit orders to catch a potential minor pullback to retest the 471.00 to 475.00 breakout zone. Letting that old, heavy resistance prove itself as a new, indestructible support floor offers a phenomenal risk-to-reward ratio.
Take Profit (Targets): Because the stock is in pure price discovery, we use measured structural targets. By taking the depth of the macro cup (roughly 150 points from the base to the neckline) and projecting it upward, our primary structural target sits near the 620.00 zone. Immediate psychological milestones are 500.00 and 550.00.
Invalidation (Stop Loss): A trade thesis is only valid if the new market structure holds. A hard stop loss should be placed safely below the recent "handle" pivot low, around the 415.00 to 425.00 level. A definitive weekly close completely back below the 471.70 line would act as an early warning sign of a failed macro breakout (a "bull trap").
5. Time Horizon:
Because this technical setup is built on a 1-Week chart capturing a massive structural completion into fresh price discovery, this is a medium-to-longer-term position trade designed to play out over the coming weeks to months. Let the macro trend run!  Long
Long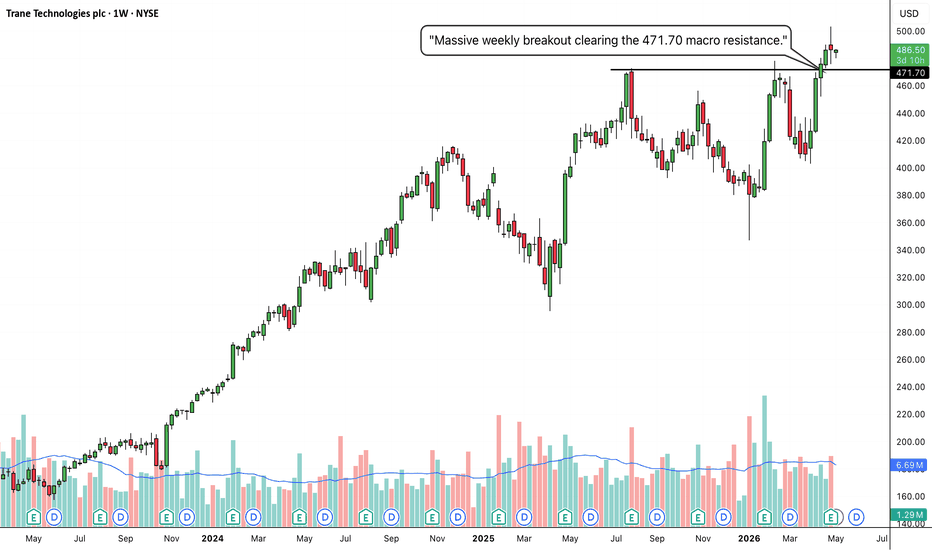
ETN: Textbook Step-Up Base and Explosive Macro Continuation1. The Macro Perspective: Building the Staircase
I am taking a LONG bias on Eaton Corporation (ETN) on the weekly (1W) timeframe.
When analyzing a healthy, sustainable macro trend, we want to see the market building a "staircase." Look at the structural development on this chart. ETN hit a massive historical ceiling near 373.80 and spent months in a deep, volatile consolidation to wash out weak hands. Eventually, it broke out above that line. However, instead of going parabolic and risking a violent crash, the stock did exactly what it was supposed to do: it built a "Step-Up Base."
2. The Educational Setup: Flipping Ceilings into Floors
The absolute best risk-to-reward setups occur when a stock proves its new support levels.
The New Floor: After breaking above the solid black 373.80 line, the stock established a new, higher consolidation zone. It repeatedly used that old 373.80 resistance as a brand new, rock-solid support floor. Institutional buyers aggressively defended it.
The Pressure Cooker: By defending that floor, the price chopped sideways and established a new local resistance ceiling at the dashed 392.09 line. This tight, controlled consolidation phase digested the recent gains, transferred shares to strong hands, and stored massive kinetic energy for the next structural leg up.
3. Current Price Action: Blue Sky Territory
Look at the most recent weekly candles on the far right. After perfectly respecting the bounds of its new step-up base, the stored energy has been unleashed. Buyers have effortlessly shattered the 392.09 continuation resistance, and the stock is surging into the 420s. By clearing this final consolidation zone, ETN has officially entered "Blue Sky Territory" (pure price discovery). There is zero historical overhead supply left to act as resistance.
4. The Trade Plan: Entries, Targets, and Risk Management
Entry Strategy: The stock is currently experiencing extreme upside momentum near 422.44. Chasing a massive weekly expansion candle carries a higher risk of immediate drawdown. The highest-probability, lowest-risk entry involves stepping down to a daily timeframe and placing limit orders to catch a potential minor structural pullback to retest the 392.00 to 400.00 breakout zone. Letting that newly broken ceiling prove itself as the newest step on the staircase offers a phenomenal risk-to-reward ratio.
Take Profit (Targets): Because the stock is in pure price discovery, we use measured structural targets. By taking the depth of the massive macro correction (roughly 110 points from the ~260 lows to the 373 neckline) and projecting it upward, our primary macro target sits near the 480.00 to 500.00 zone.
Invalidation (Stop Loss): A trade thesis is only valid if the new market structure holds. A hard stop loss should be placed safely below the recent step-up base, around the 360.00 to 370.00 level. A definitive weekly close completely back below the original 373.80 macro line would invalidate the breakout and signal a major structural failure.
5. Time Horizon:
Because this technical setup is built on a 1-Week chart capturing a major structural continuation into fresh price discovery, this is a medium-to-longer-term position trade designed to play out over the coming weeks to months. Let the macro trend run!  Long
Long
 Long
Long
MO: Textbook Macro Break & Retest and Explosive Continuation1. The Macro Perspective: Conquering the Ceiling
I am taking a LONG bias on Altria Group, Inc. (MO) on the weekly (1W) timeframe.
When analyzing pure market structure, horizontal lines dictate the flow of supply and demand. Looking at this chart, MO was in a steady uptrend until it hit a major roadblock near the 65.67 level. After a sharp, aggressive shakeout (the large red candle), the stock methodicaly grinded its way back up and finally shattered that 65.67 structural ceiling. However, the real trading opportunity didn't present itself on the initial breakout.
2. The Educational Setup: Old Ceilings Become New Floors
The absolute best risk-to-reward setups require patience. After breaking above 65.67, the stock didn't just run away. It paused.
The Retest: For several weeks, the price chopped sideways, forming a tight consolidation pattern (a high "bull flag"). During this phase, it repeatedly tested the 65.67 level from above.
The Confirmation: Every time the price dipped to that line, buyers stepped in, leaving wicks on the bottom of the candles. This sideways absorption officially confirmed that the old, heavy resistance ceiling had flipped into a rock-solid support floor.
3. Current Price Action: The Expansion Phase
Look at the most recent weekly candle on the far right. After weeks of tightly coiled consolidation on top of new support, the stored kinetic energy has been unleashed. This massive, full-bodied green candle represents explosive continuation. Buyers have officially accepted the new, higher valuation and are aggressively bidding the stock up into fresh territory.
4. The Trade Plan: Entries, Targets, and Risk Management
Entry Strategy: The stock is currently experiencing extreme upside momentum near 74.55. The highest-probability entry was during that multi-week retest of 65.67. Entering now means chasing an extended weekly candle, which carries a higher risk of immediate drawdown. Prudent traders who missed the launchpad should step down to a daily timeframe and wait for a minor structural pullback to form a new higher low before entering.
Take Profit (Targets): With the stock successfully defending its macro breakout and expanding violently, it enters a void of overhead supply. The immediate psychological targets are the 80.00 and 85.00 macro levels.
Invalidation (Stop Loss): A trade thesis is only valid if the market structure holds. For those already in position, a hard stop loss should be trailed below the base of the recent multi-week consolidation, around the 62.00 to 64.00 level. A weekly candle closing completely back below the 65.67 line would invalidate the breakout and signal a potential bull trap.
5. Time Horizon:
Because this technical setup is built on a 1-Week chart capturing a major structural break and retest, this is a medium-to-longer-term position trade designed to play out over the coming weeks to months. Let the price action dictate the trend!  Long
Long
 Long
Long